Bangladeshi Disability Age Under 5

COMPARE

Bangladeshi
Race
Ancestry
AfghanAfricanAlaska NativeAlaskan AthabascanAlbanianAleutAlsatianAmericanApacheArabArapahoArgentineanArmenianAssyrian/Chaldean/SyriacAustralianAustrianBahamianBangladeshiBarbadianBasqueBelgianBelizeanBermudanBhutaneseBlackfeetBolivianBrazilianBritishBritish West IndianBulgarianBurmeseCajunCambodianCanadianCape VerdeanCarpatho RusynCelticCentral AmericanCentral American IndianCherokeeCheyenneChickasawChileanChineseChippewaChoctawColombianColvilleComancheCosta RicanCreeCreekCroatianCrowCubanCypriotCzechCzechoslovakianDanishDelawareDominicanDutchDutch West IndianEastern EuropeanEcuadorianEgyptianEnglishEstonianEthiopianEuropeanFijianFilipinoFinnishFrenchFrench American IndianFrench CanadianGermanGerman RussianGhanaianGreekGuamanian/ChamorroGuatemalanGuyaneseHaitianHmongHonduranHopiHoumaHungarianIcelanderIndian (Asian)IndonesianInupiatIranianIraqiIrishIroquoisIsraeliItalianJamaicanJapaneseJordanianKenyanKiowaKoreanLaotianLatvianLebaneseLiberianLithuanianLumbeeLuxembourgerMacedonianMalaysianMalteseMarshalleseMenomineeMexicanMexican American IndianMongolianMoroccanNative HawaiianNavajoNepaleseNew ZealanderNicaraguanNigerianNorthern EuropeanNorwegianOkinawanOsageOttawaPaiutePakistaniPalestinianPanamanianParaguayanPennsylvania GermanPeruvianPimaPolishPortuguesePotawatomiPuebloPuerto RicanPuget Sound SalishRomanianRussianSalvadoranSamoanScandinavianScotch-IrishScottishSeminoleSenegaleseSerbianShoshoneSierra LeoneanSiouxSlavicSlovakSloveneSomaliSouth AfricanSouth AmericanSouth American IndianSoviet UnionSpaniardSpanishSpanish AmericanSpanish American IndianSri LankanSubsaharan AfricanSudaneseSwedishSwissSyrianTaiwaneseThaiTlingit-HaidaTohono O'OdhamTonganTrinidadian and TobagonianTsimshianTurkishU.S. Virgin IslanderUgandanUkrainianUruguayanUteVenezuelanVietnameseWelshWest IndianYakamaYaquiYugoslavianYumanYup'ikZimbabwean
Immigration
NonimmigrantsImmigrantsAfghanistanAfricaAlbaniaArgentinaArmeniaAsiaAustraliaAustriaBahamasBangladeshBarbadosBelarusBelgiumBelizeBoliviaBosnia and HerzegovinaBrazilBulgariaBurma/MyanmarCabo VerdeCambodiaCameroonCanadaCaribbeanCentral AmericaChileChinaColombiaCongoCosta RicaCroatiaCubaCzechoslovakiaDenmarkDominicaDominican RepublicEastern AfricaEastern AsiaEastern EuropeEcuadorEgyptEl SalvadorEnglandEritreaEthiopiaEuropeFijiFranceGermanyGhanaGreeceGrenadaGuatemalaGuyanaHaitiHondurasHong KongHungaryIndiaIndonesiaIranIraqIrelandIsraelItalyJamaicaJapanJordanKazakhstanKenyaKoreaKuwaitLaosLatin AmericaLatviaLebanonLiberiaLithuaniaMalaysiaMexicoMicronesiaMiddle AfricaMoldovaMoroccoNepalNetherlandsNicaraguaNigeriaNorth AmericaNorth MacedoniaNorthern AfricaNorthern EuropeNorwayOceaniaPakistanPanamaPeruPhilippinesPolandPortugalRomaniaRussiaSaudi ArabiaScotlandSenegalSerbiaSierra LeoneSingaporeSomaliaSouth AfricaSouth AmericaSouth Central AsiaSouth Eastern AsiaSouthern EuropeSpainSri LankaSt. Vincent and the GrenadinesSudanSwedenSwitzerlandSyriaTaiwanThailandTrinidad and TobagoTurkeyUgandaUkraineUruguayUzbekistanVenezuelaVietnamWest IndiesWestern AfricaWestern AsiaWestern EuropeYemenZaireZimbabweAzores
Select to Compare
Race
Ancestry
AfghanAfricanAlaska NativeAlaskan AthabascanAlbanianAleutAlsatianAmericanApacheArabArapahoArgentineanArmenianAssyrian/Chaldean/SyriacAustralianAustrianBahamianBarbadianBasqueBelgianBelizeanBermudanBhutaneseBlackfeetBolivianBrazilianBritishBritish West IndianBulgarianBurmeseCajunCambodianCanadianCape VerdeanCarpatho RusynCelticCentral AmericanCentral American IndianCherokeeCheyenneChickasawChileanChineseChippewaChoctawColombianColvilleComancheCosta RicanCreeCreekCroatianCrowCubanCypriotCzechCzechoslovakianDanishDelawareDominicanDutchDutch West IndianEastern EuropeanEcuadorianEgyptianEnglishEstonianEthiopianEuropeanFijianFilipinoFinnishFrenchFrench American IndianFrench CanadianGermanGerman RussianGhanaianGreekGuamanian/ChamorroGuatemalanGuyaneseHaitianHmongHonduranHopiHoumaHungarianIcelanderIndian (Asian)IndonesianInupiatIranianIraqiIrishIroquoisIsraeliItalianJamaicanJapaneseJordanianKenyanKiowaKoreanLaotianLatvianLebaneseLiberianLithuanianLumbeeLuxembourgerMacedonianMalaysianMalteseMarshalleseMenomineeMexicanMexican American IndianMongolianMoroccanNative HawaiianNavajoNepaleseNew ZealanderNicaraguanNigerianNorthern EuropeanNorwegianOkinawanOsageOttawaPaiutePakistaniPalestinianPanamanianParaguayanPennsylvania GermanPeruvianPimaPolishPortuguesePotawatomiPuebloPuerto RicanPuget Sound SalishRomanianRussianSalvadoranSamoanScandinavianScotch-IrishScottishSeminoleSenegaleseSerbianShoshoneSierra LeoneanSiouxSlavicSlovakSloveneSomaliSouth AfricanSouth AmericanSouth American IndianSoviet UnionSpaniardSpanishSpanish AmericanSpanish American IndianSri LankanSubsaharan AfricanSudaneseSwedishSwissSyrianTaiwaneseThaiTlingit-HaidaTohono O'OdhamTonganTrinidadian and TobagonianTsimshianTurkishU.S. Virgin IslanderUgandanUkrainianUruguayanUteVenezuelanVietnameseWelshWest IndianYakamaYaquiYugoslavianYumanYup'ikZimbabwean
Immigration
NonimmigrantsImmigrantsAfghanistanAfricaAlbaniaArgentinaArmeniaAsiaAustraliaAustriaBahamasBangladeshBarbadosBelarusBelgiumBelizeBoliviaBosnia and HerzegovinaBrazilBulgariaBurma/MyanmarCabo VerdeCambodiaCameroonCanadaCaribbeanCentral AmericaChileChinaColombiaCongoCosta RicaCroatiaCubaCzechoslovakiaDenmarkDominicaDominican RepublicEastern AfricaEastern AsiaEastern EuropeEcuadorEgyptEl SalvadorEnglandEritreaEthiopiaEuropeFijiFranceGermanyGhanaGreeceGrenadaGuatemalaGuyanaHaitiHondurasHong KongHungaryIndiaIndonesiaIranIraqIrelandIsraelItalyJamaicaJapanJordanKazakhstanKenyaKoreaKuwaitLaosLatin AmericaLatviaLebanonLiberiaLithuaniaMalaysiaMexicoMicronesiaMiddle AfricaMoldovaMoroccoNepalNetherlandsNicaraguaNigeriaNorth AmericaNorth MacedoniaNorthern AfricaNorthern EuropeNorwayOceaniaPakistanPanamaPeruPhilippinesPolandPortugalRomaniaRussiaSaudi ArabiaScotlandSenegalSerbiaSierra LeoneSingaporeSomaliaSouth AfricaSouth AmericaSouth Central AsiaSouth Eastern AsiaSouthern EuropeSpainSri LankaSt. Vincent and the GrenadinesSudanSwedenSwitzerlandSyriaTaiwanThailandTrinidad and TobagoTurkeyUgandaUkraineUruguayUzbekistanVenezuelaVietnamWest IndiesWestern AfricaWestern AsiaWestern EuropeYemenZaireZimbabweAzores
Disability Age Under 5
Income
Poverty
Unemployment
Labor Participation
Family Structure
Vehicle Availability
Education Level
Disability

Bangladeshi Disability Age Under 5
Poor

1.3%
DISABILITY | AGE UNDER 5
15.5/ 100
METRIC RATING
216th/ 347
METRIC RANK

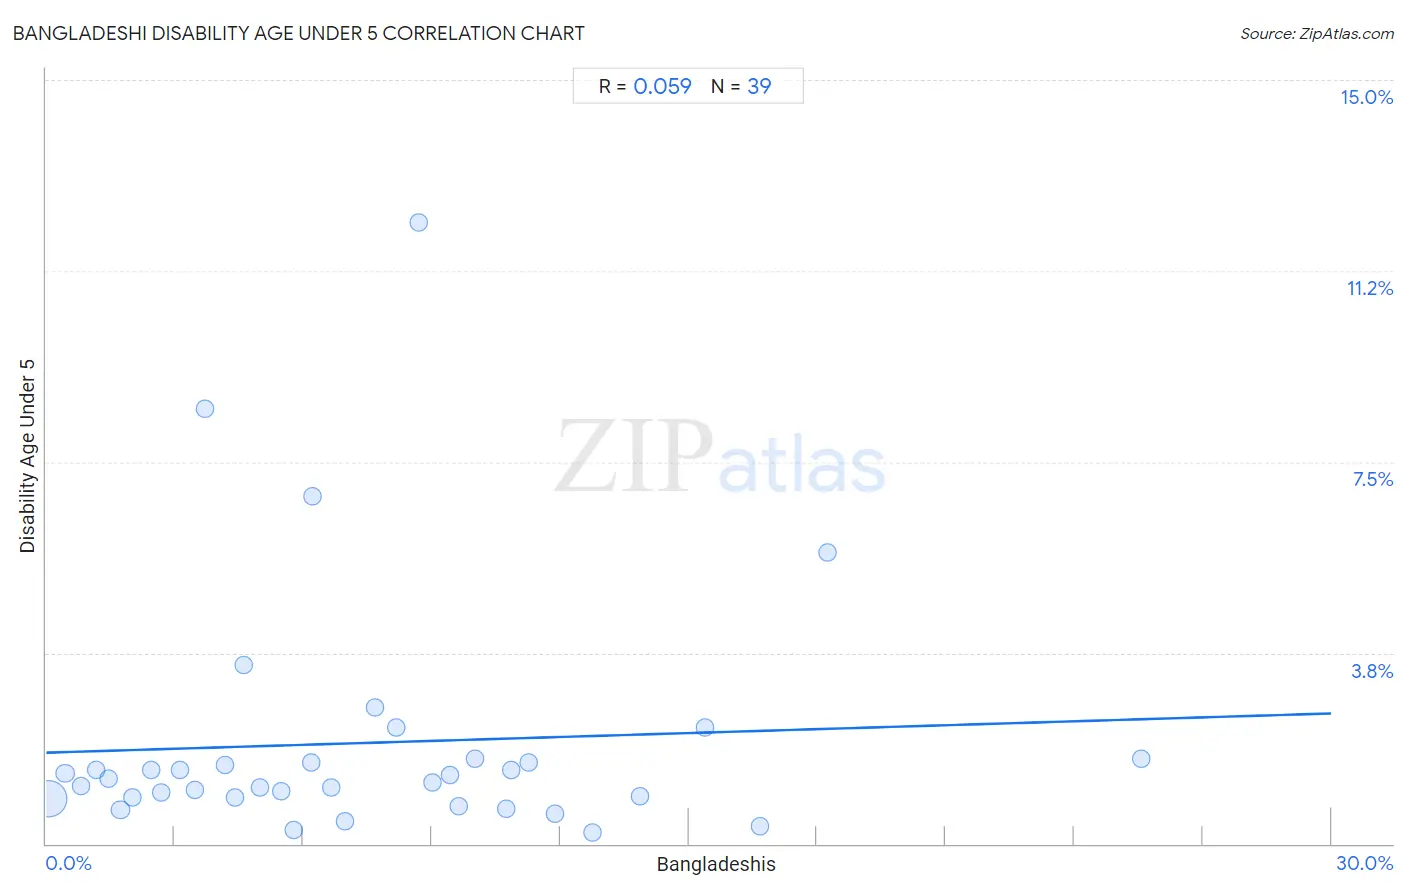
Bangladeshi Disability Age Under 5 Correlation Chart

The statistical analysis conducted on geographies consisting of 104,059,534 people shows a slight positive correlation between the proportion of Bangladeshis and percentage of population with a disability under the age of 5 in the United States with a correlation coefficient (R) of 0.059 and weighted average of 1.3%. On average, for every 1% (one percent) increase in Bangladeshis within a typical geography, there is an increase of 0.026% in percentage of population with a disability under the age of 5.
Bangladeshi Disability Age Under 5
It is essential to understand that the correlation between the percentage of Bangladeshis and percentage of population with a disability under the age of 5 does not imply a direct cause-and-effect relationship. It remains uncertain whether the presence of Bangladeshis influences an upward or downward trend in the level of percentage of population with a disability under the age of 5 within an area, or if Bangladeshis simply ended up residing in those areas with higher or lower levels of percentage of population with a disability under the age of 5 due to other factors.

Demographics Similar to Bangladeshis by Disability Age Under 5

In terms of disability age under 5, the demographic groups most similar to Bangladeshis are Syrian (1.3%, a difference of 0.10%), Cypriot (1.3%, a difference of 0.10%), Immigrants from Chile (1.3%, a difference of 0.27%), Malaysian (1.3%, a difference of 0.41%), and Immigrants from Sudan (1.3%, a difference of 0.50%).
DemographicsRating | RankDisability Age Under 5
Bulgarians
19.5
/100
|
#209
Poor
1.3%
Pakistanis
19.4
/100
|
#210
Poor
1.3%
Immigrants from Greece
19.1
/100
|
#211
Poor
1.3%
Chileans
18.8
/100
|
#212
Poor
1.3%
Immigrants from Sudan
18.7
/100
|
#213
Poor
1.3%
Immigrants from Chile
17.2
/100
|
#214
Poor
1.3%
Syrians
16.1
/100
|
#215
Poor
1.3%
Bangladeshis
15.5
/100
|
#216
Poor
1.3%
Cypriots
14.9
/100
|
#217
Poor
1.3%
Malaysians
13.2
/100
|
#218
Poor
1.3%
Immigrants from Croatia
11.2
/100
|
#219
Poor
1.3%
Serbians
9.6
/100
|
#220
Tragic
1.3%
Sub-Saharan Africans
8.3
/100
|
#221
Tragic
1.3%
Ukrainians
8.3
/100
|
#222
Tragic
1.3%
Hispanics or Latinos
7.7
/100
|
#223
Tragic
1.3%

Bangladeshi Disability Age Under 5 Correlation Summary

MeasurementBangladeshi DataDisability Age Under 5 Data
Minimum0.051%0.22%
Maximum25.6%12.2%
Range25.5%12.0%
Mean7.4%2.0%
Median6.2%1.3%
Interquartile 25% (IQ1)3.1%0.92%
Interquartile 75% (IQ3)10.7%1.7%
Interquartile Range (IQR)7.6%0.74%
Standard Deviation (Sample)5.5%2.4%
Standard Deviation (Population)5.5%2.4%

Correlation Details

Bangladeshi PercentileSample SizeDisability Age Under 5
[
0.0%
-
0.5%
]
0.051%
88,813,1970.88%
[
0.0%
-
0.5%
]
0.43%
4,114,2741.4%
[
0.5%
-
1.0%
]
0.81%
2,084,8381.1%
[
1.0%
-
1.5%
]
1.16%
840,0481.5%
[
1.0%
-
1.5%
]
1.46%
1,139,6031.3%
[
1.5%
-
2.0%
]
1.74%
1,598,3250.66%
[
2.0%
-
2.5%
]
2.02%
811,4170.92%
[
2.0%
-
2.5%
]
2.46%
382,3171.5%
[
2.5%
-
3.0%
]
2.68%
362,7731.0%
[
3.0%
-
3.5%
]
3.13%
324,9111.4%
[
3.0%
-
3.5%
]
3.47%
742,6831.1%
[
3.5%
-
4.0%
]
3.72%
146,0818.5%
[
4.0%
-
4.5%
]
4.18%
259,3261.5%
[
4.0%
-
4.5%
]
4.40%
194,7780.92%
[
4.5%
-
5.0%
]
4.61%
2,7543.5%
[
4.5%
-
5.0%
]
4.98%
642,9301.1%
[
5.0%
-
5.5%
]
5.48%
153,1031.0%
[
5.5%
-
6.0%
]
5.77%
84,5560.26%
[
6.0%
-
6.5%
]
6.18%
76,3161.6%
[
6.0%
-
6.5%
]
6.22%
6916.8%
[
6.5%
-
7.0%
]
6.64%
7,6951.1%
[
6.5%
-
7.0%
]
6.99%
50,4840.45%
[
7.5%
-
8.0%
]
7.69%
30,6252.7%
[
8.0%
-
8.5%
]
8.16%
32,6032.3%
[
8.5%
-
9.0%
]
8.71%
2,75712.2%
[
9.0%
-
9.5%
]
9.01%
117,0701.2%
[
9.0%
-
9.5%
]
9.41%
43,0421.4%
[
9.5%
-
10.0%
]
9.63%
105,6180.75%
[
10.0%
-
10.5%
]
10.01%
73,0671.7%
[
10.5%
-
11.0%
]
10.74%
49,9920.68%
[
10.5%
-
11.0%
]
10.85%
31,2921.4%
[
11.0%
-
11.5%
]
11.27%
308,8061.6%
[
11.5%
-
12.0%
]
11.89%
32,9120.59%
[
12.5%
-
13.0%
]
12.76%
84,9510.22%
[
13.5%
-
14.0%
]
13.87%
82,1760.94%
[
15.0%
-
15.5%
]
15.39%
132,0602.3%
[
16.5%
-
17.0%
]
16.66%
34,2200.33%
[
18.0%
-
18.5%
]
18.23%
7,5815.7%
[
25.5%
-
26.0%
]
25.55%
57,6621.7%