Immigrants from Mexico Disability Age Under 5
COMPARE
Immigrants from Mexico
Select to Compare
Disability Age Under 5
Immigrants from Mexico Disability Age Under 5
1.2%
DISABILITY | AGE UNDER 5
44.4/ 100
METRIC RATING
180th/ 347
METRIC RANK
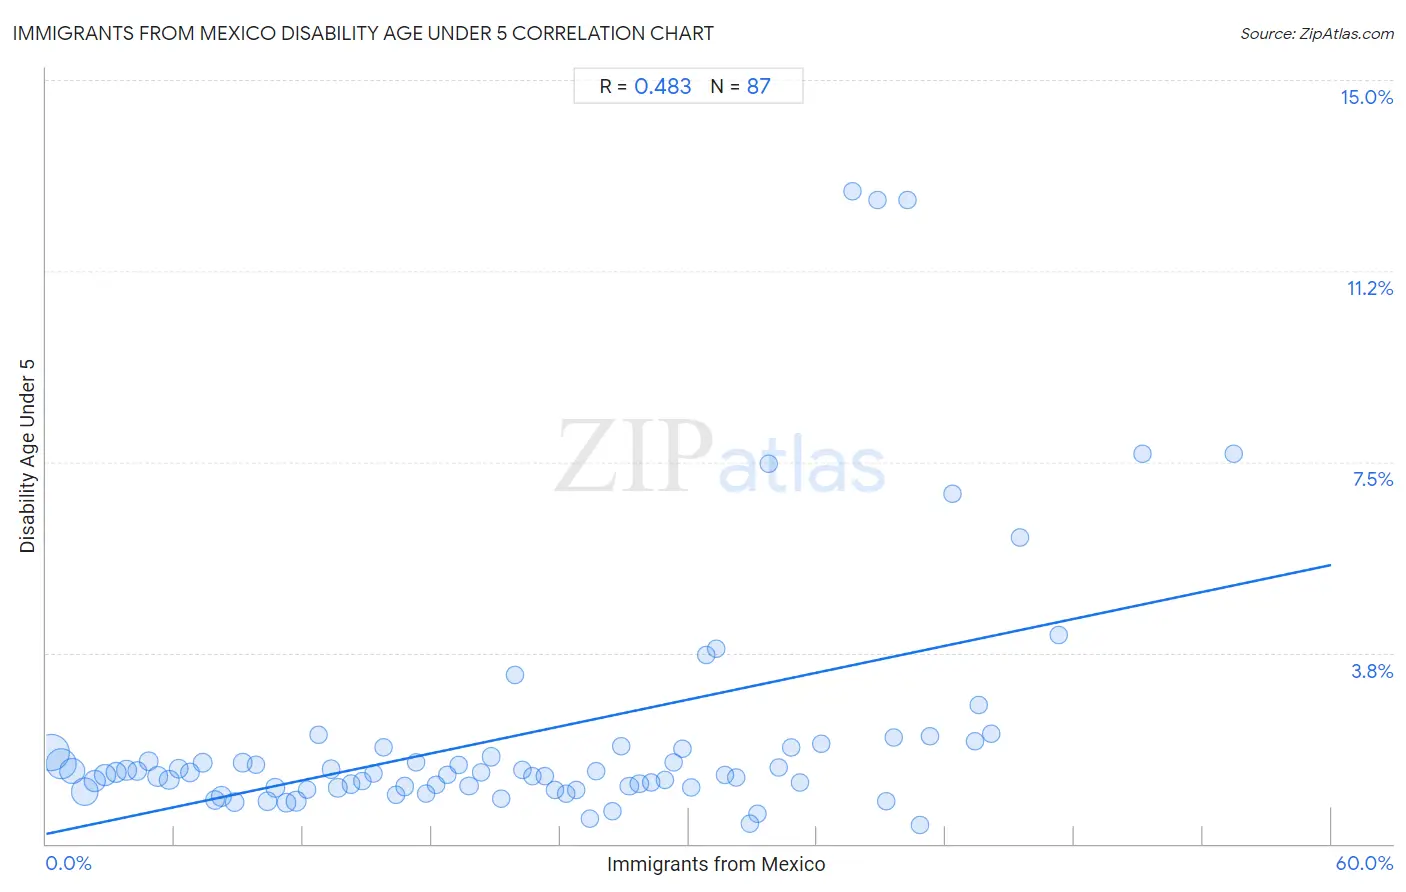
Immigrants from Mexico Disability Age Under 5 Correlation Chart
The statistical analysis conducted on geographies consisting of 251,023,549 people shows a moderate positive correlation between the proportion of Immigrants from Mexico and percentage of population with a disability under the age of 5 in the United States with a correlation coefficient (R) of 0.483 and weighted average of 1.2%. On average, for every 1% (one percent) increase in Immigrants from Mexico within a typical geography, there is an increase of 0.088% in percentage of population with a disability under the age of 5.
It is essential to understand that the correlation between the percentage of Immigrants from Mexico and percentage of population with a disability under the age of 5 does not imply a direct cause-and-effect relationship. It remains uncertain whether the presence of Immigrants from Mexico influences an upward or downward trend in the level of percentage of population with a disability under the age of 5 within an area, or if Immigrants from Mexico simply ended up residing in those areas with higher or lower levels of percentage of population with a disability under the age of 5 due to other factors.
Demographics Similar to Immigrants from Mexico by Disability Age Under 5
In terms of disability age under 5, the demographic groups most similar to Immigrants from Mexico are Immigrants from Bahamas (1.2%, a difference of 0.070%), Macedonian (1.2%, a difference of 0.070%), Immigrants from Peru (1.2%, a difference of 0.070%), Immigrants from Saudi Arabia (1.2%, a difference of 0.10%), and Palestinian (1.2%, a difference of 0.13%).
| Demographics | Rating | Rank | Disability Age Under 5 |
| Immigrants from Ireland | 50.3 /100 | #173 | Average 1.2% |
| Immigrants from Latvia | 50.0 /100 | #174 | Average 1.2% |
| Immigrants from Nigeria | 50.0 /100 | #175 | Average 1.2% |
| Immigrants from Kenya | 48.6 /100 | #176 | Average 1.2% |
| Comanche | 47.5 /100 | #177 | Average 1.2% |
| Venezuelans | 47.1 /100 | #178 | Average 1.2% |
| Immigrants from Bahamas | 45.2 /100 | #179 | Average 1.2% |
| Immigrants from Mexico | 44.4 /100 | #180 | Average 1.2% |
| Macedonians | 43.7 /100 | #181 | Average 1.2% |
| Immigrants from Peru | 43.7 /100 | #181 | Average 1.2% |
| Immigrants from Saudi Arabia | 43.3 /100 | #183 | Average 1.2% |
| Palestinians | 43.0 /100 | #184 | Average 1.2% |
| Immigrants from Western Africa | 42.5 /100 | #185 | Average 1.2% |
| Cubans | 42.5 /100 | #186 | Average 1.2% |
| Immigrants from Haiti | 40.2 /100 | #187 | Average 1.3% |
Immigrants from Mexico Disability Age Under 5 Correlation Summary
| Measurement | Immigrants from Mexico Data | Disability Age Under 5 Data |
| Minimum | 0.26% | 0.38% |
| Maximum | 55.4% | 12.8% |
| Range | 55.2% | 12.4% |
| Mean | 22.4% | 2.2% |
| Median | 21.9% | 1.4% |
| Interquartile 25% (IQ1) | 10.7% | 1.1% |
| Interquartile 75% (IQ3) | 32.8% | 1.9% |
| Interquartile Range (IQR) | 22.1% | 0.79% |
| Standard Deviation (Sample) | 13.7% | 2.5% |
| Standard Deviation (Population) | 13.6% | 2.5% |
Correlation Details
| Immigrants from Mexico Percentile | Sample Size | Disability Age Under 5 |
[ 0.0% - 0.5% ] 0.26% | 49,845,371 | 1.8% |
[ 0.5% - 1.0% ] 0.72% | 33,407,939 | 1.6% |
[ 1.0% - 1.5% ] 1.22% | 21,327,669 | 1.4% |
[ 1.5% - 2.0% ] 1.78% | 24,388,427 | 1.0% |
[ 2.0% - 2.5% ] 2.25% | 11,317,823 | 1.2% |
[ 2.5% - 3.0% ] 2.75% | 9,688,543 | 1.4% |
[ 3.0% - 3.5% ] 3.26% | 7,350,956 | 1.4% |
[ 3.5% - 4.0% ] 3.74% | 5,157,332 | 1.4% |
[ 4.0% - 4.5% ] 4.23% | 4,824,342 | 1.4% |
[ 4.5% - 5.0% ] 4.76% | 3,364,125 | 1.6% |
[ 5.0% - 5.5% ] 5.20% | 5,617,677 | 1.3% |
[ 5.5% - 6.0% ] 5.75% | 4,184,954 | 1.3% |
[ 6.0% - 6.5% ] 6.21% | 3,581,454 | 1.5% |
[ 6.5% - 7.0% ] 6.72% | 3,388,822 | 1.4% |
[ 7.0% - 7.5% ] 7.29% | 2,193,274 | 1.6% |
[ 7.5% - 8.0% ] 7.87% | 3,323,517 | 0.85% |
[ 8.0% - 8.5% ] 8.19% | 5,829,442 | 0.93% |
[ 8.5% - 9.0% ] 8.80% | 5,336,095 | 0.82% |
[ 9.0% - 9.5% ] 9.18% | 2,326,308 | 1.6% |
[ 9.5% - 10.0% ] 9.79% | 1,461,686 | 1.5% |
[ 10.0% - 10.5% ] 10.35% | 3,467,792 | 0.84% |
[ 10.5% - 11.0% ] 10.71% | 1,766,930 | 1.1% |
[ 11.0% - 11.5% ] 11.22% | 2,251,310 | 0.80% |
[ 11.5% - 12.0% ] 11.68% | 6,962,136 | 0.84% |
[ 12.0% - 12.5% ] 12.19% | 1,889,742 | 1.1% |
[ 12.5% - 13.0% ] 12.70% | 1,098,341 | 2.1% |
[ 13.0% - 13.5% ] 13.29% | 841,862 | 1.5% |
[ 13.5% - 14.0% ] 13.60% | 1,759,989 | 1.1% |
[ 14.0% - 14.5% ] 14.22% | 1,239,345 | 1.2% |
[ 14.5% - 15.0% ] 14.76% | 952,493 | 1.2% |
[ 15.0% - 15.5% ] 15.27% | 1,217,092 | 1.4% |
[ 15.5% - 16.0% ] 15.74% | 987,042 | 1.9% |
[ 16.0% - 16.5% ] 16.35% | 1,116,514 | 0.96% |
[ 16.5% - 17.0% ] 16.73% | 1,777,339 | 1.1% |
[ 17.0% - 17.5% ] 17.28% | 907,214 | 1.6% |
[ 17.5% - 18.0% ] 17.73% | 771,409 | 0.98% |
[ 18.0% - 18.5% ] 18.22% | 846,184 | 1.2% |
[ 18.5% - 19.0% ] 18.71% | 898,269 | 1.4% |
[ 19.0% - 19.5% ] 19.28% | 327,478 | 1.5% |
[ 19.5% - 20.0% ] 19.75% | 1,528,692 | 1.1% |
[ 20.0% - 20.5% ] 20.32% | 739,346 | 1.4% |
[ 20.5% - 21.0% ] 20.79% | 391,025 | 1.7% |
[ 21.0% - 21.5% ] 21.26% | 426,930 | 0.88% |
[ 21.5% - 22.0% ] 21.89% | 228,849 | 3.3% |
[ 22.0% - 22.5% ] 22.23% | 469,645 | 1.4% |
[ 22.5% - 23.0% ] 22.72% | 532,621 | 1.3% |
[ 23.0% - 23.5% ] 23.28% | 997,423 | 1.3% |
[ 23.5% - 24.0% ] 23.76% | 283,741 | 1.1% |
[ 24.0% - 24.5% ] 24.25% | 376,161 | 0.99% |
[ 24.5% - 25.0% ] 24.72% | 147,776 | 1.1% |
[ 25.0% - 25.5% ] 25.38% | 474,318 | 0.49% |
[ 25.5% - 26.0% ] 25.68% | 448,438 | 1.4% |
[ 26.0% - 26.5% ] 26.43% | 202,279 | 0.63% |
[ 26.5% - 27.0% ] 26.82% | 233,428 | 1.9% |
[ 27.0% - 27.5% ] 27.22% | 565,760 | 1.1% |
[ 27.5% - 28.0% ] 27.69% | 286,662 | 1.2% |
[ 28.0% - 28.5% ] 28.22% | 239,802 | 1.2% |
[ 28.5% - 29.0% ] 28.86% | 543,955 | 1.2% |
[ 29.0% - 29.5% ] 29.28% | 612,664 | 1.6% |
[ 29.5% - 30.0% ] 29.71% | 179,065 | 1.9% |
[ 30.0% - 30.5% ] 30.14% | 244,807 | 1.1% |
[ 30.5% - 31.0% ] 30.79% | 87,741 | 3.7% |
[ 31.0% - 31.5% ] 31.30% | 90,018 | 3.8% |
[ 31.5% - 32.0% ] 31.71% | 207,231 | 1.3% |
[ 32.0% - 32.5% ] 32.24% | 99,069 | 1.3% |
[ 32.5% - 33.0% ] 32.84% | 436,390 | 0.38% |
[ 33.0% - 33.5% ] 33.20% | 84,834 | 0.59% |
[ 33.5% - 34.0% ] 33.75% | 15,032 | 7.5% |
[ 34.0% - 34.5% ] 34.17% | 135,302 | 1.5% |
[ 34.5% - 35.0% ] 34.77% | 338,684 | 1.9% |
[ 35.0% - 35.5% ] 35.17% | 28,637 | 1.2% |
[ 36.0% - 36.5% ] 36.16% | 29,995 | 2.0% |
[ 37.5% - 38.0% ] 37.65% | 3,007 | 12.8% |
[ 38.5% - 39.0% ] 38.79% | 1,338 | 12.6% |
[ 39.0% - 39.5% ] 39.24% | 84,785 | 0.84% |
[ 39.5% - 40.0% ] 39.57% | 7,531 | 2.1% |
[ 40.0% - 40.5% ] 40.20% | 1,627 | 12.6% |
[ 40.5% - 41.0% ] 40.82% | 69,012 | 0.38% |
[ 41.0% - 41.5% ] 41.27% | 77,476 | 2.1% |
[ 42.0% - 42.5% ] 42.30% | 8,747 | 6.9% |
[ 43.0% - 43.5% ] 43.37% | 21,421 | 2.0% |
[ 43.5% - 44.0% ] 43.55% | 3,072 | 2.7% |
[ 44.0% - 44.5% ] 44.10% | 19,761 | 2.2% |
[ 45.0% - 45.5% ] 45.47% | 16,102 | 6.0% |
[ 47.0% - 47.5% ] 47.29% | 3,506 | 4.1% |
[ 51.0% - 51.5% ] 51.16% | 2,416 | 7.7% |
[ 55.0% - 55.5% ] 55.44% | 3,191 | 7.7% |