Basque Disability Age Under 5
COMPARE
Basque
Select to Compare
Disability Age Under 5
Basque Disability Age Under 5
1.3%
DISABILITY | AGE UNDER 5
3.0/ 100
METRIC RATING
237th/ 347
METRIC RANK
Basque Disability Age Under 5 Correlation Chart
The statistical analysis conducted on geographies consisting of 115,640,652 people shows a substantial positive correlation between the proportion of Basques and percentage of population with a disability under the age of 5 in the United States with a correlation coefficient (R) of 0.509 and weighted average of 1.3%. On average, for every 1% (one percent) increase in Basques within a typical geography, there is an increase of 3.3% in percentage of population with a disability under the age of 5.
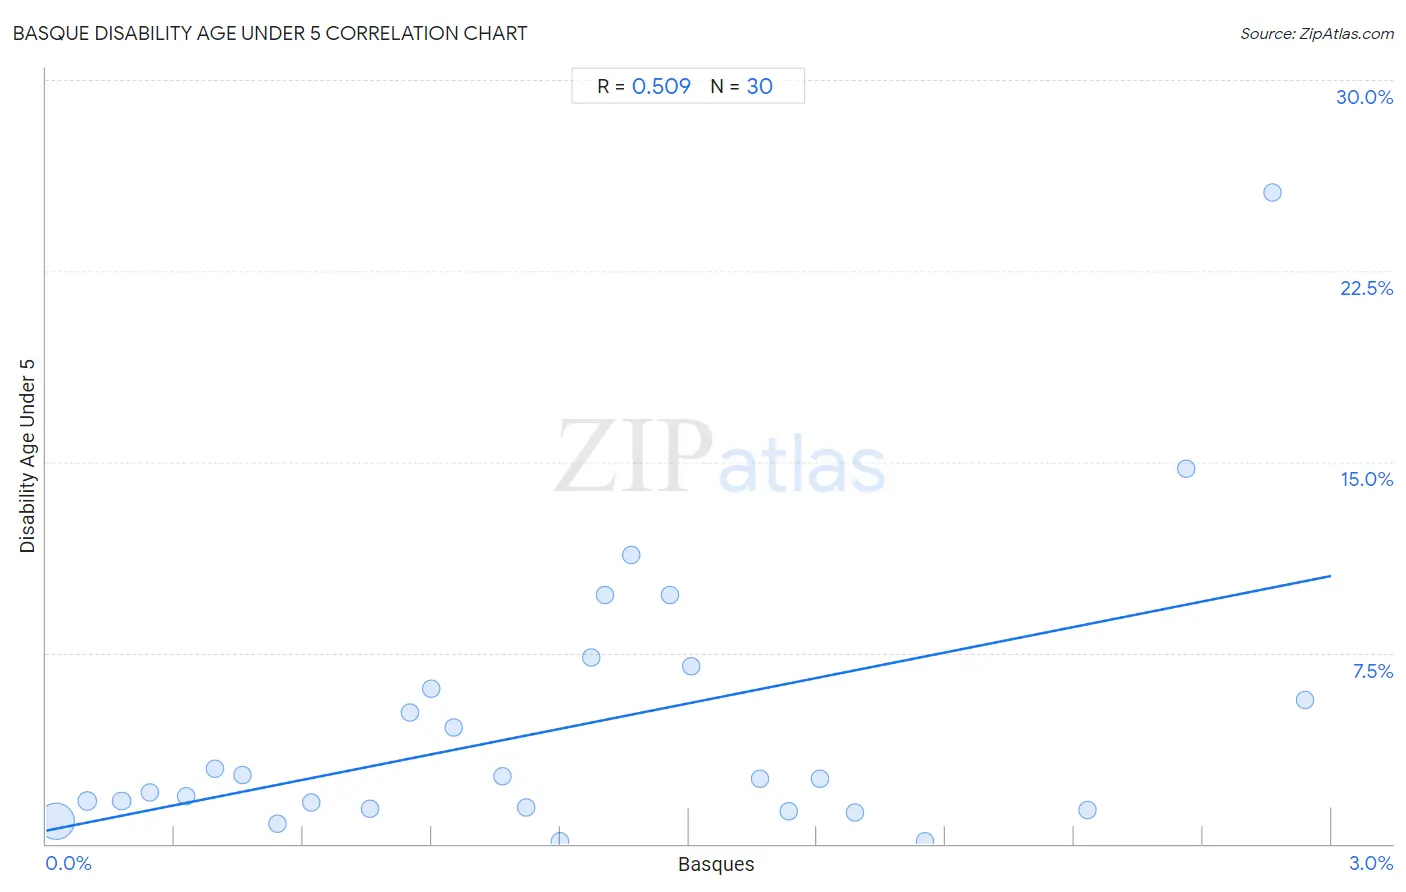
It is essential to understand that the correlation between the percentage of Basques and percentage of population with a disability under the age of 5 does not imply a direct cause-and-effect relationship. It remains uncertain whether the presence of Basques influences an upward or downward trend in the level of percentage of population with a disability under the age of 5 within an area, or if Basques simply ended up residing in those areas with higher or lower levels of percentage of population with a disability under the age of 5 due to other factors.
Demographics Similar to Basques by Disability Age Under 5
In terms of disability age under 5, the demographic groups most similar to Basques are South American Indian (1.3%, a difference of 0.24%), Spanish American Indian (1.3%, a difference of 0.43%), Central American Indian (1.3%, a difference of 0.44%), Pueblo (1.3%, a difference of 0.51%), and Immigrants from Austria (1.3%, a difference of 0.59%).
| Demographics | Rating | Rank | Disability Age Under 5 |
| Lebanese | 5.3 /100 | #230 | Tragic 1.3% |
| Immigrants from Northern Europe | 4.7 /100 | #231 | Tragic 1.3% |
| French American Indians | 4.5 /100 | #232 | Tragic 1.3% |
| Tongans | 4.2 /100 | #233 | Tragic 1.3% |
| Pueblo | 3.8 /100 | #234 | Tragic 1.3% |
| Central American Indians | 3.6 /100 | #235 | Tragic 1.3% |
| South American Indians | 3.3 /100 | #236 | Tragic 1.3% |
| Basques | 3.0 /100 | #237 | Tragic 1.3% |
| Spanish American Indians | 2.4 /100 | #238 | Tragic 1.3% |
| Immigrants from Austria | 2.3 /100 | #239 | Tragic 1.3% |
| Native Hawaiians | 2.2 /100 | #240 | Tragic 1.3% |
| Maltese | 2.2 /100 | #241 | Tragic 1.3% |
| Lumbee | 2.1 /100 | #242 | Tragic 1.3% |
| Immigrants from Cameroon | 1.7 /100 | #243 | Tragic 1.4% |
| Spaniards | 1.4 /100 | #244 | Tragic 1.4% |
Basque Disability Age Under 5 Correlation Summary
| Measurement | Basque Data | Disability Age Under 5 Data |
| Minimum | 0.022% | 0.11% |
| Maximum | 2.9% | 25.6% |
| Range | 2.9% | 25.5% |
| Mean | 1.2% | 4.6% |
| Median | 1.2% | 2.5% |
| Interquartile 25% (IQ1) | 0.54% | 1.4% |
| Interquartile 75% (IQ3) | 1.7% | 6.1% |
| Interquartile Range (IQR) | 1.2% | 4.7% |
| Standard Deviation (Sample) | 0.82% | 5.4% |
| Standard Deviation (Population) | 0.81% | 5.3% |
Correlation Details
| Basque Percentile | Sample Size | Disability Age Under 5 |
[ 0.0% - 0.5% ] 0.022% | 100,642,948 | 0.87% |
[ 0.0% - 0.5% ] 0.096% | 9,065,195 | 1.7% |
[ 0.0% - 0.5% ] 0.18% | 2,682,509 | 1.7% |
[ 0.0% - 0.5% ] 0.24% | 1,333,135 | 2.0% |
[ 0.0% - 0.5% ] 0.33% | 825,419 | 1.9% |
[ 0.0% - 0.5% ] 0.39% | 269,963 | 2.9% |
[ 0.0% - 0.5% ] 0.46% | 64,936 | 2.7% |
[ 0.5% - 1.0% ] 0.54% | 217,320 | 0.80% |
[ 0.5% - 1.0% ] 0.62% | 70,924 | 1.6% |
[ 0.5% - 1.0% ] 0.76% | 36,783 | 1.4% |
[ 0.5% - 1.0% ] 0.85% | 9,435 | 5.1% |
[ 0.5% - 1.0% ] 0.90% | 26,660 | 6.1% |
[ 0.5% - 1.0% ] 0.95% | 19,257 | 4.6% |
[ 1.0% - 1.5% ] 1.07% | 44,163 | 2.6% |
[ 1.0% - 1.5% ] 1.12% | 6,697 | 1.4% |
[ 1.0% - 1.5% ] 1.20% | 234,192 | 0.12% |
[ 1.0% - 1.5% ] 1.27% | 2,751 | 7.3% |
[ 1.0% - 1.5% ] 1.30% | 920 | 9.8% |
[ 1.0% - 1.5% ] 1.37% | 879 | 11.4% |
[ 1.0% - 1.5% ] 1.46% | 824 | 9.8% |
[ 1.5% - 2.0% ] 1.51% | 730 | 7.0% |
[ 1.5% - 2.0% ] 1.67% | 15,062 | 2.5% |
[ 1.5% - 2.0% ] 1.73% | 4,674 | 1.3% |
[ 1.5% - 2.0% ] 1.81% | 15,771 | 2.5% |
[ 1.5% - 2.0% ] 1.89% | 10,545 | 1.2% |
[ 2.0% - 2.5% ] 2.05% | 26,023 | 0.11% |
[ 2.0% - 2.5% ] 2.43% | 8,182 | 1.3% |
[ 2.5% - 3.0% ] 2.66% | 451 | 14.7% |
[ 2.5% - 3.0% ] 2.86% | 594 | 25.6% |
[ 2.5% - 3.0% ] 2.94% | 3,710 | 5.7% |