Immigrants from Uruguay Disability Age Under 5

COMPARE

Immigrants from Uruguay
Race
Ancestry
AfghanAfricanAlaska NativeAlaskan AthabascanAlbanianAleutAlsatianAmericanApacheArabArapahoArgentineanArmenianAssyrian/Chaldean/SyriacAustralianAustrianBahamianBangladeshiBarbadianBasqueBelgianBelizeanBermudanBhutaneseBlackfeetBolivianBrazilianBritishBritish West IndianBulgarianBurmeseCajunCambodianCanadianCape VerdeanCarpatho RusynCelticCentral AmericanCentral American IndianCherokeeCheyenneChickasawChileanChineseChippewaChoctawColombianColvilleComancheCosta RicanCreeCreekCroatianCrowCubanCypriotCzechCzechoslovakianDanishDelawareDominicanDutchDutch West IndianEastern EuropeanEcuadorianEgyptianEnglishEstonianEthiopianEuropeanFijianFilipinoFinnishFrenchFrench American IndianFrench CanadianGermanGerman RussianGhanaianGreekGuamanian/ChamorroGuatemalanGuyaneseHaitianHmongHonduranHopiHoumaHungarianIcelanderIndian (Asian)IndonesianInupiatIranianIraqiIrishIroquoisIsraeliItalianJamaicanJapaneseJordanianKenyanKiowaKoreanLaotianLatvianLebaneseLiberianLithuanianLumbeeLuxembourgerMacedonianMalaysianMalteseMarshalleseMenomineeMexicanMexican American IndianMongolianMoroccanNative HawaiianNavajoNepaleseNew ZealanderNicaraguanNigerianNorthern EuropeanNorwegianOkinawanOsageOttawaPaiutePakistaniPalestinianPanamanianParaguayanPennsylvania GermanPeruvianPimaPolishPortuguesePotawatomiPuebloPuerto RicanPuget Sound SalishRomanianRussianSalvadoranSamoanScandinavianScotch-IrishScottishSeminoleSenegaleseSerbianShoshoneSierra LeoneanSiouxSlavicSlovakSloveneSomaliSouth AfricanSouth AmericanSouth American IndianSoviet UnionSpaniardSpanishSpanish AmericanSpanish American IndianSri LankanSubsaharan AfricanSudaneseSwedishSwissSyrianTaiwaneseThaiTlingit-HaidaTohono O'OdhamTonganTrinidadian and TobagonianTsimshianTurkishU.S. Virgin IslanderUgandanUkrainianUruguayanUteVenezuelanVietnameseWelshWest IndianYakamaYaquiYugoslavianYumanYup'ikZimbabwean
Immigration
NonimmigrantsImmigrantsAfghanistanAfricaAlbaniaArgentinaArmeniaAsiaAustraliaAustriaBahamasBangladeshBarbadosBelarusBelgiumBelizeBoliviaBosnia and HerzegovinaBrazilBulgariaBurma/MyanmarCabo VerdeCambodiaCameroonCanadaCaribbeanCentral AmericaChileChinaColombiaCongoCosta RicaCroatiaCubaCzechoslovakiaDenmarkDominicaDominican RepublicEastern AfricaEastern AsiaEastern EuropeEcuadorEgyptEl SalvadorEnglandEritreaEthiopiaEuropeFijiFranceGermanyGhanaGreeceGrenadaGuatemalaGuyanaHaitiHondurasHong KongHungaryIndiaIndonesiaIranIraqIrelandIsraelItalyJamaicaJapanJordanKazakhstanKenyaKoreaKuwaitLaosLatin AmericaLatviaLebanonLiberiaLithuaniaMalaysiaMexicoMicronesiaMiddle AfricaMoldovaMoroccoNepalNetherlandsNicaraguaNigeriaNorth AmericaNorth MacedoniaNorthern AfricaNorthern EuropeNorwayOceaniaPakistanPanamaPeruPhilippinesPolandPortugalRomaniaRussiaSaudi ArabiaScotlandSenegalSerbiaSierra LeoneSingaporeSomaliaSouth AfricaSouth AmericaSouth Central AsiaSouth Eastern AsiaSouthern EuropeSpainSri LankaSt. Vincent and the GrenadinesSudanSwedenSwitzerlandSyriaTaiwanThailandTrinidad and TobagoTurkeyUgandaUkraineUruguayUzbekistanVenezuelaVietnamWest IndiesWestern AfricaWestern AsiaWestern EuropeYemenZaireZimbabweAzores
Select to Compare
Race
Ancestry
AfghanAfricanAlaska NativeAlaskan AthabascanAlbanianAleutAlsatianAmericanApacheArabArapahoArgentineanArmenianAssyrian/Chaldean/SyriacAustralianAustrianBahamianBangladeshiBarbadianBasqueBelgianBelizeanBermudanBhutaneseBlackfeetBolivianBrazilianBritishBritish West IndianBulgarianBurmeseCajunCambodianCanadianCape VerdeanCarpatho RusynCelticCentral AmericanCentral American IndianCherokeeCheyenneChickasawChileanChineseChippewaChoctawColombianColvilleComancheCosta RicanCreeCreekCroatianCrowCubanCypriotCzechCzechoslovakianDanishDelawareDominicanDutchDutch West IndianEastern EuropeanEcuadorianEgyptianEnglishEstonianEthiopianEuropeanFijianFilipinoFinnishFrenchFrench American IndianFrench CanadianGermanGerman RussianGhanaianGreekGuamanian/ChamorroGuatemalanGuyaneseHaitianHmongHonduranHopiHoumaHungarianIcelanderIndian (Asian)IndonesianInupiatIranianIraqiIrishIroquoisIsraeliItalianJamaicanJapaneseJordanianKenyanKiowaKoreanLaotianLatvianLebaneseLiberianLithuanianLumbeeLuxembourgerMacedonianMalaysianMalteseMarshalleseMenomineeMexicanMexican American IndianMongolianMoroccanNative HawaiianNavajoNepaleseNew ZealanderNicaraguanNigerianNorthern EuropeanNorwegianOkinawanOsageOttawaPaiutePakistaniPalestinianPanamanianParaguayanPennsylvania GermanPeruvianPimaPolishPortuguesePotawatomiPuebloPuerto RicanPuget Sound SalishRomanianRussianSalvadoranSamoanScandinavianScotch-IrishScottishSeminoleSenegaleseSerbianShoshoneSierra LeoneanSiouxSlavicSlovakSloveneSomaliSouth AfricanSouth AmericanSouth American IndianSoviet UnionSpaniardSpanishSpanish AmericanSpanish American IndianSri LankanSubsaharan AfricanSudaneseSwedishSwissSyrianTaiwaneseThaiTlingit-HaidaTohono O'OdhamTonganTrinidadian and TobagonianTsimshianTurkishU.S. Virgin IslanderUgandanUkrainianUruguayanUteVenezuelanVietnameseWelshWest IndianYakamaYaquiYugoslavianYumanYup'ikZimbabwean
Immigration
NonimmigrantsImmigrantsAfghanistanAfricaAlbaniaArgentinaArmeniaAsiaAustraliaAustriaBahamasBangladeshBarbadosBelarusBelgiumBelizeBoliviaBosnia and HerzegovinaBrazilBulgariaBurma/MyanmarCabo VerdeCambodiaCameroonCanadaCaribbeanCentral AmericaChileChinaColombiaCongoCosta RicaCroatiaCubaCzechoslovakiaDenmarkDominicaDominican RepublicEastern AfricaEastern AsiaEastern EuropeEcuadorEgyptEl SalvadorEnglandEritreaEthiopiaEuropeFijiFranceGermanyGhanaGreeceGrenadaGuatemalaGuyanaHaitiHondurasHong KongHungaryIndiaIndonesiaIranIraqIrelandIsraelItalyJamaicaJapanJordanKazakhstanKenyaKoreaKuwaitLaosLatin AmericaLatviaLebanonLiberiaLithuaniaMalaysiaMexicoMicronesiaMiddle AfricaMoldovaMoroccoNepalNetherlandsNicaraguaNigeriaNorth AmericaNorth MacedoniaNorthern AfricaNorthern EuropeNorwayOceaniaPakistanPanamaPeruPhilippinesPolandPortugalRomaniaRussiaSaudi ArabiaScotlandSenegalSerbiaSierra LeoneSingaporeSomaliaSouth AfricaSouth AmericaSouth Central AsiaSouth Eastern AsiaSouthern EuropeSpainSri LankaSt. Vincent and the GrenadinesSudanSwedenSwitzerlandSyriaTaiwanThailandTrinidad and TobagoTurkeyUgandaUkraineUzbekistanVenezuelaVietnamWest IndiesWestern AfricaWestern AsiaWestern EuropeYemenZaireZimbabweAzores
Disability Age Under 5
Income
Poverty
Unemployment
Labor Participation
Family Structure
Vehicle Availability
Education Level
Disability

Immigrants from Uruguay Disability Age Under 5
Average

1.2%
DISABILITY | AGE UNDER 5
59.0/ 100
METRIC RATING
169th/ 347
METRIC RANK

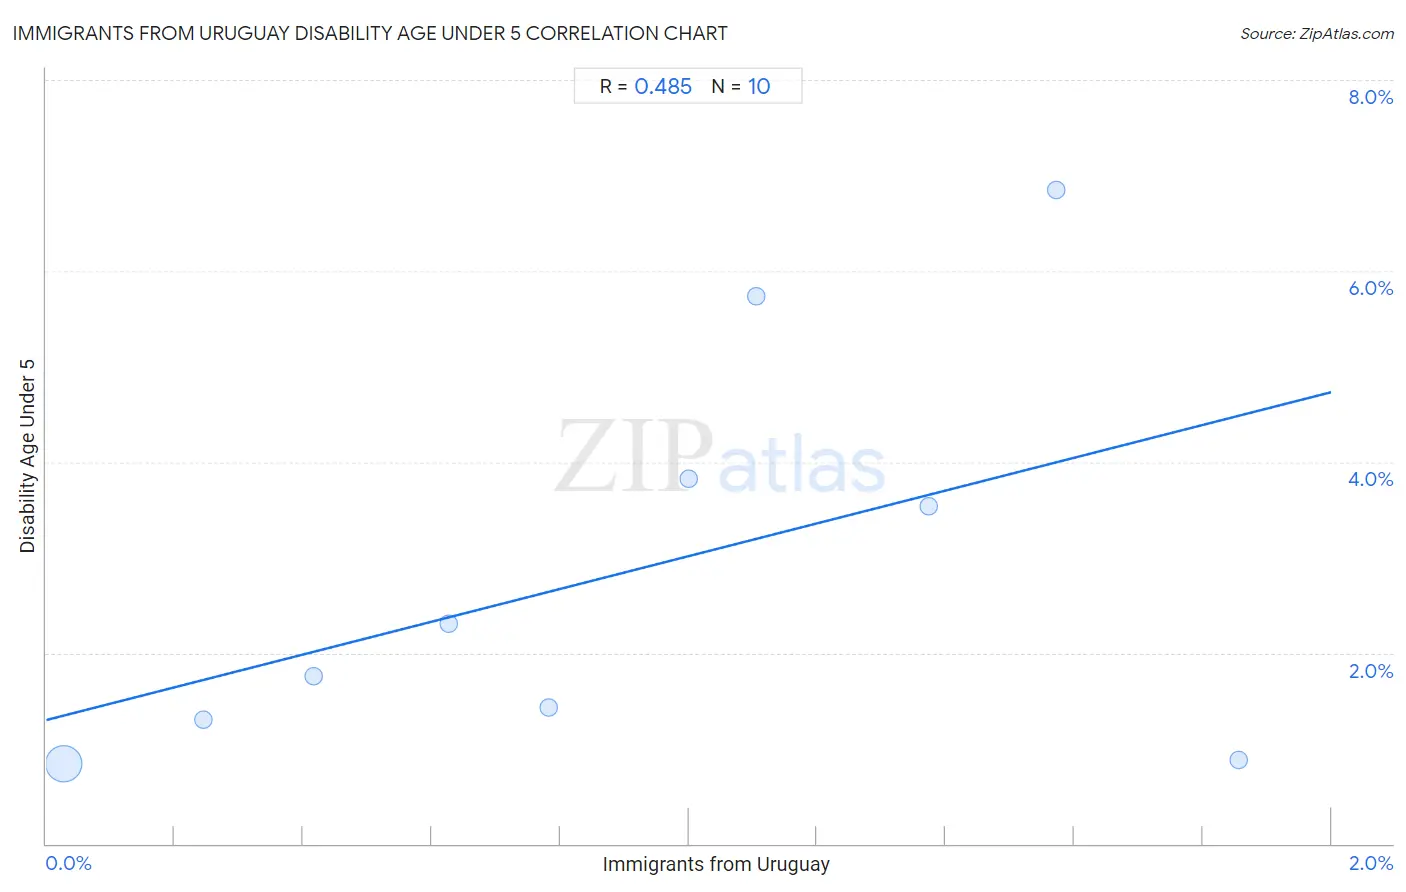
Immigrants from Uruguay Disability Age Under 5 Correlation Chart

The statistical analysis conducted on geographies consisting of 93,497,265 people shows a moderate positive correlation between the proportion of Immigrants from Uruguay and percentage of population with a disability under the age of 5 in the United States with a correlation coefficient (R) of 0.485 and weighted average of 1.2%. On average, for every 1% (one percent) increase in Immigrants from Uruguay within a typical geography, there is an increase of 1.7% in percentage of population with a disability under the age of 5.
Immigrants from Uruguay Disability Age Under 5
It is essential to understand that the correlation between the percentage of Immigrants from Uruguay and percentage of population with a disability under the age of 5 does not imply a direct cause-and-effect relationship. It remains uncertain whether the presence of Immigrants from Uruguay influences an upward or downward trend in the level of percentage of population with a disability under the age of 5 within an area, or if Immigrants from Uruguay simply ended up residing in those areas with higher or lower levels of percentage of population with a disability under the age of 5 due to other factors.

Demographics Similar to Immigrants from Uruguay by Disability Age Under 5

In terms of disability age under 5, the demographic groups most similar to Immigrants from Uruguay are Sierra Leonean (1.2%, a difference of 0.010%), Immigrants from Jamaica (1.2%, a difference of 0.020%), Guamanian/Chamorro (1.2%, a difference of 0.11%), Immigrants from Argentina (1.2%, a difference of 0.12%), and Immigrants from Central America (1.2%, a difference of 0.23%).
DemographicsRating | RankDisability Age Under 5
Guatemalans
63.6
/100
|
#162
Good
1.2%
Immigrants from Guatemala
63.2
/100
|
#163
Good
1.2%
Laotians
62.8
/100
|
#164
Good
1.2%
Immigrants from Kuwait
62.6
/100
|
#165
Good
1.2%
Immigrants from Central America
61.4
/100
|
#166
Good
1.2%
Immigrants from Argentina
60.2
/100
|
#167
Good
1.2%
Sierra Leoneans
59.1
/100
|
#168
Average
1.2%
Immigrants from Uruguay
59.0
/100
|
#169
Average
1.2%
Immigrants from Jamaica
58.8
/100
|
#170
Average
1.2%
Guamanians/Chamorros
57.8
/100
|
#171
Average
1.2%
Crow
51.0
/100
|
#172
Average
1.2%
Immigrants from Ireland
50.3
/100
|
#173
Average
1.2%
Immigrants from Latvia
50.0
/100
|
#174
Average
1.2%
Immigrants from Nigeria
50.0
/100
|
#175
Average
1.2%
Immigrants from Kenya
48.6
/100
|
#176
Average
1.2%

Immigrants from Uruguay Disability Age Under 5 Correlation Summary

MeasurementImmigrants from Uruguay DataDisability Age Under 5 Data
Minimum0.026%0.84%
Maximum1.9%6.8%
Range1.8%6.0%
Mean0.90%2.8%
Median0.89%2.0%
Interquartile 25% (IQ1)0.42%1.3%
Interquartile 75% (IQ3)1.4%3.8%
Interquartile Range (IQR)0.96%2.5%
Standard Deviation (Sample)0.59%2.1%
Standard Deviation (Population)0.56%2.0%

Correlation Details

Immigrants from Uruguay PercentileSample SizeDisability Age Under 5
[
0.0%
-
0.5%
]
0.026%
89,120,5140.84%
[
0.0%
-
0.5%
]
0.24%
3,241,4441.3%
[
0.0%
-
0.5%
]
0.42%
611,1641.8%
[
0.5%
-
1.0%
]
0.63%
218,9332.3%
[
0.5%
-
1.0%
]
0.78%
49,4381.4%
[
0.5%
-
1.0%
]
1.00%
105,5963.8%
[
1.0%
-
1.5%
]
1.11%
55,0745.7%
[
1.0%
-
1.5%
]
1.37%
6,4103.5%
[
1.5%
-
2.0%
]
1.57%
5,4106.8%
[
1.5%
-
2.0%
]
1.86%
83,2820.87%