Immigrants from Uganda Disability Age Under 5
COMPARE
Immigrants from Uganda
Select to Compare
Disability Age Under 5
Immigrants from Uganda Disability Age Under 5
1.1%
DISABILITY | AGE UNDER 5
96.1/ 100
METRIC RATING
101st/ 347
METRIC RANK
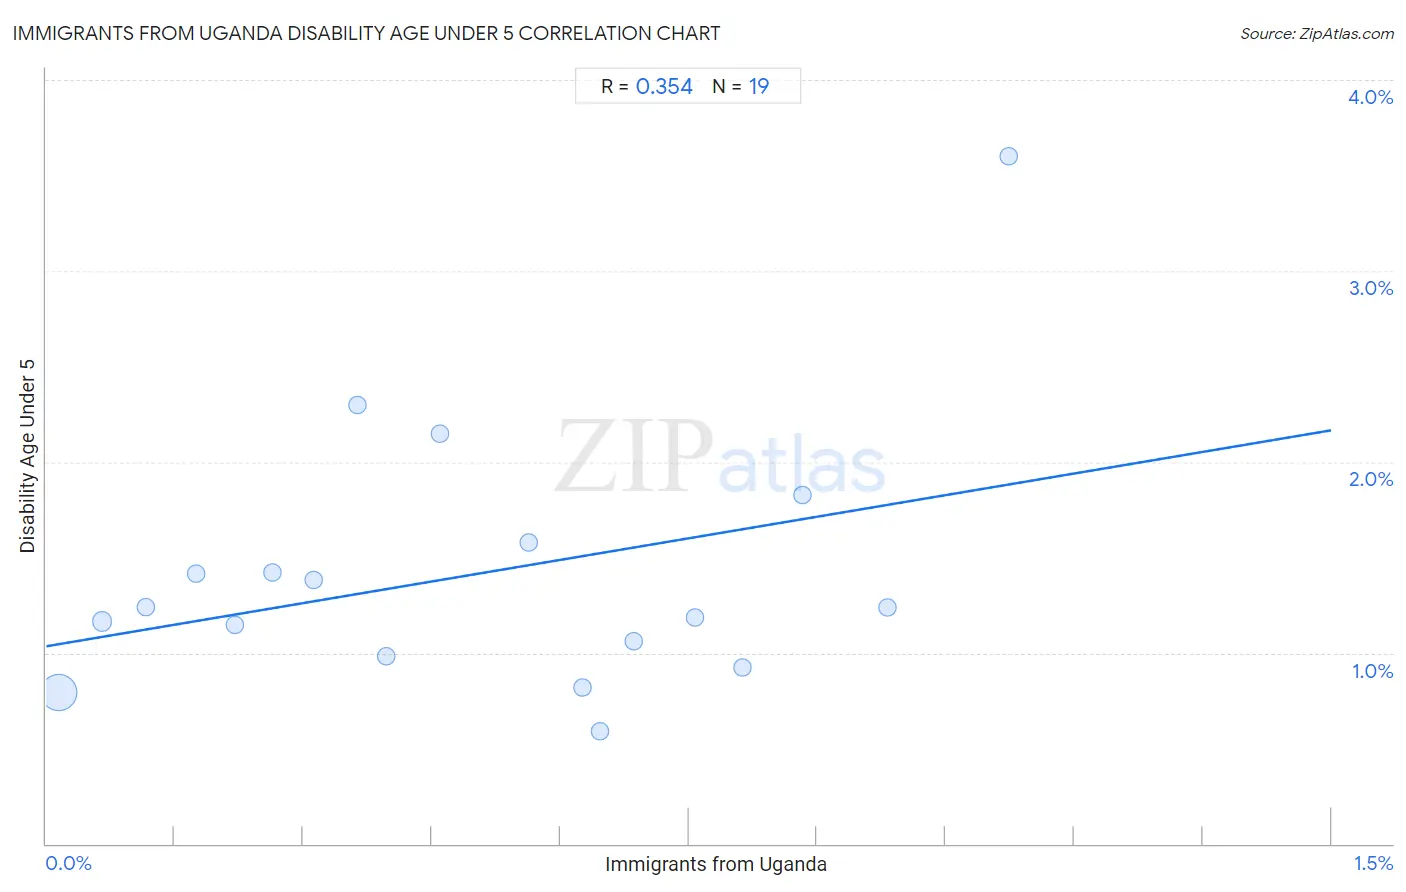
Immigrants from Uganda Disability Age Under 5 Correlation Chart
The statistical analysis conducted on geographies consisting of 93,852,660 people shows a mild positive correlation between the proportion of Immigrants from Uganda and percentage of population with a disability under the age of 5 in the United States with a correlation coefficient (R) of 0.354 and weighted average of 1.1%. On average, for every 1% (one percent) increase in Immigrants from Uganda within a typical geography, there is an increase of 0.75% in percentage of population with a disability under the age of 5.
It is essential to understand that the correlation between the percentage of Immigrants from Uganda and percentage of population with a disability under the age of 5 does not imply a direct cause-and-effect relationship. It remains uncertain whether the presence of Immigrants from Uganda influences an upward or downward trend in the level of percentage of population with a disability under the age of 5 within an area, or if Immigrants from Uganda simply ended up residing in those areas with higher or lower levels of percentage of population with a disability under the age of 5 due to other factors.
Demographics Similar to Immigrants from Uganda by Disability Age Under 5
In terms of disability age under 5, the demographic groups most similar to Immigrants from Uganda are Immigrants from Morocco (1.2%, a difference of 0.060%), Immigrants from Nicaragua (1.2%, a difference of 0.060%), Nicaraguan (1.1%, a difference of 0.11%), Indonesian (1.2%, a difference of 0.12%), and Dominican (1.1%, a difference of 0.14%).
| Demographics | Rating | Rank | Disability Age Under 5 |
| Sri Lankans | 96.8 /100 | #94 | Exceptional 1.1% |
| Immigrants from Moldova | 96.8 /100 | #95 | Exceptional 1.1% |
| Mongolians | 96.6 /100 | #96 | Exceptional 1.1% |
| Immigrants from Iraq | 96.5 /100 | #97 | Exceptional 1.1% |
| Immigrants from South Eastern Asia | 96.5 /100 | #98 | Exceptional 1.1% |
| Dominicans | 96.3 /100 | #99 | Exceptional 1.1% |
| Nicaraguans | 96.3 /100 | #100 | Exceptional 1.1% |
| Immigrants from Uganda | 96.1 /100 | #101 | Exceptional 1.1% |
| Immigrants from Morocco | 96.0 /100 | #102 | Exceptional 1.2% |
| Immigrants from Nicaragua | 96.0 /100 | #103 | Exceptional 1.2% |
| Indonesians | 95.9 /100 | #104 | Exceptional 1.2% |
| Immigrants from South Africa | 95.6 /100 | #105 | Exceptional 1.2% |
| Cambodians | 95.4 /100 | #106 | Exceptional 1.2% |
| Immigrants from West Indies | 95.3 /100 | #107 | Exceptional 1.2% |
| Iraqis | 95.1 /100 | #108 | Exceptional 1.2% |
Immigrants from Uganda Disability Age Under 5 Correlation Summary
| Measurement | Immigrants from Uganda Data | Disability Age Under 5 Data |
| Minimum | 0.015% | 0.59% |
| Maximum | 1.1% | 3.6% |
| Range | 1.1% | 3.0% |
| Mean | 0.50% | 1.4% |
| Median | 0.46% | 1.2% |
| Interquartile 25% (IQ1) | 0.22% | 0.98% |
| Interquartile 75% (IQ3) | 0.76% | 1.6% |
| Interquartile Range (IQR) | 0.54% | 0.59% |
| Standard Deviation (Sample) | 0.32% | 0.69% |
| Standard Deviation (Population) | 0.31% | 0.67% |
Correlation Details
| Immigrants from Uganda Percentile | Sample Size | Disability Age Under 5 |
[ 0.0% - 0.5% ] 0.015% | 78,714,238 | 0.79% |
[ 0.0% - 0.5% ] 0.065% | 8,651,877 | 1.2% |
[ 0.0% - 0.5% ] 0.12% | 3,042,610 | 1.2% |
[ 0.0% - 0.5% ] 0.18% | 994,037 | 1.4% |
[ 0.0% - 0.5% ] 0.22% | 936,107 | 1.1% |
[ 0.0% - 0.5% ] 0.26% | 339,751 | 1.4% |
[ 0.0% - 0.5% ] 0.31% | 341,870 | 1.4% |
[ 0.0% - 0.5% ] 0.36% | 127,624 | 2.3% |
[ 0.0% - 0.5% ] 0.40% | 37,043 | 0.98% |
[ 0.0% - 0.5% ] 0.46% | 292,444 | 2.1% |
[ 0.5% - 1.0% ] 0.56% | 114,737 | 1.6% |
[ 0.5% - 1.0% ] 0.63% | 39,154 | 0.82% |
[ 0.5% - 1.0% ] 0.65% | 48,241 | 0.59% |
[ 0.5% - 1.0% ] 0.69% | 27,111 | 1.1% |
[ 0.5% - 1.0% ] 0.76% | 36,546 | 1.2% |
[ 0.5% - 1.0% ] 0.81% | 52,173 | 0.93% |
[ 0.5% - 1.0% ] 0.88% | 22,196 | 1.8% |
[ 0.5% - 1.0% ] 0.98% | 2,140 | 1.2% |
[ 1.0% - 1.5% ] 1.12% | 32,761 | 3.6% |