Immigrants from Iraq Disability Age Under 5
COMPARE
Immigrants from Iraq
Select to Compare
Disability Age Under 5
Immigrants from Iraq Disability Age Under 5
1.1%
DISABILITY | AGE UNDER 5
96.5/ 100
METRIC RATING
97th/ 347
METRIC RANK
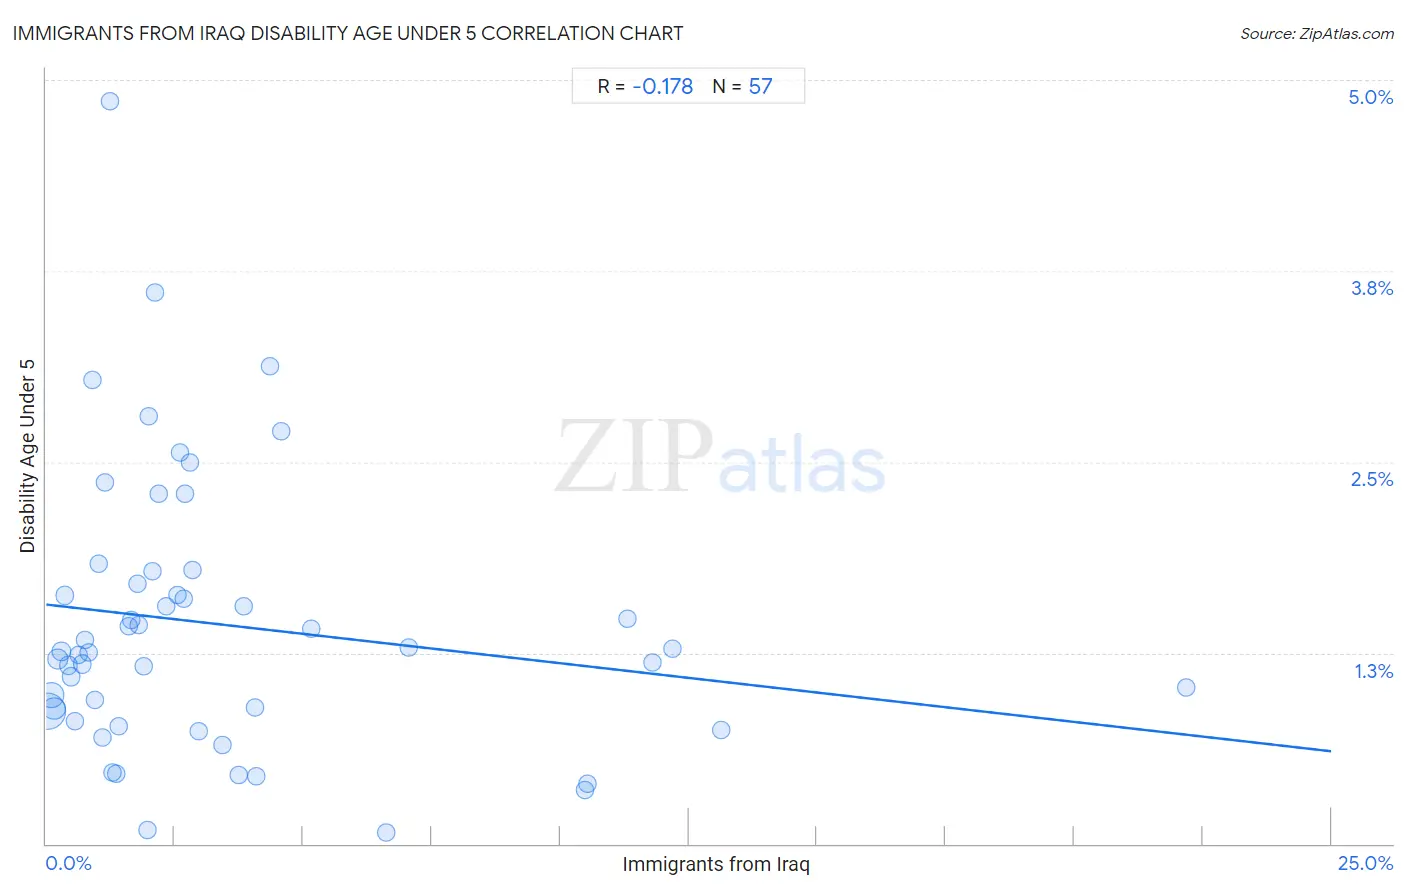
Immigrants from Iraq Disability Age Under 5 Correlation Chart
The statistical analysis conducted on geographies consisting of 131,193,910 people shows a poor negative correlation between the proportion of Immigrants from Iraq and percentage of population with a disability under the age of 5 in the United States with a correlation coefficient (R) of -0.178 and weighted average of 1.1%. On average, for every 1% (one percent) increase in Immigrants from Iraq within a typical geography, there is a decrease of 0.038% in percentage of population with a disability under the age of 5.
It is essential to understand that the correlation between the percentage of Immigrants from Iraq and percentage of population with a disability under the age of 5 does not imply a direct cause-and-effect relationship. It remains uncertain whether the presence of Immigrants from Iraq influences an upward or downward trend in the level of percentage of population with a disability under the age of 5 within an area, or if Immigrants from Iraq simply ended up residing in those areas with higher or lower levels of percentage of population with a disability under the age of 5 due to other factors.
Demographics Similar to Immigrants from Iraq by Disability Age Under 5
In terms of disability age under 5, the demographic groups most similar to Immigrants from Iraq are Immigrants from South Eastern Asia (1.1%, a difference of 0.010%), Mongolian (1.1%, a difference of 0.10%), Dominican (1.1%, a difference of 0.14%), Nicaraguan (1.1%, a difference of 0.17%), and Immigrants from Moldova (1.1%, a difference of 0.20%).
| Demographics | Rating | Rank | Disability Age Under 5 |
| Chinese | 97.2 /100 | #90 | Exceptional 1.1% |
| Albanians | 97.2 /100 | #91 | Exceptional 1.1% |
| Immigrants from Cuba | 97.0 /100 | #92 | Exceptional 1.1% |
| Spanish Americans | 96.9 /100 | #93 | Exceptional 1.1% |
| Sri Lankans | 96.8 /100 | #94 | Exceptional 1.1% |
| Immigrants from Moldova | 96.8 /100 | #95 | Exceptional 1.1% |
| Mongolians | 96.6 /100 | #96 | Exceptional 1.1% |
| Immigrants from Iraq | 96.5 /100 | #97 | Exceptional 1.1% |
| Immigrants from South Eastern Asia | 96.5 /100 | #98 | Exceptional 1.1% |
| Dominicans | 96.3 /100 | #99 | Exceptional 1.1% |
| Nicaraguans | 96.3 /100 | #100 | Exceptional 1.1% |
| Immigrants from Uganda | 96.1 /100 | #101 | Exceptional 1.1% |
| Immigrants from Morocco | 96.0 /100 | #102 | Exceptional 1.2% |
| Immigrants from Nicaragua | 96.0 /100 | #103 | Exceptional 1.2% |
| Indonesians | 95.9 /100 | #104 | Exceptional 1.2% |
Immigrants from Iraq Disability Age Under 5 Correlation Summary
| Measurement | Immigrants from Iraq Data | Disability Age Under 5 Data |
| Minimum | 0.029% | 0.070% |
| Maximum | 22.2% | 4.9% |
| Range | 22.1% | 4.8% |
| Mean | 3.4% | 1.4% |
| Median | 2.0% | 1.3% |
| Interquartile 25% (IQ1) | 0.92% | 0.84% |
| Interquartile 75% (IQ3) | 4.0% | 1.7% |
| Interquartile Range (IQR) | 3.0% | 0.91% |
| Standard Deviation (Sample) | 4.2% | 0.90% |
| Standard Deviation (Population) | 4.1% | 0.89% |
Correlation Details
| Immigrants from Iraq Percentile | Sample Size | Disability Age Under 5 |
[ 0.0% - 0.5% ] 0.029% | 67,235,529 | 0.87% |
[ 0.0% - 0.5% ] 0.097% | 26,128,968 | 0.98% |
[ 0.0% - 0.5% ] 0.15% | 14,939,358 | 0.89% |
[ 0.0% - 0.5% ] 0.22% | 7,059,764 | 1.2% |
[ 0.0% - 0.5% ] 0.29% | 3,541,078 | 1.3% |
[ 0.0% - 0.5% ] 0.35% | 1,500,762 | 1.6% |
[ 0.0% - 0.5% ] 0.43% | 1,972,556 | 1.2% |
[ 0.0% - 0.5% ] 0.49% | 1,148,989 | 1.1% |
[ 0.5% - 1.0% ] 0.57% | 533,412 | 0.80% |
[ 0.5% - 1.0% ] 0.63% | 1,085,190 | 1.2% |
[ 0.5% - 1.0% ] 0.70% | 1,632,082 | 1.2% |
[ 0.5% - 1.0% ] 0.75% | 287,818 | 1.3% |
[ 0.5% - 1.0% ] 0.82% | 487,638 | 1.3% |
[ 0.5% - 1.0% ] 0.89% | 232,262 | 3.0% |
[ 0.5% - 1.0% ] 0.95% | 617,773 | 0.94% |
[ 1.0% - 1.5% ] 1.01% | 202,701 | 1.8% |
[ 1.0% - 1.5% ] 1.09% | 153,345 | 0.69% |
[ 1.0% - 1.5% ] 1.15% | 373,093 | 2.4% |
[ 1.0% - 1.5% ] 1.23% | 55,995 | 4.9% |
[ 1.0% - 1.5% ] 1.29% | 58,633 | 0.46% |
[ 1.0% - 1.5% ] 1.36% | 59,497 | 0.46% |
[ 1.0% - 1.5% ] 1.41% | 99,438 | 0.77% |
[ 1.5% - 2.0% ] 1.60% | 38,227 | 1.4% |
[ 1.5% - 2.0% ] 1.66% | 42,621 | 1.5% |
[ 1.5% - 2.0% ] 1.76% | 43,403 | 1.7% |
[ 1.5% - 2.0% ] 1.81% | 91,452 | 1.4% |
[ 1.5% - 2.0% ] 1.90% | 40,299 | 1.2% |
[ 1.5% - 2.0% ] 1.97% | 18,105 | 0.094% |
[ 1.5% - 2.0% ] 2.00% | 78,324 | 2.8% |
[ 2.0% - 2.5% ] 2.07% | 17,123 | 1.8% |
[ 2.0% - 2.5% ] 2.12% | 71,140 | 3.6% |
[ 2.0% - 2.5% ] 2.18% | 13,171 | 2.3% |
[ 2.0% - 2.5% ] 2.34% | 49,287 | 1.6% |
[ 2.5% - 3.0% ] 2.56% | 30,130 | 1.6% |
[ 2.5% - 3.0% ] 2.61% | 28,918 | 2.6% |
[ 2.5% - 3.0% ] 2.67% | 61,447 | 1.6% |
[ 2.5% - 3.0% ] 2.71% | 30,637 | 2.3% |
[ 2.5% - 3.0% ] 2.81% | 74,389 | 2.5% |
[ 2.5% - 3.0% ] 2.83% | 22,051 | 1.8% |
[ 2.5% - 3.0% ] 2.97% | 162,315 | 0.74% |
[ 3.0% - 3.5% ] 3.43% | 57,510 | 0.65% |
[ 3.5% - 4.0% ] 3.75% | 33,170 | 0.45% |
[ 3.5% - 4.0% ] 3.85% | 67,076 | 1.6% |
[ 4.0% - 4.5% ] 4.05% | 62,474 | 0.89% |
[ 4.0% - 4.5% ] 4.08% | 24,441 | 0.44% |
[ 4.0% - 4.5% ] 4.34% | 6,607 | 3.1% |
[ 4.5% - 5.0% ] 4.56% | 29,330 | 2.7% |
[ 5.0% - 5.5% ] 5.16% | 40,392 | 1.4% |
[ 6.5% - 7.0% ] 6.61% | 27,848 | 0.070% |
[ 7.0% - 7.5% ] 7.05% | 69,638 | 1.3% |
[ 10.0% - 10.5% ] 10.48% | 33,174 | 0.35% |
[ 10.5% - 11.0% ] 10.54% | 45,937 | 0.40% |
[ 11.0% - 11.5% ] 11.30% | 34,921 | 1.5% |
[ 11.5% - 12.0% ] 11.80% | 59,775 | 1.2% |
[ 12.0% - 12.5% ] 12.19% | 105,721 | 1.3% |
[ 13.0% - 13.5% ] 13.14% | 133,744 | 0.75% |
[ 22.0% - 22.5% ] 22.18% | 43,232 | 1.0% |