Immigrants from Western Africa Disability Age Under 5

COMPARE

Immigrants from Western Africa
Race
Ancestry
AfghanAfricanAlaska NativeAlaskan AthabascanAlbanianAleutAlsatianAmericanApacheArabArapahoArgentineanArmenianAssyrian/Chaldean/SyriacAustralianAustrianBahamianBangladeshiBarbadianBasqueBelgianBelizeanBermudanBhutaneseBlackfeetBolivianBrazilianBritishBritish West IndianBulgarianBurmeseCajunCambodianCanadianCape VerdeanCarpatho RusynCelticCentral AmericanCentral American IndianCherokeeCheyenneChickasawChileanChineseChippewaChoctawColombianColvilleComancheCosta RicanCreeCreekCroatianCrowCubanCypriotCzechCzechoslovakianDanishDelawareDominicanDutchDutch West IndianEastern EuropeanEcuadorianEgyptianEnglishEstonianEthiopianEuropeanFijianFilipinoFinnishFrenchFrench American IndianFrench CanadianGermanGerman RussianGhanaianGreekGuamanian/ChamorroGuatemalanGuyaneseHaitianHmongHonduranHopiHoumaHungarianIcelanderIndian (Asian)IndonesianInupiatIranianIraqiIrishIroquoisIsraeliItalianJamaicanJapaneseJordanianKenyanKiowaKoreanLaotianLatvianLebaneseLiberianLithuanianLumbeeLuxembourgerMacedonianMalaysianMalteseMarshalleseMenomineeMexicanMexican American IndianMongolianMoroccanNative HawaiianNavajoNepaleseNew ZealanderNicaraguanNigerianNorthern EuropeanNorwegianOkinawanOsageOttawaPaiutePakistaniPalestinianPanamanianParaguayanPennsylvania GermanPeruvianPimaPolishPortuguesePotawatomiPuebloPuerto RicanPuget Sound SalishRomanianRussianSalvadoranSamoanScandinavianScotch-IrishScottishSeminoleSenegaleseSerbianShoshoneSierra LeoneanSiouxSlavicSlovakSloveneSomaliSouth AfricanSouth AmericanSouth American IndianSoviet UnionSpaniardSpanishSpanish AmericanSpanish American IndianSri LankanSubsaharan AfricanSudaneseSwedishSwissSyrianTaiwaneseThaiTlingit-HaidaTohono O'OdhamTonganTrinidadian and TobagonianTsimshianTurkishU.S. Virgin IslanderUgandanUkrainianUruguayanUteVenezuelanVietnameseWelshWest IndianYakamaYaquiYugoslavianYumanYup'ikZimbabwean
Immigration
NonimmigrantsImmigrantsAfghanistanAfricaAlbaniaArgentinaArmeniaAsiaAustraliaAustriaBahamasBangladeshBarbadosBelarusBelgiumBelizeBoliviaBosnia and HerzegovinaBrazilBulgariaBurma/MyanmarCabo VerdeCambodiaCameroonCanadaCaribbeanCentral AmericaChileChinaColombiaCongoCosta RicaCroatiaCubaCzechoslovakiaDenmarkDominicaDominican RepublicEastern AfricaEastern AsiaEastern EuropeEcuadorEgyptEl SalvadorEnglandEritreaEthiopiaEuropeFijiFranceGermanyGhanaGreeceGrenadaGuatemalaGuyanaHaitiHondurasHong KongHungaryIndiaIndonesiaIranIraqIrelandIsraelItalyJamaicaJapanJordanKazakhstanKenyaKoreaKuwaitLaosLatin AmericaLatviaLebanonLiberiaLithuaniaMalaysiaMexicoMicronesiaMiddle AfricaMoldovaMoroccoNepalNetherlandsNicaraguaNigeriaNorth AmericaNorth MacedoniaNorthern AfricaNorthern EuropeNorwayOceaniaPakistanPanamaPeruPhilippinesPolandPortugalRomaniaRussiaSaudi ArabiaScotlandSenegalSerbiaSierra LeoneSingaporeSomaliaSouth AfricaSouth AmericaSouth Central AsiaSouth Eastern AsiaSouthern EuropeSpainSri LankaSt. Vincent and the GrenadinesSudanSwedenSwitzerlandSyriaTaiwanThailandTrinidad and TobagoTurkeyUgandaUkraineUruguayUzbekistanVenezuelaVietnamWest IndiesWestern AfricaWestern AsiaWestern EuropeYemenZaireZimbabweAzores
Select to Compare
Race
Ancestry
AfghanAfricanAlaska NativeAlaskan AthabascanAlbanianAleutAlsatianAmericanApacheArabArapahoArgentineanArmenianAssyrian/Chaldean/SyriacAustralianAustrianBahamianBangladeshiBarbadianBasqueBelgianBelizeanBermudanBhutaneseBlackfeetBolivianBrazilianBritishBritish West IndianBulgarianBurmeseCajunCambodianCanadianCape VerdeanCarpatho RusynCelticCentral AmericanCentral American IndianCherokeeCheyenneChickasawChileanChineseChippewaChoctawColombianColvilleComancheCosta RicanCreeCreekCroatianCrowCubanCypriotCzechCzechoslovakianDanishDelawareDominicanDutchDutch West IndianEastern EuropeanEcuadorianEgyptianEnglishEstonianEthiopianEuropeanFijianFilipinoFinnishFrenchFrench American IndianFrench CanadianGermanGerman RussianGhanaianGreekGuamanian/ChamorroGuatemalanGuyaneseHaitianHmongHonduranHopiHoumaHungarianIcelanderIndian (Asian)IndonesianInupiatIranianIraqiIrishIroquoisIsraeliItalianJamaicanJapaneseJordanianKenyanKiowaKoreanLaotianLatvianLebaneseLiberianLithuanianLumbeeLuxembourgerMacedonianMalaysianMalteseMarshalleseMenomineeMexicanMexican American IndianMongolianMoroccanNative HawaiianNavajoNepaleseNew ZealanderNicaraguanNigerianNorthern EuropeanNorwegianOkinawanOsageOttawaPaiutePakistaniPalestinianPanamanianParaguayanPennsylvania GermanPeruvianPimaPolishPortuguesePotawatomiPuebloPuerto RicanPuget Sound SalishRomanianRussianSalvadoranSamoanScandinavianScotch-IrishScottishSeminoleSenegaleseSerbianShoshoneSierra LeoneanSiouxSlavicSlovakSloveneSomaliSouth AfricanSouth AmericanSouth American IndianSoviet UnionSpaniardSpanishSpanish AmericanSpanish American IndianSri LankanSubsaharan AfricanSudaneseSwedishSwissSyrianTaiwaneseThaiTlingit-HaidaTohono O'OdhamTonganTrinidadian and TobagonianTsimshianTurkishU.S. Virgin IslanderUgandanUkrainianUruguayanUteVenezuelanVietnameseWelshWest IndianYakamaYaquiYugoslavianYumanYup'ikZimbabwean
Immigration
NonimmigrantsImmigrantsAfghanistanAfricaAlbaniaArgentinaArmeniaAsiaAustraliaAustriaBahamasBangladeshBarbadosBelarusBelgiumBelizeBoliviaBosnia and HerzegovinaBrazilBulgariaBurma/MyanmarCabo VerdeCambodiaCameroonCanadaCaribbeanCentral AmericaChileChinaColombiaCongoCosta RicaCroatiaCubaCzechoslovakiaDenmarkDominicaDominican RepublicEastern AfricaEastern AsiaEastern EuropeEcuadorEgyptEl SalvadorEnglandEritreaEthiopiaEuropeFijiFranceGermanyGhanaGreeceGrenadaGuatemalaGuyanaHaitiHondurasHong KongHungaryIndiaIndonesiaIranIraqIrelandIsraelItalyJamaicaJapanJordanKazakhstanKenyaKoreaKuwaitLaosLatin AmericaLatviaLebanonLiberiaLithuaniaMalaysiaMexicoMicronesiaMiddle AfricaMoldovaMoroccoNepalNetherlandsNicaraguaNigeriaNorth AmericaNorth MacedoniaNorthern AfricaNorthern EuropeNorwayOceaniaPakistanPanamaPeruPhilippinesPolandPortugalRomaniaRussiaSaudi ArabiaScotlandSenegalSerbiaSierra LeoneSingaporeSomaliaSouth AfricaSouth AmericaSouth Central AsiaSouth Eastern AsiaSouthern EuropeSpainSri LankaSt. Vincent and the GrenadinesSudanSwedenSwitzerlandSyriaTaiwanThailandTrinidad and TobagoTurkeyUgandaUkraineUruguayUzbekistanVenezuelaVietnamWest IndiesWestern AsiaWestern EuropeYemenZaireZimbabweAzores
Disability Age Under 5
Income
Poverty
Unemployment
Labor Participation
Family Structure
Vehicle Availability
Education Level
Disability

Immigrants from Western Africa Disability Age Under 5
Average

1.2%
DISABILITY | AGE UNDER 5
42.5/ 100
METRIC RATING
185th/ 347
METRIC RANK

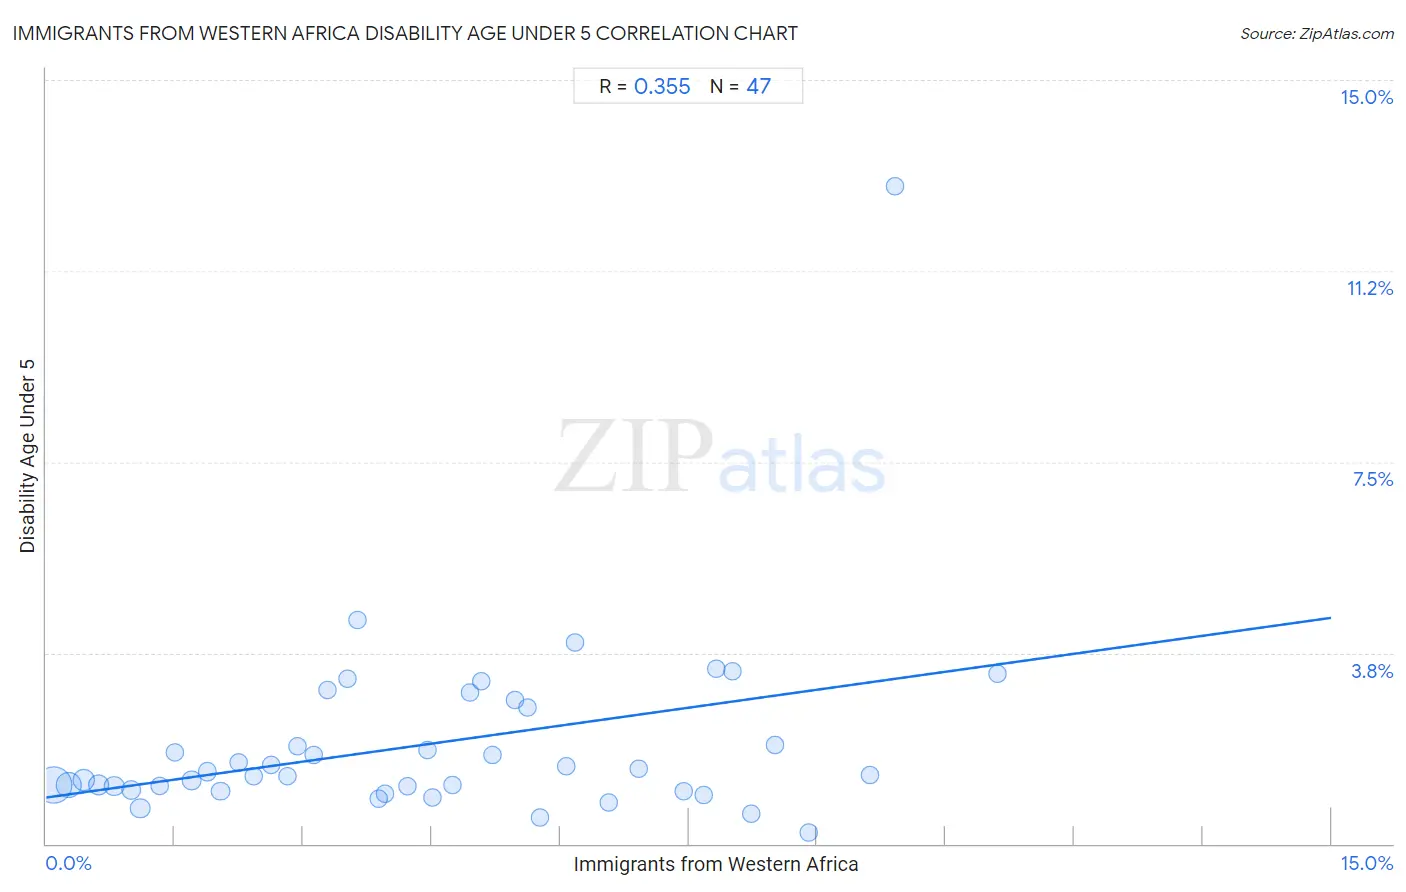
Immigrants from Western Africa Disability Age Under 5 Correlation Chart

The statistical analysis conducted on geographies consisting of 204,229,476 people shows a mild positive correlation between the proportion of Immigrants from Western Africa and percentage of population with a disability under the age of 5 in the United States with a correlation coefficient (R) of 0.355 and weighted average of 1.2%. On average, for every 1% (one percent) increase in Immigrants from Western Africa within a typical geography, there is an increase of 0.24% in percentage of population with a disability under the age of 5.
Immigrants from Western Africa Disability Age Under 5
It is essential to understand that the correlation between the percentage of Immigrants from Western Africa and percentage of population with a disability under the age of 5 does not imply a direct cause-and-effect relationship. It remains uncertain whether the presence of Immigrants from Western Africa influences an upward or downward trend in the level of percentage of population with a disability under the age of 5 within an area, or if Immigrants from Western Africa simply ended up residing in those areas with higher or lower levels of percentage of population with a disability under the age of 5 due to other factors.

Demographics Similar to Immigrants from Western Africa by Disability Age Under 5

In terms of disability age under 5, the demographic groups most similar to Immigrants from Western Africa are Cuban (1.2%, a difference of 0.0%), Palestinian (1.2%, a difference of 0.050%), Immigrants from Saudi Arabia (1.2%, a difference of 0.070%), Immigrants from Peru (1.2%, a difference of 0.11%), and Macedonian (1.2%, a difference of 0.11%).
DemographicsRating | RankDisability Age Under 5
Venezuelans
47.1
/100
|
#178
Average
1.2%
Immigrants from Bahamas
45.2
/100
|
#179
Average
1.2%
Immigrants from Mexico
44.4
/100
|
#180
Average
1.2%
Immigrants from Peru
43.7
/100
|
#181
Average
1.2%
Macedonians
43.7
/100
|
#181
Average
1.2%
Immigrants from Saudi Arabia
43.3
/100
|
#183
Average
1.2%
Palestinians
43.0
/100
|
#184
Average
1.2%
Immigrants from Western Africa
42.5
/100
|
#185
Average
1.2%
Cubans
42.5
/100
|
#186
Average
1.2%
Immigrants from Haiti
40.2
/100
|
#187
Average
1.3%
Haitians
39.9
/100
|
#188
Fair
1.3%
Peruvians
37.6
/100
|
#189
Fair
1.3%
Immigrants from Laos
36.6
/100
|
#190
Fair
1.3%
Mexican American Indians
36.6
/100
|
#191
Fair
1.3%
Immigrants from Bosnia and Herzegovina
36.5
/100
|
#192
Fair
1.3%

Immigrants from Western Africa Disability Age Under 5 Correlation Summary

MeasurementImmigrants from Western Africa DataDisability Age Under 5 Data
Minimum0.086%0.22%
Maximum11.1%12.9%
Range11.0%12.7%
Mean4.5%2.0%
Median4.2%1.3%
Interquartile 25% (IQ1)2.0%1.0%
Interquartile 75% (IQ3)6.6%2.7%
Interquartile Range (IQR)4.5%1.6%
Standard Deviation (Sample)2.9%1.9%
Standard Deviation (Population)2.8%1.9%

Correlation Details

Immigrants from Western Africa PercentileSample SizeDisability Age Under 5
[
0.0%
-
0.5%
]
0.086%
94,325,5461.2%
[
0.0%
-
0.5%
]
0.26%
37,745,5421.2%
[
0.0%
-
0.5%
]
0.43%
18,777,4391.3%
[
0.5%
-
1.0%
]
0.62%
13,535,1771.2%
[
0.5%
-
1.0%
]
0.79%
7,773,8051.1%
[
0.5%
-
1.0%
]
0.99%
6,566,1041.0%
[
1.0%
-
1.5%
]
1.10%
10,519,0670.69%
[
1.0%
-
1.5%
]
1.32%
3,115,8191.1%
[
1.5%
-
2.0%
]
1.50%
1,195,7741.8%
[
1.5%
-
2.0%
]
1.70%
2,245,8951.2%
[
1.5%
-
2.0%
]
1.89%
1,669,1921.4%
[
2.0%
-
2.5%
]
2.03%
779,4011.0%
[
2.0%
-
2.5%
]
2.25%
905,8891.6%
[
2.0%
-
2.5%
]
2.42%
277,1701.3%
[
2.5%
-
3.0%
]
2.62%
911,0291.5%
[
2.5%
-
3.0%
]
2.81%
327,0771.3%
[
2.5%
-
3.0%
]
2.93%
270,5521.9%
[
3.0%
-
3.5%
]
3.12%
344,9691.7%
[
3.0%
-
3.5%
]
3.28%
129,4223.0%
[
3.5%
-
4.0%
]
3.51%
92,4843.2%
[
3.5%
-
4.0%
]
3.64%
153,7234.4%
[
3.5%
-
4.0%
]
3.89%
344,5630.88%
[
3.5%
-
4.0%
]
3.95%
62,9220.98%
[
4.0%
-
4.5%
]
4.22%
230,1091.1%
[
4.0%
-
4.5%
]
4.45%
81,5771.9%
[
4.5%
-
5.0%
]
4.50%
434,1650.91%
[
4.5%
-
5.0%
]
4.75%
112,2901.2%
[
4.5%
-
5.0%
]
4.94%
72,2733.0%
[
5.0%
-
5.5%
]
5.08%
76,8073.2%
[
5.0%
-
5.5%
]
5.22%
107,2841.8%
[
5.0%
-
5.5%
]
5.47%
63,2652.8%
[
5.5%
-
6.0%
]
5.62%
28,9052.7%
[
5.5%
-
6.0%
]
5.76%
74,1510.50%
[
6.0%
-
6.5%
]
6.07%
179,0071.5%
[
6.0%
-
6.5%
]
6.17%
68,5933.9%
[
6.5%
-
7.0%
]
6.57%
63,0470.82%
[
6.5%
-
7.0%
]
6.92%
122,6641.5%
[
7.0%
-
7.5%
]
7.44%
105,4691.0%
[
7.5%
-
8.0%
]
7.67%
22,1140.95%
[
7.5%
-
8.0%
]
7.83%
61,3053.4%
[
8.0%
-
8.5%
]
8.01%
40,7243.4%
[
8.0%
-
8.5%
]
8.23%
32,9120.59%
[
8.5%
-
9.0%
]
8.51%
60,7971.9%
[
8.5%
-
9.0%
]
8.90%
84,9510.22%
[
9.5%
-
10.0%
]
9.61%
22,4931.3%
[
9.5%
-
10.0%
]
9.90%
5,33112.9%
[
11.0%
-
11.5%
]
11.10%
10,6823.4%