Immigrants from Ghana Disability Age Under 5

COMPARE

Immigrants from Ghana
Race
Ancestry
AfghanAfricanAlaska NativeAlaskan AthabascanAlbanianAleutAlsatianAmericanApacheArabArapahoArgentineanArmenianAssyrian/Chaldean/SyriacAustralianAustrianBahamianBangladeshiBarbadianBasqueBelgianBelizeanBermudanBhutaneseBlackfeetBolivianBrazilianBritishBritish West IndianBulgarianBurmeseCajunCambodianCanadianCape VerdeanCarpatho RusynCelticCentral AmericanCentral American IndianCherokeeCheyenneChickasawChileanChineseChippewaChoctawColombianColvilleComancheCosta RicanCreeCreekCroatianCrowCubanCypriotCzechCzechoslovakianDanishDelawareDominicanDutchDutch West IndianEastern EuropeanEcuadorianEgyptianEnglishEstonianEthiopianEuropeanFijianFilipinoFinnishFrenchFrench American IndianFrench CanadianGermanGerman RussianGhanaianGreekGuamanian/ChamorroGuatemalanGuyaneseHaitianHmongHonduranHopiHoumaHungarianIcelanderIndian (Asian)IndonesianInupiatIranianIraqiIrishIroquoisIsraeliItalianJamaicanJapaneseJordanianKenyanKiowaKoreanLaotianLatvianLebaneseLiberianLithuanianLumbeeLuxembourgerMacedonianMalaysianMalteseMarshalleseMenomineeMexicanMexican American IndianMongolianMoroccanNative HawaiianNavajoNepaleseNew ZealanderNicaraguanNigerianNorthern EuropeanNorwegianOkinawanOsageOttawaPaiutePakistaniPalestinianPanamanianParaguayanPennsylvania GermanPeruvianPimaPolishPortuguesePotawatomiPuebloPuerto RicanPuget Sound SalishRomanianRussianSalvadoranSamoanScandinavianScotch-IrishScottishSeminoleSenegaleseSerbianShoshoneSierra LeoneanSiouxSlavicSlovakSloveneSomaliSouth AfricanSouth AmericanSouth American IndianSoviet UnionSpaniardSpanishSpanish AmericanSpanish American IndianSri LankanSubsaharan AfricanSudaneseSwedishSwissSyrianTaiwaneseThaiTlingit-HaidaTohono O'OdhamTonganTrinidadian and TobagonianTsimshianTurkishU.S. Virgin IslanderUgandanUkrainianUruguayanUteVenezuelanVietnameseWelshWest IndianYakamaYaquiYugoslavianYumanYup'ikZimbabwean
Immigration
NonimmigrantsImmigrantsAfghanistanAfricaAlbaniaArgentinaArmeniaAsiaAustraliaAustriaBahamasBangladeshBarbadosBelarusBelgiumBelizeBoliviaBosnia and HerzegovinaBrazilBulgariaBurma/MyanmarCabo VerdeCambodiaCameroonCanadaCaribbeanCentral AmericaChileChinaColombiaCongoCosta RicaCroatiaCubaCzechoslovakiaDenmarkDominicaDominican RepublicEastern AfricaEastern AsiaEastern EuropeEcuadorEgyptEl SalvadorEnglandEritreaEthiopiaEuropeFijiFranceGermanyGhanaGreeceGrenadaGuatemalaGuyanaHaitiHondurasHong KongHungaryIndiaIndonesiaIranIraqIrelandIsraelItalyJamaicaJapanJordanKazakhstanKenyaKoreaKuwaitLaosLatin AmericaLatviaLebanonLiberiaLithuaniaMalaysiaMexicoMicronesiaMiddle AfricaMoldovaMoroccoNepalNetherlandsNicaraguaNigeriaNorth AmericaNorth MacedoniaNorthern AfricaNorthern EuropeNorwayOceaniaPakistanPanamaPeruPhilippinesPolandPortugalRomaniaRussiaSaudi ArabiaScotlandSenegalSerbiaSierra LeoneSingaporeSomaliaSouth AfricaSouth AmericaSouth Central AsiaSouth Eastern AsiaSouthern EuropeSpainSri LankaSt. Vincent and the GrenadinesSudanSwedenSwitzerlandSyriaTaiwanThailandTrinidad and TobagoTurkeyUgandaUkraineUruguayUzbekistanVenezuelaVietnamWest IndiesWestern AfricaWestern AsiaWestern EuropeYemenZaireZimbabweAzores
Select to Compare
Race
Ancestry
AfghanAfricanAlaska NativeAlaskan AthabascanAlbanianAleutAlsatianAmericanApacheArabArapahoArgentineanArmenianAssyrian/Chaldean/SyriacAustralianAustrianBahamianBangladeshiBarbadianBasqueBelgianBelizeanBermudanBhutaneseBlackfeetBolivianBrazilianBritishBritish West IndianBulgarianBurmeseCajunCambodianCanadianCape VerdeanCarpatho RusynCelticCentral AmericanCentral American IndianCherokeeCheyenneChickasawChileanChineseChippewaChoctawColombianColvilleComancheCosta RicanCreeCreekCroatianCrowCubanCypriotCzechCzechoslovakianDanishDelawareDominicanDutchDutch West IndianEastern EuropeanEcuadorianEgyptianEnglishEstonianEthiopianEuropeanFijianFilipinoFinnishFrenchFrench American IndianFrench CanadianGermanGerman RussianGhanaianGreekGuamanian/ChamorroGuatemalanGuyaneseHaitianHmongHonduranHopiHoumaHungarianIcelanderIndian (Asian)IndonesianInupiatIranianIraqiIrishIroquoisIsraeliItalianJamaicanJapaneseJordanianKenyanKiowaKoreanLaotianLatvianLebaneseLiberianLithuanianLumbeeLuxembourgerMacedonianMalaysianMalteseMarshalleseMenomineeMexicanMexican American IndianMongolianMoroccanNative HawaiianNavajoNepaleseNew ZealanderNicaraguanNigerianNorthern EuropeanNorwegianOkinawanOsageOttawaPaiutePakistaniPalestinianPanamanianParaguayanPennsylvania GermanPeruvianPimaPolishPortuguesePotawatomiPuebloPuerto RicanPuget Sound SalishRomanianRussianSalvadoranSamoanScandinavianScotch-IrishScottishSeminoleSenegaleseSerbianShoshoneSierra LeoneanSiouxSlavicSlovakSloveneSomaliSouth AfricanSouth AmericanSouth American IndianSoviet UnionSpaniardSpanishSpanish AmericanSpanish American IndianSri LankanSubsaharan AfricanSudaneseSwedishSwissSyrianTaiwaneseThaiTlingit-HaidaTohono O'OdhamTonganTrinidadian and TobagonianTsimshianTurkishU.S. Virgin IslanderUgandanUkrainianUruguayanUteVenezuelanVietnameseWelshWest IndianYakamaYaquiYugoslavianYumanYup'ikZimbabwean
Immigration
NonimmigrantsImmigrantsAfghanistanAfricaAlbaniaArgentinaArmeniaAsiaAustraliaAustriaBahamasBangladeshBarbadosBelarusBelgiumBelizeBoliviaBosnia and HerzegovinaBrazilBulgariaBurma/MyanmarCabo VerdeCambodiaCameroonCanadaCaribbeanCentral AmericaChileChinaColombiaCongoCosta RicaCroatiaCubaCzechoslovakiaDenmarkDominicaDominican RepublicEastern AfricaEastern AsiaEastern EuropeEcuadorEgyptEl SalvadorEnglandEritreaEthiopiaEuropeFijiFranceGermanyGreeceGrenadaGuatemalaGuyanaHaitiHondurasHong KongHungaryIndiaIndonesiaIranIraqIrelandIsraelItalyJamaicaJapanJordanKazakhstanKenyaKoreaKuwaitLaosLatin AmericaLatviaLebanonLiberiaLithuaniaMalaysiaMexicoMicronesiaMiddle AfricaMoldovaMoroccoNepalNetherlandsNicaraguaNigeriaNorth AmericaNorth MacedoniaNorthern AfricaNorthern EuropeNorwayOceaniaPakistanPanamaPeruPhilippinesPolandPortugalRomaniaRussiaSaudi ArabiaScotlandSenegalSerbiaSierra LeoneSingaporeSomaliaSouth AfricaSouth AmericaSouth Central AsiaSouth Eastern AsiaSouthern EuropeSpainSri LankaSt. Vincent and the GrenadinesSudanSwedenSwitzerlandSyriaTaiwanThailandTrinidad and TobagoTurkeyUgandaUkraineUruguayUzbekistanVenezuelaVietnamWest IndiesWestern AfricaWestern AsiaWestern EuropeYemenZaireZimbabweAzores
Disability Age Under 5
Income
Poverty
Unemployment
Labor Participation
Family Structure
Vehicle Availability
Education Level
Disability

Immigrants from Ghana Disability Age Under 5
Good

1.2%
DISABILITY | AGE UNDER 5
68.7/ 100
METRIC RATING
155th/ 347
METRIC RANK

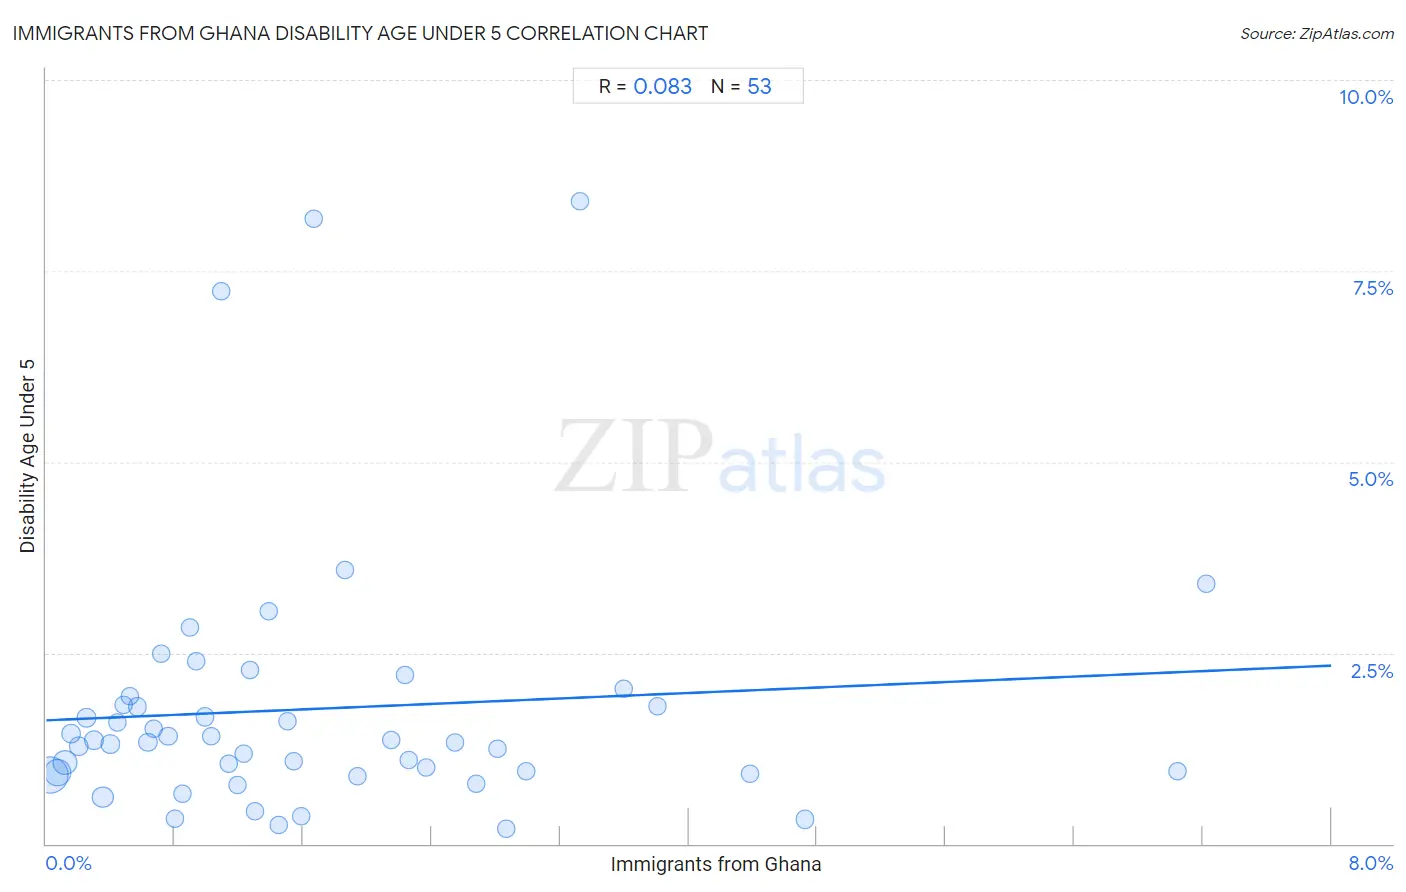
Immigrants from Ghana Disability Age Under 5 Correlation Chart

The statistical analysis conducted on geographies consisting of 133,499,136 people shows a slight positive correlation between the proportion of Immigrants from Ghana and percentage of population with a disability under the age of 5 in the United States with a correlation coefficient (R) of 0.083 and weighted average of 1.2%. On average, for every 1% (one percent) increase in Immigrants from Ghana within a typical geography, there is an increase of 0.090% in percentage of population with a disability under the age of 5.
Immigrants from Ghana Disability Age Under 5
It is essential to understand that the correlation between the percentage of Immigrants from Ghana and percentage of population with a disability under the age of 5 does not imply a direct cause-and-effect relationship. It remains uncertain whether the presence of Immigrants from Ghana influences an upward or downward trend in the level of percentage of population with a disability under the age of 5 within an area, or if Immigrants from Ghana simply ended up residing in those areas with higher or lower levels of percentage of population with a disability under the age of 5 due to other factors.

Demographics Similar to Immigrants from Ghana by Disability Age Under 5

In terms of disability age under 5, the demographic groups most similar to Immigrants from Ghana are Uruguayan (1.2%, a difference of 0.010%), Hawaiian (1.2%, a difference of 0.020%), Immigrants from Thailand (1.2%, a difference of 0.080%), Immigrants from South America (1.2%, a difference of 0.18%), and Arab (1.2%, a difference of 0.24%).
DemographicsRating | RankDisability Age Under 5
Ghanaians
76.3
/100
|
#148
Good
1.2%
Kenyans
75.9
/100
|
#149
Good
1.2%
South Americans
75.6
/100
|
#150
Good
1.2%
Yaqui
74.8
/100
|
#151
Good
1.2%
Hondurans
72.5
/100
|
#152
Good
1.2%
Immigrants from Thailand
69.4
/100
|
#153
Good
1.2%
Uruguayans
68.8
/100
|
#154
Good
1.2%
Immigrants from Ghana
68.7
/100
|
#155
Good
1.2%
Hawaiians
68.5
/100
|
#156
Good
1.2%
Immigrants from South America
67.0
/100
|
#157
Good
1.2%
Arabs
66.4
/100
|
#158
Good
1.2%
Colombians
65.8
/100
|
#159
Good
1.2%
Immigrants from Latin America
65.8
/100
|
#160
Good
1.2%
Immigrants from Africa
65.1
/100
|
#161
Good
1.2%
Guatemalans
63.6
/100
|
#162
Good
1.2%

Immigrants from Ghana Disability Age Under 5 Correlation Summary

MeasurementImmigrants from Ghana DataDisability Age Under 5 Data
Minimum0.022%0.20%
Maximum7.2%8.4%
Range7.2%8.2%
Mean1.7%1.8%
Median1.2%1.3%
Interquartile 25% (IQ1)0.60%0.92%
Interquartile 75% (IQ3)2.3%1.9%
Interquartile Range (IQR)1.7%0.96%
Standard Deviation (Sample)1.6%1.7%
Standard Deviation (Population)1.6%1.7%

Correlation Details

Immigrants from Ghana PercentileSample SizeDisability Age Under 5
[
0.0%
-
0.5%
]
0.022%
56,407,8560.90%
[
0.0%
-
0.5%
]
0.068%
25,707,6390.94%
[
0.0%
-
0.5%
]
0.11%
18,777,1581.1%
[
0.0%
-
0.5%
]
0.16%
4,717,0631.4%
[
0.0%
-
0.5%
]
0.20%
3,718,1801.3%
[
0.0%
-
0.5%
]
0.25%
2,143,3971.6%
[
0.0%
-
0.5%
]
0.30%
2,357,6771.4%
[
0.0%
-
0.5%
]
0.35%
9,530,4720.61%
[
0.0%
-
0.5%
]
0.40%
1,728,0971.3%
[
0.0%
-
0.5%
]
0.44%
422,1051.6%
[
0.0%
-
0.5%
]
0.48%
747,6331.8%
[
0.5%
-
1.0%
]
0.52%
534,4801.9%
[
0.5%
-
1.0%
]
0.57%
554,2921.8%
[
0.5%
-
1.0%
]
0.63%
1,381,1191.3%
[
0.5%
-
1.0%
]
0.67%
302,5921.5%
[
0.5%
-
1.0%
]
0.71%
287,5262.5%
[
0.5%
-
1.0%
]
0.76%
320,0251.4%
[
0.5%
-
1.0%
]
0.80%
462,8770.33%
[
0.5%
-
1.0%
]
0.84%
175,1510.66%
[
0.5%
-
1.0%
]
0.90%
286,5502.8%
[
0.5%
-
1.0%
]
0.94%
125,9492.4%
[
0.5%
-
1.0%
]
0.99%
226,4581.7%
[
1.0%
-
1.5%
]
1.03%
170,1341.4%
[
1.0%
-
1.5%
]
1.09%
18,4997.2%
[
1.0%
-
1.5%
]
1.14%
154,0641.0%
[
1.0%
-
1.5%
]
1.19%
49,7110.78%
[
1.0%
-
1.5%
]
1.23%
430,8251.2%
[
1.0%
-
1.5%
]
1.27%
71,2922.3%
[
1.0%
-
1.5%
]
1.30%
20,6780.43%
[
1.0%
-
1.5%
]
1.38%
116,3843.0%
[
1.0%
-
1.5%
]
1.45%
61,9220.25%
[
1.5%
-
2.0%
]
1.50%
105,9961.6%
[
1.5%
-
2.0%
]
1.54%
51,3111.1%
[
1.5%
-
2.0%
]
1.58%
202,5050.36%
[
1.5%
-
2.0%
]
1.66%
19,6138.2%
[
1.5%
-
2.0%
]
1.86%
98,2603.6%
[
1.5%
-
2.0%
]
1.93%
110,5080.89%
[
2.0%
-
2.5%
]
2.15%
88,5751.4%
[
2.0%
-
2.5%
]
2.23%
54,6712.2%
[
2.0%
-
2.5%
]
2.26%
41,7591.1%
[
2.0%
-
2.5%
]
2.37%
80,3851.0%
[
2.5%
-
3.0%
]
2.55%
22,9661.3%
[
2.5%
-
3.0%
]
2.68%
36,2650.79%
[
2.5%
-
3.0%
]
2.81%
30,4651.2%
[
2.5%
-
3.0%
]
2.86%
16,6200.20%
[
2.5%
-
3.0%
]
2.99%
204,1910.94%
[
3.0%
-
3.5%
]
3.33%
3,1578.4%
[
3.5%
-
4.0%
]
3.59%
78,6242.0%
[
3.5%
-
4.0%
]
3.81%
79,8171.8%
[
4.0%
-
4.5%
]
4.38%
30,5900.91%
[
4.5%
-
5.0%
]
4.73%
72,2150.32%
[
7.0%
-
7.5%
]
7.04%
22,1140.95%
[
7.0%
-
7.5%
]
7.22%
40,7243.4%