Kiowa Disability Age Under 5
COMPARE
Kiowa
Select to Compare
Disability Age Under 5
Kiowa Disability Age Under 5
1.5%
DISABILITY | AGE UNDER 5
0.0/ 100
METRIC RATING
278th/ 347
METRIC RANK
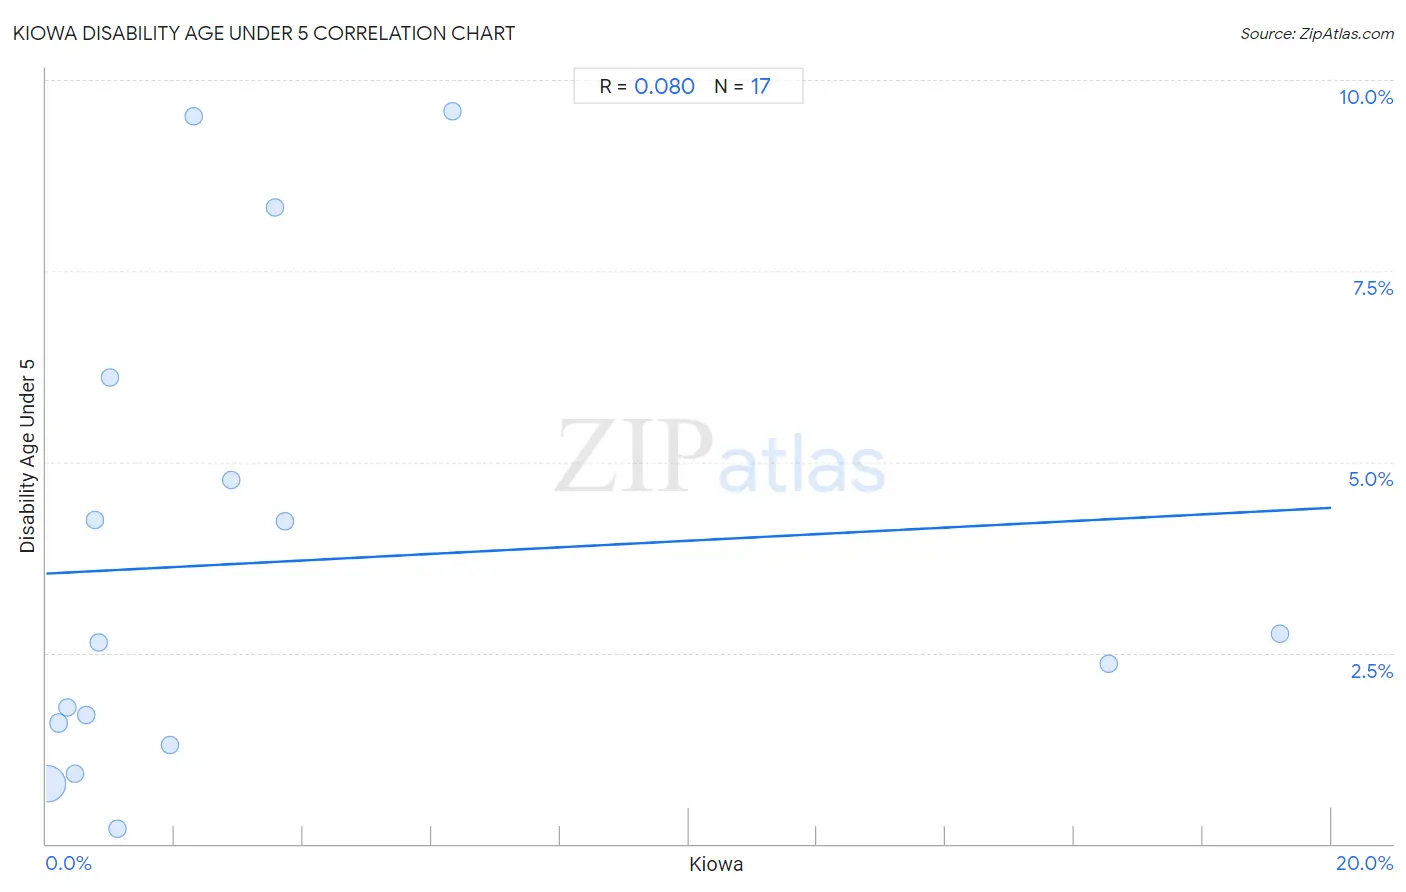
Kiowa Disability Age Under 5 Correlation Chart
The statistical analysis conducted on geographies consisting of 48,964,732 people shows a slight positive correlation between the proportion of Kiowa and percentage of population with a disability under the age of 5 in the United States with a correlation coefficient (R) of 0.080 and weighted average of 1.5%. On average, for every 1% (one percent) increase in Kiowa within a typical geography, there is an increase of 0.043% in percentage of population with a disability under the age of 5.
It is essential to understand that the correlation between the percentage of Kiowa and percentage of population with a disability under the age of 5 does not imply a direct cause-and-effect relationship. It remains uncertain whether the presence of Kiowa influences an upward or downward trend in the level of percentage of population with a disability under the age of 5 within an area, or if Kiowa simply ended up residing in those areas with higher or lower levels of percentage of population with a disability under the age of 5 due to other factors.
Demographics Similar to Kiowa by Disability Age Under 5
In terms of disability age under 5, the demographic groups most similar to Kiowa are Danish (1.5%, a difference of 0.010%), Canadian (1.5%, a difference of 0.080%), British (1.5%, a difference of 0.77%), Greek (1.5%, a difference of 0.78%), and Brazilian (1.5%, a difference of 1.4%).
| Demographics | Rating | Rank | Disability Age Under 5 |
| Immigrants from Canada | 0.1 /100 | #271 | Tragic 1.4% |
| Blacks/African Americans | 0.1 /100 | #272 | Tragic 1.4% |
| Alaskan Athabascans | 0.1 /100 | #273 | Tragic 1.5% |
| Iroquois | 0.0 /100 | #274 | Tragic 1.5% |
| Brazilians | 0.0 /100 | #275 | Tragic 1.5% |
| Greeks | 0.0 /100 | #276 | Tragic 1.5% |
| Canadians | 0.0 /100 | #277 | Tragic 1.5% |
| Kiowa | 0.0 /100 | #278 | Tragic 1.5% |
| Danes | 0.0 /100 | #279 | Tragic 1.5% |
| British | 0.0 /100 | #280 | Tragic 1.5% |
| Czechoslovakians | 0.0 /100 | #281 | Tragic 1.5% |
| Cheyenne | 0.0 /100 | #282 | Tragic 1.5% |
| Delaware | 0.0 /100 | #283 | Tragic 1.5% |
| Europeans | 0.0 /100 | #284 | Tragic 1.5% |
| Croatians | 0.0 /100 | #285 | Tragic 1.5% |
Kiowa Disability Age Under 5 Correlation Summary
| Measurement | Kiowa Data | Disability Age Under 5 Data |
| Minimum | 0.011% | 0.20% |
| Maximum | 19.2% | 9.6% |
| Range | 19.2% | 9.4% |
| Mean | 3.6% | 3.7% |
| Median | 1.1% | 2.6% |
| Interquartile 25% (IQ1) | 0.53% | 1.4% |
| Interquartile 75% (IQ3) | 3.6% | 5.4% |
| Interquartile Range (IQR) | 3.1% | 4.0% |
| Standard Deviation (Sample) | 5.6% | 3.0% |
| Standard Deviation (Population) | 5.5% | 2.9% |
Correlation Details
| Kiowa Percentile | Sample Size | Disability Age Under 5 |
[ 0.0% - 0.5% ] 0.011% | 47,622,908 | 0.79% |
[ 0.0% - 0.5% ] 0.20% | 594,750 | 1.6% |
[ 0.0% - 0.5% ] 0.32% | 392,575 | 1.8% |
[ 0.0% - 0.5% ] 0.45% | 117,151 | 0.92% |
[ 0.5% - 1.0% ] 0.62% | 47,171 | 1.7% |
[ 0.5% - 1.0% ] 0.77% | 22,020 | 4.2% |
[ 0.5% - 1.0% ] 0.81% | 36,444 | 2.6% |
[ 1.0% - 1.5% ] 1.00% | 1,298 | 6.1% |
[ 1.0% - 1.5% ] 1.11% | 91,023 | 0.20% |
[ 1.5% - 2.0% ] 1.93% | 20,630 | 1.3% |
[ 2.0% - 2.5% ] 2.30% | 1,088 | 9.5% |
[ 2.5% - 3.0% ] 2.88% | 800 | 4.8% |
[ 3.5% - 4.0% ] 3.56% | 478 | 8.3% |
[ 3.5% - 4.0% ] 3.72% | 1,263 | 4.2% |
[ 6.0% - 6.5% ] 6.32% | 1,377 | 9.6% |
[ 16.5% - 17.0% ] 16.54% | 8,033 | 2.4% |
[ 19.0% - 19.5% ] 19.20% | 5,723 | 2.8% |