Burmese Disability Age Under 5
COMPARE
Burmese
Select to Compare
Disability Age Under 5
Burmese Disability Age Under 5
1.1%
DISABILITY | AGE UNDER 5
98.5/ 100
METRIC RATING
72nd/ 347
METRIC RANK
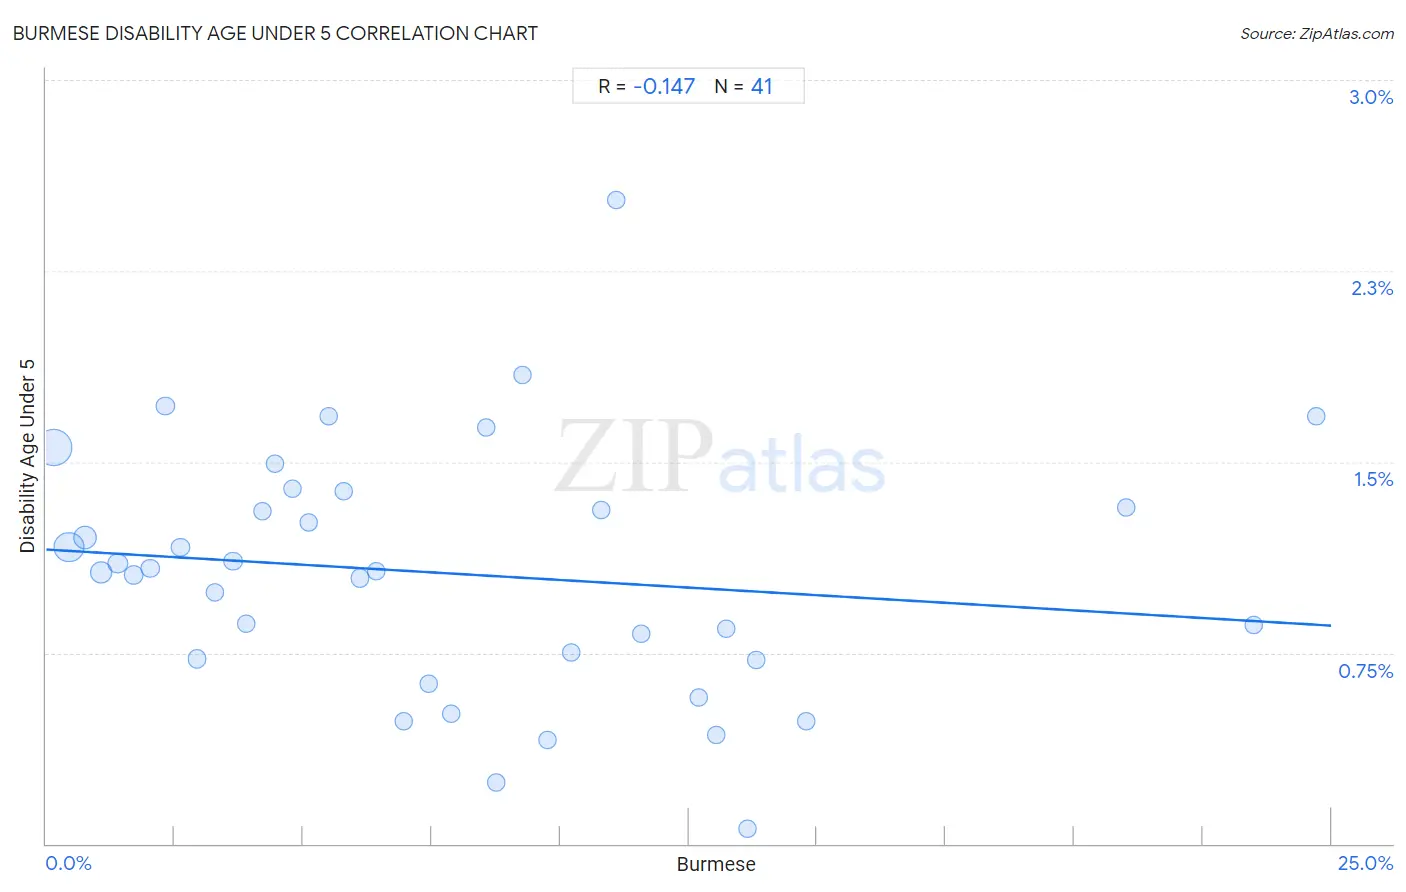
Burmese Disability Age Under 5 Correlation Chart
The statistical analysis conducted on geographies consisting of 238,564,185 people shows a poor negative correlation between the proportion of Burmese and percentage of population with a disability under the age of 5 in the United States with a correlation coefficient (R) of -0.147 and weighted average of 1.1%. On average, for every 1% (one percent) increase in Burmese within a typical geography, there is a decrease of 0.012% in percentage of population with a disability under the age of 5.
It is essential to understand that the correlation between the percentage of Burmese and percentage of population with a disability under the age of 5 does not imply a direct cause-and-effect relationship. It remains uncertain whether the presence of Burmese influences an upward or downward trend in the level of percentage of population with a disability under the age of 5 within an area, or if Burmese simply ended up residing in those areas with higher or lower levels of percentage of population with a disability under the age of 5 due to other factors.
Demographics Similar to Burmese by Disability Age Under 5
In terms of disability age under 5, the demographic groups most similar to Burmese are Immigrants from Sri Lanka (1.1%, a difference of 0.080%), Jordanian (1.1%, a difference of 0.090%), Trinidadian and Tobagonian (1.1%, a difference of 0.16%), Immigrants from Pakistan (1.1%, a difference of 0.17%), and Immigrants from Ecuador (1.1%, a difference of 0.22%).
| Demographics | Rating | Rank | Disability Age Under 5 |
| Immigrants from Korea | 98.8 /100 | #65 | Exceptional 1.1% |
| Immigrants from Indonesia | 98.7 /100 | #66 | Exceptional 1.1% |
| Immigrants from Belize | 98.7 /100 | #67 | Exceptional 1.1% |
| South Africans | 98.7 /100 | #68 | Exceptional 1.1% |
| Israelis | 98.7 /100 | #69 | Exceptional 1.1% |
| Immigrants from Ecuador | 98.6 /100 | #70 | Exceptional 1.1% |
| Trinidadians and Tobagonians | 98.6 /100 | #71 | Exceptional 1.1% |
| Burmese | 98.5 /100 | #72 | Exceptional 1.1% |
| Immigrants from Sri Lanka | 98.5 /100 | #73 | Exceptional 1.1% |
| Jordanians | 98.5 /100 | #74 | Exceptional 1.1% |
| Immigrants from Pakistan | 98.4 /100 | #75 | Exceptional 1.1% |
| Immigrants from Burma/Myanmar | 98.2 /100 | #76 | Exceptional 1.1% |
| Immigrants from Denmark | 98.1 /100 | #77 | Exceptional 1.1% |
| West Indians | 98.0 /100 | #78 | Exceptional 1.1% |
| Hmong | 98.0 /100 | #79 | Exceptional 1.1% |
Burmese Disability Age Under 5 Correlation Summary
| Measurement | Burmese Data | Disability Age Under 5 Data |
| Minimum | 0.15% | 0.058% |
| Maximum | 24.7% | 2.5% |
| Range | 24.6% | 2.5% |
| Mean | 7.8% | 1.1% |
| Median | 6.4% | 1.1% |
| Interquartile 25% (IQ1) | 3.1% | 0.72% |
| Interquartile 75% (IQ3) | 11.3% | 1.4% |
| Interquartile Range (IQR) | 8.2% | 0.63% |
| Standard Deviation (Sample) | 6.0% | 0.49% |
| Standard Deviation (Population) | 6.0% | 0.48% |
Correlation Details
| Burmese Percentile | Sample Size | Disability Age Under 5 |
[ 0.0% - 0.5% ] 0.15% | 95,549,758 | 1.6% |
[ 0.0% - 0.5% ] 0.44% | 61,214,480 | 1.2% |
[ 0.5% - 1.0% ] 0.75% | 25,070,513 | 1.2% |
[ 1.0% - 1.5% ] 1.07% | 20,224,871 | 1.1% |
[ 1.0% - 1.5% ] 1.39% | 9,833,682 | 1.1% |
[ 1.5% - 2.0% ] 1.71% | 6,714,192 | 1.1% |
[ 2.0% - 2.5% ] 2.02% | 4,148,737 | 1.1% |
[ 2.0% - 2.5% ] 2.32% | 2,437,276 | 1.7% |
[ 2.5% - 3.0% ] 2.61% | 1,749,418 | 1.2% |
[ 2.5% - 3.0% ] 2.93% | 4,955,758 | 0.73% |
[ 3.0% - 3.5% ] 3.27% | 1,018,601 | 0.99% |
[ 3.5% - 4.0% ] 3.63% | 710,926 | 1.1% |
[ 3.5% - 4.0% ] 3.90% | 337,935 | 0.86% |
[ 4.0% - 4.5% ] 4.20% | 574,308 | 1.3% |
[ 4.0% - 4.5% ] 4.45% | 376,463 | 1.5% |
[ 4.5% - 5.0% ] 4.79% | 242,364 | 1.4% |
[ 5.0% - 5.5% ] 5.12% | 474,999 | 1.3% |
[ 5.5% - 6.0% ] 5.50% | 232,376 | 1.7% |
[ 5.5% - 6.0% ] 5.80% | 55,658 | 1.4% |
[ 6.0% - 6.5% ] 6.11% | 541,462 | 1.0% |
[ 6.0% - 6.5% ] 6.42% | 164,155 | 1.1% |
[ 6.5% - 7.0% ] 6.94% | 32,965 | 0.48% |
[ 7.0% - 7.5% ] 7.44% | 160,918 | 0.63% |
[ 7.5% - 8.0% ] 7.88% | 349,711 | 0.51% |
[ 8.5% - 9.0% ] 8.57% | 67,364 | 1.6% |
[ 8.5% - 9.0% ] 8.76% | 145,454 | 0.24% |
[ 9.0% - 9.5% ] 9.26% | 38,124 | 1.8% |
[ 9.5% - 10.0% ] 9.75% | 79,410 | 0.41% |
[ 10.0% - 10.5% ] 10.22% | 25,957 | 0.75% |
[ 10.5% - 11.0% ] 10.81% | 73,203 | 1.3% |
[ 11.0% - 11.5% ] 11.08% | 147,579 | 2.5% |
[ 11.5% - 12.0% ] 11.58% | 59,410 | 0.83% |
[ 12.5% - 13.0% ] 12.68% | 225,822 | 0.58% |
[ 13.0% - 13.5% ] 13.04% | 49,955 | 0.43% |
[ 13.0% - 13.5% ] 13.22% | 77,598 | 0.84% |
[ 13.5% - 14.0% ] 13.64% | 29,544 | 0.058% |
[ 13.5% - 14.0% ] 13.82% | 56,628 | 0.72% |
[ 14.5% - 15.0% ] 14.80% | 110,327 | 0.48% |
[ 21.0% - 21.5% ] 21.01% | 36,151 | 1.3% |
[ 23.0% - 23.5% ] 23.48% | 132,379 | 0.86% |
[ 24.5% - 25.0% ] 24.71% | 37,754 | 1.7% |