Japanese Disability Age Under 5

COMPARE

Japanese
Race
Ancestry
AfghanAfricanAlaska NativeAlaskan AthabascanAlbanianAleutAlsatianAmericanApacheArabArapahoArgentineanArmenianAssyrian/Chaldean/SyriacAustralianAustrianBahamianBangladeshiBarbadianBasqueBelgianBelizeanBermudanBhutaneseBlackfeetBolivianBrazilianBritishBritish West IndianBulgarianBurmeseCajunCambodianCanadianCape VerdeanCarpatho RusynCelticCentral AmericanCentral American IndianCherokeeCheyenneChickasawChileanChineseChippewaChoctawColombianColvilleComancheCosta RicanCreeCreekCroatianCrowCubanCypriotCzechCzechoslovakianDanishDelawareDominicanDutchDutch West IndianEastern EuropeanEcuadorianEgyptianEnglishEstonianEthiopianEuropeanFijianFilipinoFinnishFrenchFrench American IndianFrench CanadianGermanGerman RussianGhanaianGreekGuamanian/ChamorroGuatemalanGuyaneseHaitianHmongHonduranHopiHoumaHungarianIcelanderIndian (Asian)IndonesianInupiatIranianIraqiIrishIroquoisIsraeliItalianJamaicanJapaneseJordanianKenyanKiowaKoreanLaotianLatvianLebaneseLiberianLithuanianLumbeeLuxembourgerMacedonianMalaysianMalteseMarshalleseMenomineeMexicanMexican American IndianMongolianMoroccanNative HawaiianNavajoNepaleseNew ZealanderNicaraguanNigerianNorthern EuropeanNorwegianOkinawanOsageOttawaPaiutePakistaniPalestinianPanamanianParaguayanPennsylvania GermanPeruvianPimaPolishPortuguesePotawatomiPuebloPuerto RicanPuget Sound SalishRomanianRussianSalvadoranSamoanScandinavianScotch-IrishScottishSeminoleSenegaleseSerbianShoshoneSierra LeoneanSiouxSlavicSlovakSloveneSomaliSouth AfricanSouth AmericanSouth American IndianSoviet UnionSpaniardSpanishSpanish AmericanSpanish American IndianSri LankanSubsaharan AfricanSudaneseSwedishSwissSyrianTaiwaneseThaiTlingit-HaidaTohono O'OdhamTonganTrinidadian and TobagonianTsimshianTurkishU.S. Virgin IslanderUgandanUkrainianUruguayanUteVenezuelanVietnameseWelshWest IndianYakamaYaquiYugoslavianYumanYup'ikZimbabwean
Immigration
NonimmigrantsImmigrantsAfghanistanAfricaAlbaniaArgentinaArmeniaAsiaAustraliaAustriaBahamasBangladeshBarbadosBelarusBelgiumBelizeBoliviaBosnia and HerzegovinaBrazilBulgariaBurma/MyanmarCabo VerdeCambodiaCameroonCanadaCaribbeanCentral AmericaChileChinaColombiaCongoCosta RicaCroatiaCubaCzechoslovakiaDenmarkDominicaDominican RepublicEastern AfricaEastern AsiaEastern EuropeEcuadorEgyptEl SalvadorEnglandEritreaEthiopiaEuropeFijiFranceGermanyGhanaGreeceGrenadaGuatemalaGuyanaHaitiHondurasHong KongHungaryIndiaIndonesiaIranIraqIrelandIsraelItalyJamaicaJapanJordanKazakhstanKenyaKoreaKuwaitLaosLatin AmericaLatviaLebanonLiberiaLithuaniaMalaysiaMexicoMicronesiaMiddle AfricaMoldovaMoroccoNepalNetherlandsNicaraguaNigeriaNorth AmericaNorth MacedoniaNorthern AfricaNorthern EuropeNorwayOceaniaPakistanPanamaPeruPhilippinesPolandPortugalRomaniaRussiaSaudi ArabiaScotlandSenegalSerbiaSierra LeoneSingaporeSomaliaSouth AfricaSouth AmericaSouth Central AsiaSouth Eastern AsiaSouthern EuropeSpainSri LankaSt. Vincent and the GrenadinesSudanSwedenSwitzerlandSyriaTaiwanThailandTrinidad and TobagoTurkeyUgandaUkraineUruguayUzbekistanVenezuelaVietnamWest IndiesWestern AfricaWestern AsiaWestern EuropeYemenZaireZimbabweAzores
Select to Compare
Race
Ancestry
AfghanAfricanAlaska NativeAlaskan AthabascanAlbanianAleutAlsatianAmericanApacheArabArapahoArgentineanArmenianAssyrian/Chaldean/SyriacAustralianAustrianBahamianBangladeshiBarbadianBasqueBelgianBelizeanBermudanBhutaneseBlackfeetBolivianBrazilianBritishBritish West IndianBulgarianBurmeseCajunCambodianCanadianCape VerdeanCarpatho RusynCelticCentral AmericanCentral American IndianCherokeeCheyenneChickasawChileanChineseChippewaChoctawColombianColvilleComancheCosta RicanCreeCreekCroatianCrowCubanCypriotCzechCzechoslovakianDanishDelawareDominicanDutchDutch West IndianEastern EuropeanEcuadorianEgyptianEnglishEstonianEthiopianEuropeanFijianFilipinoFinnishFrenchFrench American IndianFrench CanadianGermanGerman RussianGhanaianGreekGuamanian/ChamorroGuatemalanGuyaneseHaitianHmongHonduranHopiHoumaHungarianIcelanderIndian (Asian)IndonesianInupiatIranianIraqiIrishIroquoisIsraeliItalianJamaicanJordanianKenyanKiowaKoreanLaotianLatvianLebaneseLiberianLithuanianLumbeeLuxembourgerMacedonianMalaysianMalteseMarshalleseMenomineeMexicanMexican American IndianMongolianMoroccanNative HawaiianNavajoNepaleseNew ZealanderNicaraguanNigerianNorthern EuropeanNorwegianOkinawanOsageOttawaPaiutePakistaniPalestinianPanamanianParaguayanPennsylvania GermanPeruvianPimaPolishPortuguesePotawatomiPuebloPuerto RicanPuget Sound SalishRomanianRussianSalvadoranSamoanScandinavianScotch-IrishScottishSeminoleSenegaleseSerbianShoshoneSierra LeoneanSiouxSlavicSlovakSloveneSomaliSouth AfricanSouth AmericanSouth American IndianSoviet UnionSpaniardSpanishSpanish AmericanSpanish American IndianSri LankanSubsaharan AfricanSudaneseSwedishSwissSyrianTaiwaneseThaiTlingit-HaidaTohono O'OdhamTonganTrinidadian and TobagonianTsimshianTurkishU.S. Virgin IslanderUgandanUkrainianUruguayanUteVenezuelanVietnameseWelshWest IndianYakamaYaquiYugoslavianYumanYup'ikZimbabwean
Immigration
NonimmigrantsImmigrantsAfghanistanAfricaAlbaniaArgentinaArmeniaAsiaAustraliaAustriaBahamasBangladeshBarbadosBelarusBelgiumBelizeBoliviaBosnia and HerzegovinaBrazilBulgariaBurma/MyanmarCabo VerdeCambodiaCameroonCanadaCaribbeanCentral AmericaChileChinaColombiaCongoCosta RicaCroatiaCubaCzechoslovakiaDenmarkDominicaDominican RepublicEastern AfricaEastern AsiaEastern EuropeEcuadorEgyptEl SalvadorEnglandEritreaEthiopiaEuropeFijiFranceGermanyGhanaGreeceGrenadaGuatemalaGuyanaHaitiHondurasHong KongHungaryIndiaIndonesiaIranIraqIrelandIsraelItalyJamaicaJapanJordanKazakhstanKenyaKoreaKuwaitLaosLatin AmericaLatviaLebanonLiberiaLithuaniaMalaysiaMexicoMicronesiaMiddle AfricaMoldovaMoroccoNepalNetherlandsNicaraguaNigeriaNorth AmericaNorth MacedoniaNorthern AfricaNorthern EuropeNorwayOceaniaPakistanPanamaPeruPhilippinesPolandPortugalRomaniaRussiaSaudi ArabiaScotlandSenegalSerbiaSierra LeoneSingaporeSomaliaSouth AfricaSouth AmericaSouth Central AsiaSouth Eastern AsiaSouthern EuropeSpainSri LankaSt. Vincent and the GrenadinesSudanSwedenSwitzerlandSyriaTaiwanThailandTrinidad and TobagoTurkeyUgandaUkraineUruguayUzbekistanVenezuelaVietnamWest IndiesWestern AfricaWestern AsiaWestern EuropeYemenZaireZimbabweAzores
Disability Age Under 5
Income
Poverty
Unemployment
Labor Participation
Family Structure
Vehicle Availability
Education Level
Disability

Japanese Disability Age Under 5
Exceptional

1.2%
DISABILITY | AGE UNDER 5
90.3/ 100
METRIC RATING
125th/ 347
METRIC RANK

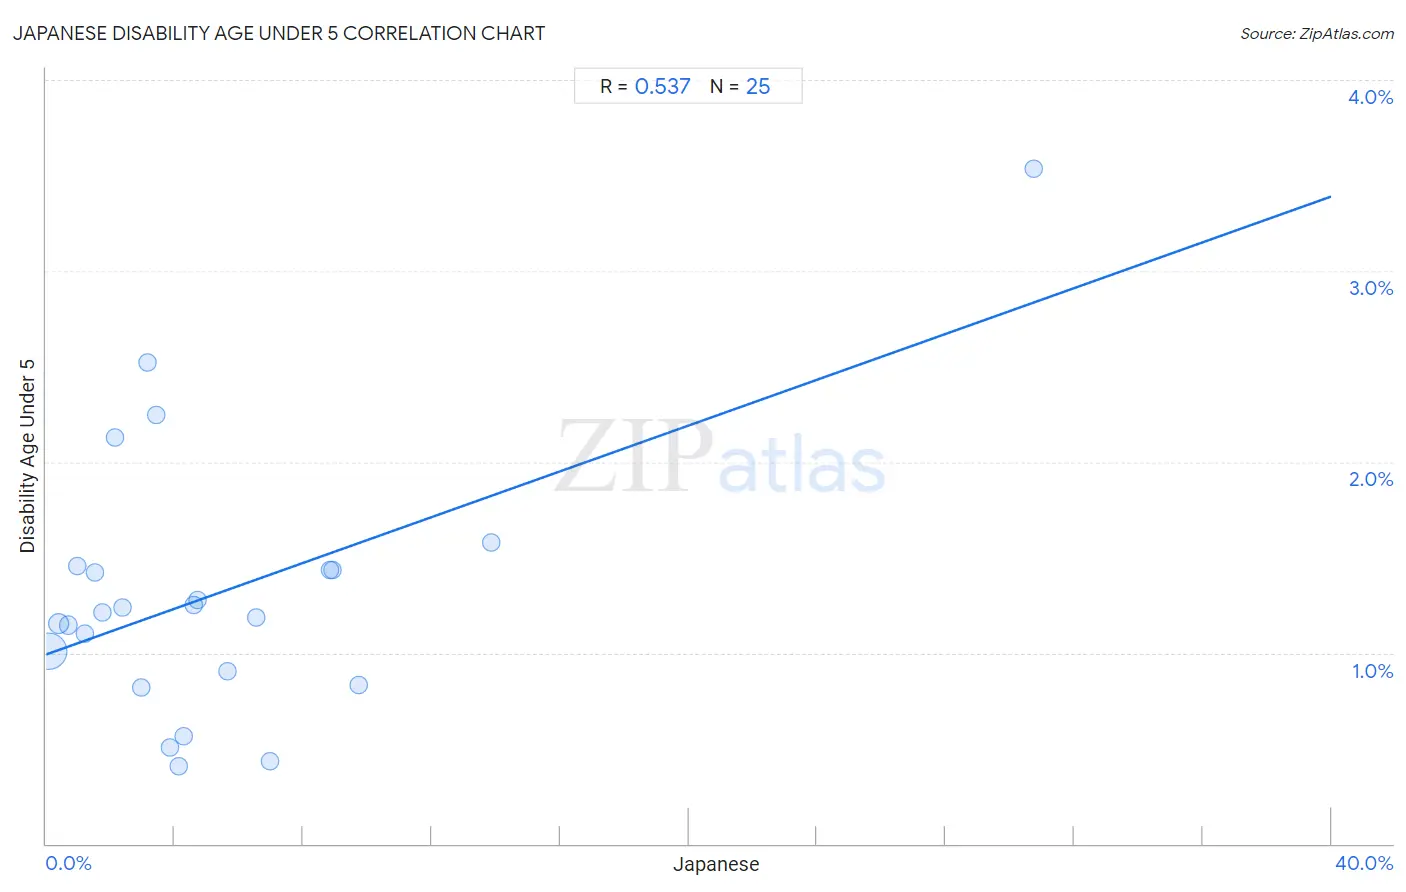
Japanese Disability Age Under 5 Correlation Chart

The statistical analysis conducted on geographies consisting of 161,189,921 people shows a substantial positive correlation between the proportion of Japanese and percentage of population with a disability under the age of 5 in the United States with a correlation coefficient (R) of 0.537 and weighted average of 1.2%. On average, for every 1% (one percent) increase in Japanese within a typical geography, there is an increase of 0.060% in percentage of population with a disability under the age of 5.
Japanese Disability Age Under 5
It is essential to understand that the correlation between the percentage of Japanese and percentage of population with a disability under the age of 5 does not imply a direct cause-and-effect relationship. It remains uncertain whether the presence of Japanese influences an upward or downward trend in the level of percentage of population with a disability under the age of 5 within an area, or if Japanese simply ended up residing in those areas with higher or lower levels of percentage of population with a disability under the age of 5 due to other factors.

Demographics Similar to Japanese by Disability Age Under 5

In terms of disability age under 5, the demographic groups most similar to Japanese are Immigrants from Cambodia (1.2%, a difference of 0.060%), Zimbabwean (1.2%, a difference of 0.080%), Aleut (1.2%, a difference of 0.13%), Central American (1.2%, a difference of 0.16%), and Immigrants from Senegal (1.2%, a difference of 0.32%).
DemographicsRating | RankDisability Age Under 5
Immigrants from Venezuela
93.4
/100
|
#118
Exceptional
1.2%
Bhutanese
92.5
/100
|
#119
Exceptional
1.2%
Immigrants from Eritrea
92.3
/100
|
#120
Exceptional
1.2%
Immigrants from Senegal
91.4
/100
|
#121
Exceptional
1.2%
Aleuts
90.7
/100
|
#122
Exceptional
1.2%
Zimbabweans
90.6
/100
|
#123
Exceptional
1.2%
Immigrants from Cambodia
90.5
/100
|
#124
Exceptional
1.2%
Japanese
90.3
/100
|
#125
Exceptional
1.2%
Central Americans
89.7
/100
|
#126
Excellent
1.2%
Immigrants from Romania
88.4
/100
|
#127
Excellent
1.2%
Immigrants from France
88.4
/100
|
#128
Excellent
1.2%
Immigrants
88.0
/100
|
#129
Excellent
1.2%
Koreans
87.7
/100
|
#130
Excellent
1.2%
Immigrants from Serbia
87.6
/100
|
#131
Excellent
1.2%
Immigrants from Eastern Europe
87.3
/100
|
#132
Excellent
1.2%

Japanese Disability Age Under 5 Correlation Summary

MeasurementJapanese DataDisability Age Under 5 Data
Minimum0.085%0.40%
Maximum30.7%3.5%
Range30.6%3.1%
Mean5.3%1.3%
Median3.8%1.2%
Interquartile 25% (IQ1)1.6%0.87%
Interquartile 75% (IQ3)6.8%1.4%
Interquartile Range (IQR)5.1%0.58%
Standard Deviation (Sample)6.3%0.70%
Standard Deviation (Population)6.1%0.69%

Correlation Details

Japanese PercentileSample SizeDisability Age Under 5
[
0.0%
-
0.5%
]
0.085%
128,022,6511.0%
[
0.0%
-
0.5%
]
0.39%
18,796,5861.2%
[
0.5%
-
1.0%
]
0.69%
6,057,3371.1%
[
0.5%
-
1.0%
]
0.96%
3,057,3661.5%
[
1.0%
-
1.5%
]
1.21%
1,702,0061.1%
[
1.5%
-
2.0%
]
1.53%
565,9641.4%
[
1.5%
-
2.0%
]
1.75%
836,3891.2%
[
2.0%
-
2.5%
]
2.12%
152,4082.1%
[
2.0%
-
2.5%
]
2.38%
145,1691.2%
[
2.5%
-
3.0%
]
2.95%
117,1150.82%
[
3.0%
-
3.5%
]
3.14%
137,1482.5%
[
3.0%
-
3.5%
]
3.42%
113,0672.2%
[
3.5%
-
4.0%
]
3.84%
536,1190.51%
[
4.0%
-
4.5%
]
4.14%
26,5680.40%
[
4.0%
-
4.5%
]
4.29%
420,6830.56%
[
4.5%
-
5.0%
]
4.60%
49,7431.3%
[
4.5%
-
5.0%
]
4.72%
71,3601.3%
[
5.5%
-
6.0%
]
5.64%
96,5150.91%
[
6.5%
-
7.0%
]
6.55%
36,5461.2%
[
6.5%
-
7.0%
]
6.97%
36,0250.44%
[
8.5%
-
9.0%
]
8.85%
11,7641.4%
[
8.5%
-
9.0%
]
8.91%
11,6781.4%
[
9.5%
-
10.0%
]
9.75%
42,6540.83%
[
13.5%
-
14.0%
]
13.86%
114,7371.6%
[
30.5%
-
31.0%
]
30.73%
32,3233.5%