Nepalese Disability Age Under 5

COMPARE

Nepalese
Race
Ancestry
AfghanAfricanAlaska NativeAlaskan AthabascanAlbanianAleutAlsatianAmericanApacheArabArapahoArgentineanArmenianAssyrian/Chaldean/SyriacAustralianAustrianBahamianBangladeshiBarbadianBasqueBelgianBelizeanBermudanBhutaneseBlackfeetBolivianBrazilianBritishBritish West IndianBulgarianBurmeseCajunCambodianCanadianCape VerdeanCarpatho RusynCelticCentral AmericanCentral American IndianCherokeeCheyenneChickasawChileanChineseChippewaChoctawColombianColvilleComancheCosta RicanCreeCreekCroatianCrowCubanCypriotCzechCzechoslovakianDanishDelawareDominicanDutchDutch West IndianEastern EuropeanEcuadorianEgyptianEnglishEstonianEthiopianEuropeanFijianFilipinoFinnishFrenchFrench American IndianFrench CanadianGermanGerman RussianGhanaianGreekGuamanian/ChamorroGuatemalanGuyaneseHaitianHmongHonduranHopiHoumaHungarianIcelanderIndian (Asian)IndonesianInupiatIranianIraqiIrishIroquoisIsraeliItalianJamaicanJapaneseJordanianKenyanKiowaKoreanLaotianLatvianLebaneseLiberianLithuanianLumbeeLuxembourgerMacedonianMalaysianMalteseMarshalleseMenomineeMexicanMexican American IndianMongolianMoroccanNative HawaiianNavajoNepaleseNew ZealanderNicaraguanNigerianNorthern EuropeanNorwegianOkinawanOsageOttawaPaiutePakistaniPalestinianPanamanianParaguayanPennsylvania GermanPeruvianPimaPolishPortuguesePotawatomiPuebloPuerto RicanPuget Sound SalishRomanianRussianSalvadoranSamoanScandinavianScotch-IrishScottishSeminoleSenegaleseSerbianShoshoneSierra LeoneanSiouxSlavicSlovakSloveneSomaliSouth AfricanSouth AmericanSouth American IndianSoviet UnionSpaniardSpanishSpanish AmericanSpanish American IndianSri LankanSubsaharan AfricanSudaneseSwedishSwissSyrianTaiwaneseThaiTlingit-HaidaTohono O'OdhamTonganTrinidadian and TobagonianTsimshianTurkishU.S. Virgin IslanderUgandanUkrainianUruguayanUteVenezuelanVietnameseWelshWest IndianYakamaYaquiYugoslavianYumanYup'ikZimbabwean
Immigration
NonimmigrantsImmigrantsAfghanistanAfricaAlbaniaArgentinaArmeniaAsiaAustraliaAustriaBahamasBangladeshBarbadosBelarusBelgiumBelizeBoliviaBosnia and HerzegovinaBrazilBulgariaBurma/MyanmarCabo VerdeCambodiaCameroonCanadaCaribbeanCentral AmericaChileChinaColombiaCongoCosta RicaCroatiaCubaCzechoslovakiaDenmarkDominicaDominican RepublicEastern AfricaEastern AsiaEastern EuropeEcuadorEgyptEl SalvadorEnglandEritreaEthiopiaEuropeFijiFranceGermanyGhanaGreeceGrenadaGuatemalaGuyanaHaitiHondurasHong KongHungaryIndiaIndonesiaIranIraqIrelandIsraelItalyJamaicaJapanJordanKazakhstanKenyaKoreaKuwaitLaosLatin AmericaLatviaLebanonLiberiaLithuaniaMalaysiaMexicoMicronesiaMiddle AfricaMoldovaMoroccoNepalNetherlandsNicaraguaNigeriaNorth AmericaNorth MacedoniaNorthern AfricaNorthern EuropeNorwayOceaniaPakistanPanamaPeruPhilippinesPolandPortugalRomaniaRussiaSaudi ArabiaScotlandSenegalSerbiaSierra LeoneSingaporeSomaliaSouth AfricaSouth AmericaSouth Central AsiaSouth Eastern AsiaSouthern EuropeSpainSri LankaSt. Vincent and the GrenadinesSudanSwedenSwitzerlandSyriaTaiwanThailandTrinidad and TobagoTurkeyUgandaUkraineUruguayUzbekistanVenezuelaVietnamWest IndiesWestern AfricaWestern AsiaWestern EuropeYemenZaireZimbabweAzores
Select to Compare
Race
Ancestry
AfghanAfricanAlaska NativeAlaskan AthabascanAlbanianAleutAlsatianAmericanApacheArabArapahoArgentineanArmenianAssyrian/Chaldean/SyriacAustralianAustrianBahamianBangladeshiBarbadianBasqueBelgianBelizeanBermudanBhutaneseBlackfeetBolivianBrazilianBritishBritish West IndianBulgarianBurmeseCajunCambodianCanadianCape VerdeanCarpatho RusynCelticCentral AmericanCentral American IndianCherokeeCheyenneChickasawChileanChineseChippewaChoctawColombianColvilleComancheCosta RicanCreeCreekCroatianCrowCubanCypriotCzechCzechoslovakianDanishDelawareDominicanDutchDutch West IndianEastern EuropeanEcuadorianEgyptianEnglishEstonianEthiopianEuropeanFijianFilipinoFinnishFrenchFrench American IndianFrench CanadianGermanGerman RussianGhanaianGreekGuamanian/ChamorroGuatemalanGuyaneseHaitianHmongHonduranHopiHoumaHungarianIcelanderIndian (Asian)IndonesianInupiatIranianIraqiIrishIroquoisIsraeliItalianJamaicanJapaneseJordanianKenyanKiowaKoreanLaotianLatvianLebaneseLiberianLithuanianLumbeeLuxembourgerMacedonianMalaysianMalteseMarshalleseMenomineeMexicanMexican American IndianMongolianMoroccanNative HawaiianNavajoNew ZealanderNicaraguanNigerianNorthern EuropeanNorwegianOkinawanOsageOttawaPaiutePakistaniPalestinianPanamanianParaguayanPennsylvania GermanPeruvianPimaPolishPortuguesePotawatomiPuebloPuerto RicanPuget Sound SalishRomanianRussianSalvadoranSamoanScandinavianScotch-IrishScottishSeminoleSenegaleseSerbianShoshoneSierra LeoneanSiouxSlavicSlovakSloveneSomaliSouth AfricanSouth AmericanSouth American IndianSoviet UnionSpaniardSpanishSpanish AmericanSpanish American IndianSri LankanSubsaharan AfricanSudaneseSwedishSwissSyrianTaiwaneseThaiTlingit-HaidaTohono O'OdhamTonganTrinidadian and TobagonianTsimshianTurkishU.S. Virgin IslanderUgandanUkrainianUruguayanUteVenezuelanVietnameseWelshWest IndianYakamaYaquiYugoslavianYumanYup'ikZimbabwean
Immigration
NonimmigrantsImmigrantsAfghanistanAfricaAlbaniaArgentinaArmeniaAsiaAustraliaAustriaBahamasBangladeshBarbadosBelarusBelgiumBelizeBoliviaBosnia and HerzegovinaBrazilBulgariaBurma/MyanmarCabo VerdeCambodiaCameroonCanadaCaribbeanCentral AmericaChileChinaColombiaCongoCosta RicaCroatiaCubaCzechoslovakiaDenmarkDominicaDominican RepublicEastern AfricaEastern AsiaEastern EuropeEcuadorEgyptEl SalvadorEnglandEritreaEthiopiaEuropeFijiFranceGermanyGhanaGreeceGrenadaGuatemalaGuyanaHaitiHondurasHong KongHungaryIndiaIndonesiaIranIraqIrelandIsraelItalyJamaicaJapanJordanKazakhstanKenyaKoreaKuwaitLaosLatin AmericaLatviaLebanonLiberiaLithuaniaMalaysiaMexicoMicronesiaMiddle AfricaMoldovaMoroccoNepalNetherlandsNicaraguaNigeriaNorth AmericaNorth MacedoniaNorthern AfricaNorthern EuropeNorwayOceaniaPakistanPanamaPeruPhilippinesPolandPortugalRomaniaRussiaSaudi ArabiaScotlandSenegalSerbiaSierra LeoneSingaporeSomaliaSouth AfricaSouth AmericaSouth Central AsiaSouth Eastern AsiaSouthern EuropeSpainSri LankaSt. Vincent and the GrenadinesSudanSwedenSwitzerlandSyriaTaiwanThailandTrinidad and TobagoTurkeyUgandaUkraineUruguayUzbekistanVenezuelaVietnamWest IndiesWestern AfricaWestern AsiaWestern EuropeYemenZaireZimbabweAzores
Disability Age Under 5
Income
Poverty
Unemployment
Labor Participation
Family Structure
Vehicle Availability
Education Level
Disability

Nepalese Disability Age Under 5
Exceptional

0.97%
DISABILITY | AGE UNDER 5
100.0/ 100
METRIC RATING
20th/ 347
METRIC RANK

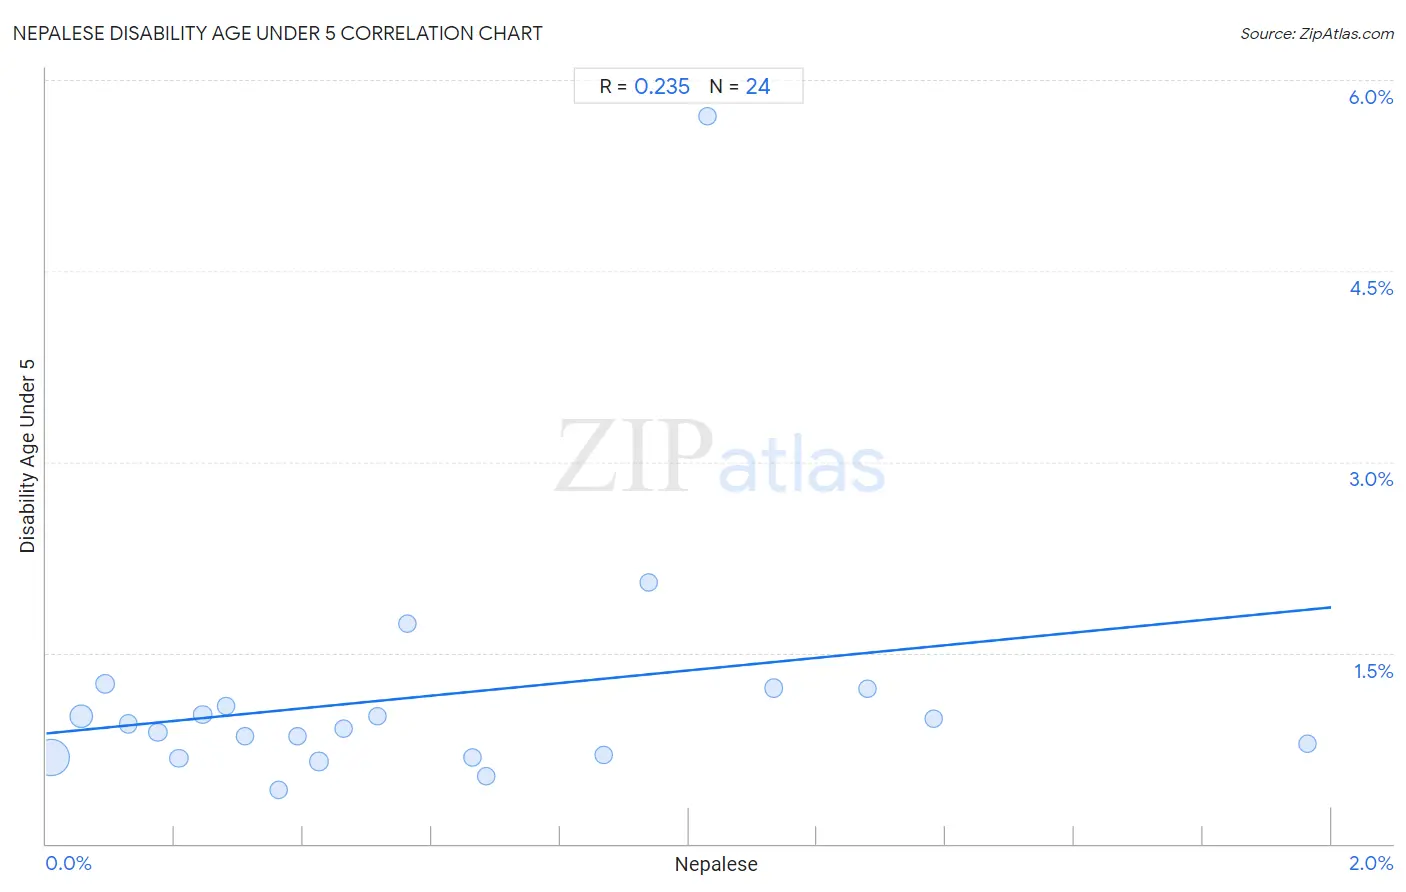
Nepalese Disability Age Under 5 Correlation Chart

The statistical analysis conducted on geographies consisting of 20,092,908 people shows a weak positive correlation between the proportion of Nepalese and percentage of population with a disability under the age of 5 in the United States with a correlation coefficient (R) of 0.235 and weighted average of 0.97%. On average, for every 1% (one percent) increase in Nepalese within a typical geography, there is an increase of 0.50% in percentage of population with a disability under the age of 5.
Nepalese Disability Age Under 5
It is essential to understand that the correlation between the percentage of Nepalese and percentage of population with a disability under the age of 5 does not imply a direct cause-and-effect relationship. It remains uncertain whether the presence of Nepalese influences an upward or downward trend in the level of percentage of population with a disability under the age of 5 within an area, or if Nepalese simply ended up residing in those areas with higher or lower levels of percentage of population with a disability under the age of 5 due to other factors.

Demographics Similar to Nepalese by Disability Age Under 5

In terms of disability age under 5, the demographic groups most similar to Nepalese are Puget Sound Salish (0.97%, a difference of 0.10%), Immigrants from Barbados (0.97%, a difference of 0.47%), Immigrants from China (0.96%, a difference of 1.1%), Immigrants from Israel (0.96%, a difference of 1.5%), and British West Indian (0.99%, a difference of 1.8%).
DemographicsRating | RankDisability Age Under 5
Soviet Union
100.0
/100
|
#13
Exceptional
0.95%
Yuman
100.0
/100
|
#14
Exceptional
0.95%
Immigrants from Hong Kong
100.0
/100
|
#15
Exceptional
0.95%
Immigrants from Israel
100.0
/100
|
#16
Exceptional
0.96%
Immigrants from China
100.0
/100
|
#17
Exceptional
0.96%
Immigrants from Barbados
100.0
/100
|
#18
Exceptional
0.97%
Puget Sound Salish
100.0
/100
|
#19
Exceptional
0.97%
Nepalese
100.0
/100
|
#20
Exceptional
0.97%
British West Indians
100.0
/100
|
#21
Exceptional
0.99%
Immigrants from Iran
100.0
/100
|
#22
Exceptional
1.00%
Yakama
100.0
/100
|
#23
Exceptional
1.00%
Indians (Asian)
100.0
/100
|
#24
Exceptional
1.0%
Immigrants from Micronesia
100.0
/100
|
#25
Exceptional
1.0%
Immigrants from Taiwan
100.0
/100
|
#26
Exceptional
1.0%
Guyanese
100.0
/100
|
#27
Exceptional
1.0%

Nepalese Disability Age Under 5 Correlation Summary

MeasurementNepalese DataDisability Age Under 5 Data
Minimum0.0086%0.43%
Maximum2.0%5.7%
Range2.0%5.3%
Mean0.59%1.2%
Median0.44%0.93%
Interquartile 25% (IQ1)0.22%0.69%
Interquartile 75% (IQ3)0.90%1.2%
Interquartile Range (IQR)0.68%0.46%
Standard Deviation (Sample)0.49%1.0%
Standard Deviation (Population)0.48%1.0%

Correlation Details

Nepalese PercentileSample SizeDisability Age Under 5
[
0.0%
-
0.5%
]
0.0086%
12,149,1360.67%
[
0.0%
-
0.5%
]
0.055%
3,223,7281.00%
[
0.0%
-
0.5%
]
0.091%
694,9661.3%
[
0.0%
-
0.5%
]
0.13%
640,9390.95%
[
0.0%
-
0.5%
]
0.17%
307,2730.87%
[
0.0%
-
0.5%
]
0.21%
635,7660.67%
[
0.0%
-
0.5%
]
0.24%
586,8481.0%
[
0.0%
-
0.5%
]
0.28%
271,8371.1%
[
0.0%
-
0.5%
]
0.31%
52,1930.84%
[
0.0%
-
0.5%
]
0.36%
142,7820.43%
[
0.0%
-
0.5%
]
0.39%
24,8490.84%
[
0.0%
-
0.5%
]
0.42%
523,6000.65%
[
0.0%
-
0.5%
]
0.46%
181,6310.91%
[
0.5%
-
1.0%
]
0.52%
93,3271.0%
[
0.5%
-
1.0%
]
0.56%
151,4161.7%
[
0.5%
-
1.0%
]
0.66%
49,9920.68%
[
0.5%
-
1.0%
]
0.69%
60,8500.53%
[
0.5%
-
1.0%
]
0.87%
47,2910.70%
[
0.5%
-
1.0%
]
0.94%
74,5642.0%
[
1.0%
-
1.5%
]
1.03%
7,5815.7%
[
1.0%
-
1.5%
]
1.13%
41,3111.2%
[
1.0%
-
1.5%
]
1.28%
31,2971.2%
[
1.0%
-
1.5%
]
1.38%
69,1750.98%
[
1.5%
-
2.0%
]
1.96%
30,5560.79%