Lumbee Disability Age Under 5
COMPARE
Lumbee
Select to Compare
Disability Age Under 5
Lumbee Disability Age Under 5
1.3%
DISABILITY | AGE UNDER 5
2.1/ 100
METRIC RATING
242nd/ 347
METRIC RANK
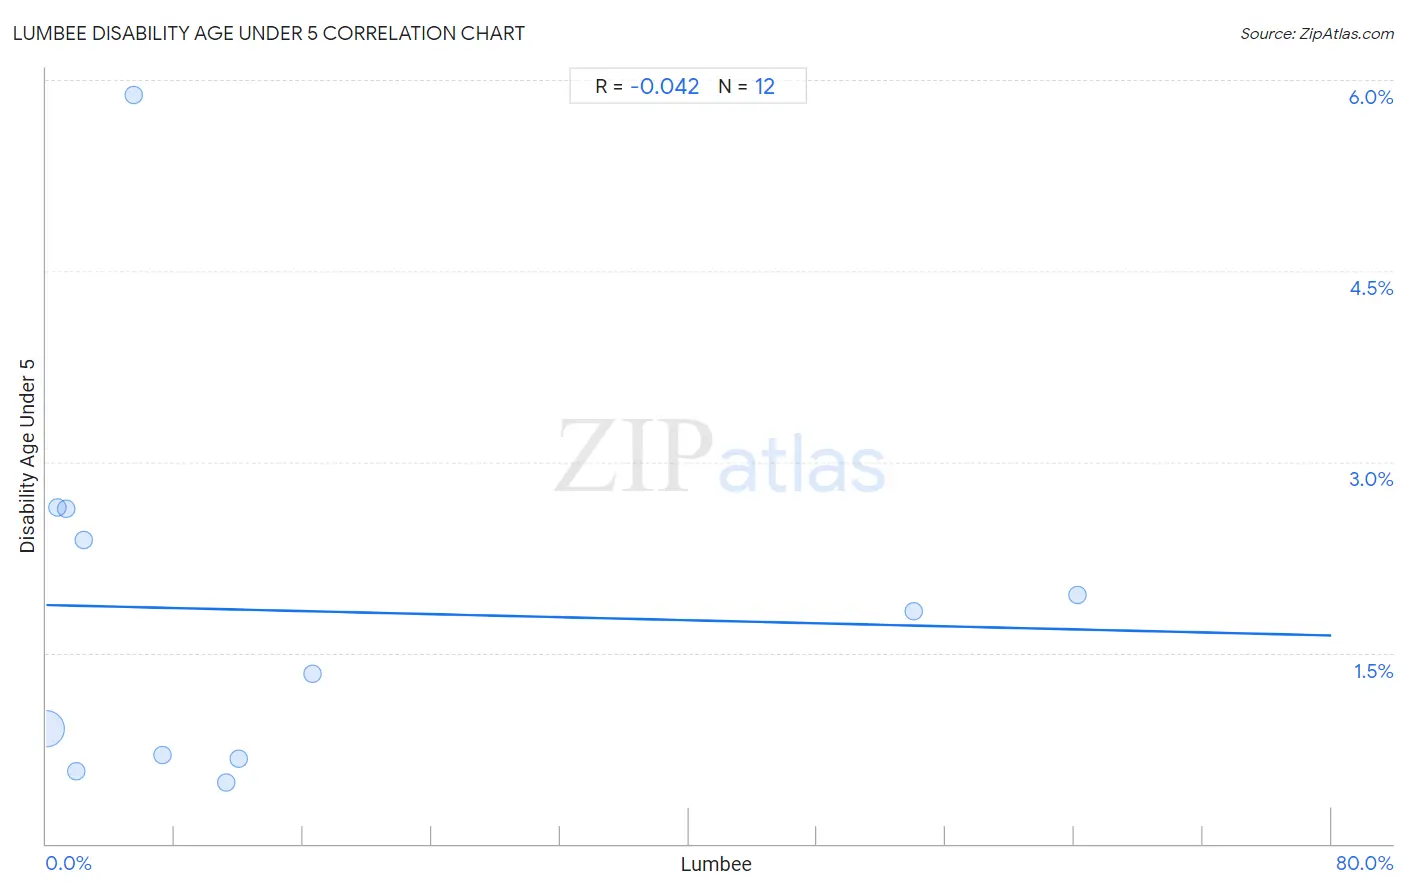
Lumbee Disability Age Under 5 Correlation Chart
The statistical analysis conducted on geographies consisting of 69,814,894 people shows no correlation between the proportion of Lumbee and percentage of population with a disability under the age of 5 in the United States with a correlation coefficient (R) of -0.042 and weighted average of 1.3%. On average, for every 1% (one percent) increase in Lumbee within a typical geography, there is a decrease of 0.0030% in percentage of population with a disability under the age of 5.
It is essential to understand that the correlation between the percentage of Lumbee and percentage of population with a disability under the age of 5 does not imply a direct cause-and-effect relationship. It remains uncertain whether the presence of Lumbee influences an upward or downward trend in the level of percentage of population with a disability under the age of 5 within an area, or if Lumbee simply ended up residing in those areas with higher or lower levels of percentage of population with a disability under the age of 5 due to other factors.
Demographics Similar to Lumbee by Disability Age Under 5
In terms of disability age under 5, the demographic groups most similar to Lumbee are Maltese (1.3%, a difference of 0.080%), Native Hawaiian (1.3%, a difference of 0.15%), Immigrants from Austria (1.3%, a difference of 0.18%), Spanish American Indian (1.3%, a difference of 0.34%), and Immigrants from Cameroon (1.4%, a difference of 0.38%).
| Demographics | Rating | Rank | Disability Age Under 5 |
| Central American Indians | 3.6 /100 | #235 | Tragic 1.3% |
| South American Indians | 3.3 /100 | #236 | Tragic 1.3% |
| Basques | 3.0 /100 | #237 | Tragic 1.3% |
| Spanish American Indians | 2.4 /100 | #238 | Tragic 1.3% |
| Immigrants from Austria | 2.3 /100 | #239 | Tragic 1.3% |
| Native Hawaiians | 2.2 /100 | #240 | Tragic 1.3% |
| Maltese | 2.2 /100 | #241 | Tragic 1.3% |
| Lumbee | 2.1 /100 | #242 | Tragic 1.3% |
| Immigrants from Cameroon | 1.7 /100 | #243 | Tragic 1.4% |
| Spaniards | 1.4 /100 | #244 | Tragic 1.4% |
| Potawatomi | 1.1 /100 | #245 | Tragic 1.4% |
| Russians | 1.0 /100 | #246 | Tragic 1.4% |
| Immigrants from England | 1.0 /100 | #247 | Tragic 1.4% |
| Eastern Europeans | 1.0 /100 | #248 | Tragic 1.4% |
| Bermudans | 1.0 /100 | #249 | Tragic 1.4% |
Lumbee Disability Age Under 5 Correlation Summary
| Measurement | Lumbee Data | Disability Age Under 5 Data |
| Minimum | 0.026% | 0.48% |
| Maximum | 64.2% | 5.9% |
| Range | 64.2% | 5.4% |
| Mean | 14.7% | 1.8% |
| Median | 6.4% | 1.6% |
| Interquartile 25% (IQ1) | 1.6% | 0.69% |
| Interquartile 75% (IQ3) | 14.3% | 2.5% |
| Interquartile Range (IQR) | 12.7% | 1.8% |
| Standard Deviation (Sample) | 21.5% | 1.5% |
| Standard Deviation (Population) | 20.6% | 1.4% |
Correlation Details
| Lumbee Percentile | Sample Size | Disability Age Under 5 |
[ 0.0% - 0.5% ] 0.026% | 69,011,315 | 0.90% |
[ 0.5% - 1.0% ] 0.68% | 481,448 | 2.6% |
[ 1.0% - 1.5% ] 1.28% | 93,164 | 2.6% |
[ 1.5% - 2.0% ] 1.86% | 63,847 | 0.57% |
[ 2.0% - 2.5% ] 2.30% | 53,162 | 2.4% |
[ 5.0% - 5.5% ] 5.48% | 547 | 5.9% |
[ 7.0% - 7.5% ] 7.27% | 14,971 | 0.70% |
[ 11.0% - 11.5% ] 11.21% | 24,403 | 0.48% |
[ 11.5% - 12.0% ] 11.96% | 19,099 | 0.67% |
[ 16.5% - 17.0% ] 16.58% | 34,093 | 1.3% |
[ 54.0% - 54.5% ] 54.01% | 6,499 | 1.8% |
[ 64.0% - 64.5% ] 64.19% | 12,346 | 2.0% |