Immigrants from Eastern Asia Disability Age Under 5
COMPARE
Immigrants from Eastern Asia
Select to Compare
Disability Age Under 5
Immigrants from Eastern Asia Disability Age Under 5
1.0%
DISABILITY | AGE UNDER 5
100.0/ 100
METRIC RATING
28th/ 347
METRIC RANK
Immigrants from Eastern Asia Disability Age Under 5 Correlation Chart
The statistical analysis conducted on geographies consisting of 247,629,306 people shows no correlation between the proportion of Immigrants from Eastern Asia and percentage of population with a disability under the age of 5 in the United States with a correlation coefficient (R) of -0.043 and weighted average of 1.0%. On average, for every 1% (one percent) increase in Immigrants from Eastern Asia within a typical geography, there is a decrease of 0.0029% in percentage of population with a disability under the age of 5.
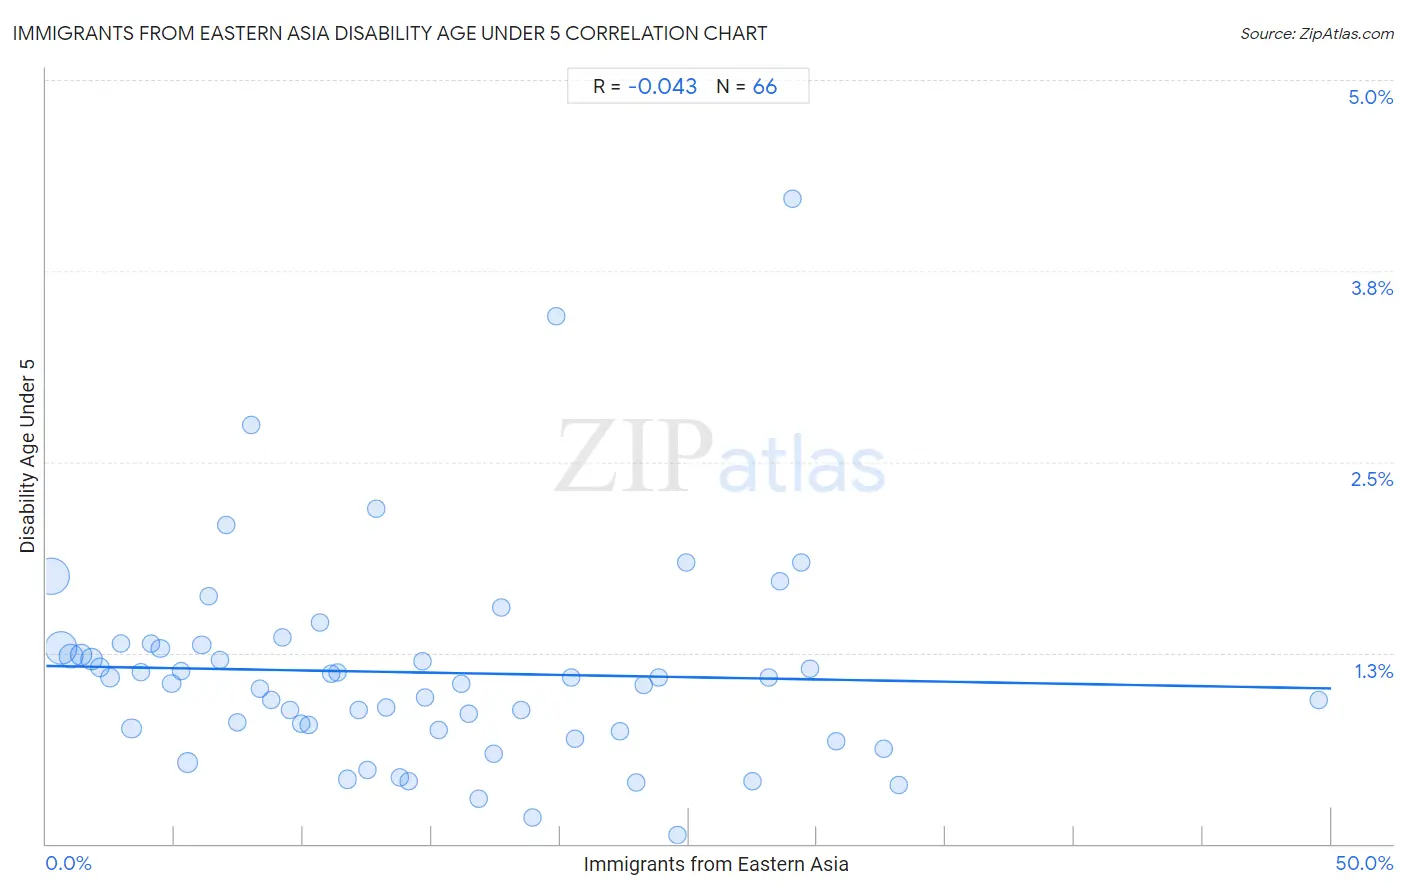
It is essential to understand that the correlation between the percentage of Immigrants from Eastern Asia and percentage of population with a disability under the age of 5 does not imply a direct cause-and-effect relationship. It remains uncertain whether the presence of Immigrants from Eastern Asia influences an upward or downward trend in the level of percentage of population with a disability under the age of 5 within an area, or if Immigrants from Eastern Asia simply ended up residing in those areas with higher or lower levels of percentage of population with a disability under the age of 5 due to other factors.
Demographics Similar to Immigrants from Eastern Asia by Disability Age Under 5
In terms of disability age under 5, the demographic groups most similar to Immigrants from Eastern Asia are Immigrants from Belarus (1.0%, a difference of 0.12%), Guyanese (1.0%, a difference of 0.63%), Immigrants from South Central Asia (1.0%, a difference of 0.65%), Armenian (1.0%, a difference of 0.93%), and Iranian (1.0%, a difference of 0.98%).
| Demographics | Rating | Rank | Disability Age Under 5 |
| British West Indians | 100.0 /100 | #21 | Exceptional 0.99% |
| Immigrants from Iran | 100.0 /100 | #22 | Exceptional 1.00% |
| Yakama | 100.0 /100 | #23 | Exceptional 1.00% |
| Indians (Asian) | 100.0 /100 | #24 | Exceptional 1.0% |
| Immigrants from Micronesia | 100.0 /100 | #25 | Exceptional 1.0% |
| Immigrants from Taiwan | 100.0 /100 | #26 | Exceptional 1.0% |
| Guyanese | 100.0 /100 | #27 | Exceptional 1.0% |
| Immigrants from Eastern Asia | 100.0 /100 | #28 | Exceptional 1.0% |
| Immigrants from Belarus | 100.0 /100 | #29 | Exceptional 1.0% |
| Immigrants from South Central Asia | 99.9 /100 | #30 | Exceptional 1.0% |
| Armenians | 99.9 /100 | #31 | Exceptional 1.0% |
| Iranians | 99.9 /100 | #32 | Exceptional 1.0% |
| Bolivians | 99.9 /100 | #33 | Exceptional 1.0% |
| Immigrants from Ukraine | 99.9 /100 | #34 | Exceptional 1.0% |
| Barbadians | 99.9 /100 | #35 | Exceptional 1.0% |
Immigrants from Eastern Asia Disability Age Under 5 Correlation Summary
| Measurement | Immigrants from Eastern Asia Data | Disability Age Under 5 Data |
| Minimum | 0.20% | 0.058% |
| Maximum | 49.5% | 4.2% |
| Range | 49.3% | 4.2% |
| Mean | 14.4% | 1.1% |
| Median | 12.7% | 1.1% |
| Interquartile 25% (IQ1) | 6.3% | 0.74% |
| Interquartile 75% (IQ3) | 20.6% | 1.3% |
| Interquartile Range (IQR) | 14.2% | 0.54% |
| Standard Deviation (Sample) | 10.1% | 0.69% |
| Standard Deviation (Population) | 10.1% | 0.69% |
Correlation Details
| Immigrants from Eastern Asia Percentile | Sample Size | Disability Age Under 5 |
[ 0.0% - 0.5% ] 0.20% | 78,136,537 | 1.8% |
[ 0.5% - 1.0% ] 0.57% | 59,199,543 | 1.3% |
[ 0.5% - 1.0% ] 0.96% | 27,457,448 | 1.2% |
[ 1.0% - 1.5% ] 1.35% | 16,944,954 | 1.2% |
[ 1.5% - 2.0% ] 1.76% | 12,959,404 | 1.2% |
[ 2.0% - 2.5% ] 2.07% | 6,493,721 | 1.2% |
[ 2.0% - 2.5% ] 2.48% | 4,421,323 | 1.1% |
[ 2.5% - 3.0% ] 2.90% | 2,369,425 | 1.3% |
[ 3.0% - 3.5% ] 3.32% | 7,531,126 | 0.75% |
[ 3.5% - 4.0% ] 3.69% | 3,032,889 | 1.1% |
[ 4.0% - 4.5% ] 4.07% | 1,390,405 | 1.3% |
[ 4.0% - 4.5% ] 4.45% | 2,510,219 | 1.3% |
[ 4.5% - 5.0% ] 4.87% | 1,981,890 | 1.0% |
[ 5.0% - 5.5% ] 5.24% | 1,380,527 | 1.1% |
[ 5.0% - 5.5% ] 5.49% | 9,641,920 | 0.53% |
[ 6.0% - 6.5% ] 6.06% | 965,993 | 1.3% |
[ 6.0% - 6.5% ] 6.31% | 558,306 | 1.6% |
[ 6.5% - 7.0% ] 6.74% | 497,920 | 1.2% |
[ 7.0% - 7.5% ] 7.03% | 107,301 | 2.1% |
[ 7.0% - 7.5% ] 7.42% | 1,278,557 | 0.79% |
[ 7.5% - 8.0% ] 7.99% | 370,385 | 2.7% |
[ 8.0% - 8.5% ] 8.30% | 330,614 | 1.0% |
[ 8.5% - 9.0% ] 8.75% | 540,521 | 0.94% |
[ 9.0% - 9.5% ] 9.18% | 616,636 | 1.3% |
[ 9.0% - 9.5% ] 9.47% | 274,776 | 0.87% |
[ 9.5% - 10.0% ] 9.91% | 525,799 | 0.78% |
[ 10.0% - 10.5% ] 10.20% | 652,084 | 0.78% |
[ 10.5% - 11.0% ] 10.65% | 55,695 | 1.5% |
[ 11.0% - 11.5% ] 11.10% | 141,548 | 1.1% |
[ 11.0% - 11.5% ] 11.34% | 189,630 | 1.1% |
[ 11.5% - 12.0% ] 11.73% | 431,172 | 0.42% |
[ 12.0% - 12.5% ] 12.17% | 324,570 | 0.88% |
[ 12.0% - 12.5% ] 12.49% | 492,032 | 0.48% |
[ 12.5% - 13.0% ] 12.85% | 10,846 | 2.2% |
[ 13.0% - 13.5% ] 13.22% | 153,774 | 0.89% |
[ 13.5% - 14.0% ] 13.75% | 980,917 | 0.44% |
[ 14.0% - 14.5% ] 14.12% | 461,667 | 0.41% |
[ 14.5% - 15.0% ] 14.64% | 95,366 | 1.2% |
[ 14.5% - 15.0% ] 14.74% | 27,785 | 0.95% |
[ 15.0% - 15.5% ] 15.29% | 190,724 | 0.74% |
[ 16.0% - 16.5% ] 16.17% | 60,499 | 1.0% |
[ 16.0% - 16.5% ] 16.42% | 76,508 | 0.85% |
[ 16.5% - 17.0% ] 16.83% | 304,527 | 0.30% |
[ 17.0% - 17.5% ] 17.40% | 140,028 | 0.59% |
[ 17.5% - 18.0% ] 17.68% | 52,799 | 1.5% |
[ 18.0% - 18.5% ] 18.47% | 44,196 | 0.88% |
[ 18.5% - 19.0% ] 18.91% | 59,386 | 0.17% |
[ 19.5% - 20.0% ] 19.83% | 14,281 | 3.5% |
[ 20.0% - 20.5% ] 20.41% | 93,243 | 1.1% |
[ 20.5% - 21.0% ] 20.55% | 55,461 | 0.69% |
[ 22.0% - 22.5% ] 22.31% | 90,420 | 0.73% |
[ 22.5% - 23.0% ] 22.97% | 59,763 | 0.40% |
[ 23.0% - 23.5% ] 23.27% | 82,295 | 1.0% |
[ 23.5% - 24.0% ] 23.83% | 99,744 | 1.1% |
[ 24.5% - 25.0% ] 24.58% | 29,544 | 0.058% |
[ 24.5% - 25.0% ] 24.91% | 38,124 | 1.8% |
[ 27.0% - 27.5% ] 27.49% | 79,580 | 0.41% |
[ 28.0% - 28.5% ] 28.13% | 33,937 | 1.1% |
[ 28.5% - 29.0% ] 28.57% | 68,923 | 1.7% |
[ 29.0% - 29.5% ] 29.02% | 74,987 | 4.2% |
[ 29.0% - 29.5% ] 29.38% | 44,582 | 1.8% |
[ 29.5% - 30.0% ] 29.70% | 28,212 | 1.1% |
[ 30.5% - 31.0% ] 30.72% | 41,377 | 0.67% |
[ 32.5% - 33.0% ] 32.57% | 60,386 | 0.62% |
[ 33.0% - 33.5% ] 33.18% | 91,060 | 0.38% |
[ 49.0% - 49.5% ] 49.50% | 79,495 | 0.94% |