Malaysian Disability Age Under 5

COMPARE

Malaysian
Race
Ancestry
AfghanAfricanAlaska NativeAlaskan AthabascanAlbanianAleutAlsatianAmericanApacheArabArapahoArgentineanArmenianAssyrian/Chaldean/SyriacAustralianAustrianBahamianBangladeshiBarbadianBasqueBelgianBelizeanBermudanBhutaneseBlackfeetBolivianBrazilianBritishBritish West IndianBulgarianBurmeseCajunCambodianCanadianCape VerdeanCarpatho RusynCelticCentral AmericanCentral American IndianCherokeeCheyenneChickasawChileanChineseChippewaChoctawColombianColvilleComancheCosta RicanCreeCreekCroatianCrowCubanCypriotCzechCzechoslovakianDanishDelawareDominicanDutchDutch West IndianEastern EuropeanEcuadorianEgyptianEnglishEstonianEthiopianEuropeanFijianFilipinoFinnishFrenchFrench American IndianFrench CanadianGermanGerman RussianGhanaianGreekGuamanian/ChamorroGuatemalanGuyaneseHaitianHmongHonduranHopiHoumaHungarianIcelanderIndian (Asian)IndonesianInupiatIranianIraqiIrishIroquoisIsraeliItalianJamaicanJapaneseJordanianKenyanKiowaKoreanLaotianLatvianLebaneseLiberianLithuanianLumbeeLuxembourgerMacedonianMalaysianMalteseMarshalleseMenomineeMexicanMexican American IndianMongolianMoroccanNative HawaiianNavajoNepaleseNew ZealanderNicaraguanNigerianNorthern EuropeanNorwegianOkinawanOsageOttawaPaiutePakistaniPalestinianPanamanianParaguayanPennsylvania GermanPeruvianPimaPolishPortuguesePotawatomiPuebloPuerto RicanPuget Sound SalishRomanianRussianSalvadoranSamoanScandinavianScotch-IrishScottishSeminoleSenegaleseSerbianShoshoneSierra LeoneanSiouxSlavicSlovakSloveneSomaliSouth AfricanSouth AmericanSouth American IndianSoviet UnionSpaniardSpanishSpanish AmericanSpanish American IndianSri LankanSubsaharan AfricanSudaneseSwedishSwissSyrianTaiwaneseThaiTlingit-HaidaTohono O'OdhamTonganTrinidadian and TobagonianTsimshianTurkishU.S. Virgin IslanderUgandanUkrainianUruguayanUteVenezuelanVietnameseWelshWest IndianYakamaYaquiYugoslavianYumanYup'ikZimbabwean
Immigration
NonimmigrantsImmigrantsAfghanistanAfricaAlbaniaArgentinaArmeniaAsiaAustraliaAustriaBahamasBangladeshBarbadosBelarusBelgiumBelizeBoliviaBosnia and HerzegovinaBrazilBulgariaBurma/MyanmarCabo VerdeCambodiaCameroonCanadaCaribbeanCentral AmericaChileChinaColombiaCongoCosta RicaCroatiaCubaCzechoslovakiaDenmarkDominicaDominican RepublicEastern AfricaEastern AsiaEastern EuropeEcuadorEgyptEl SalvadorEnglandEritreaEthiopiaEuropeFijiFranceGermanyGhanaGreeceGrenadaGuatemalaGuyanaHaitiHondurasHong KongHungaryIndiaIndonesiaIranIraqIrelandIsraelItalyJamaicaJapanJordanKazakhstanKenyaKoreaKuwaitLaosLatin AmericaLatviaLebanonLiberiaLithuaniaMalaysiaMexicoMicronesiaMiddle AfricaMoldovaMoroccoNepalNetherlandsNicaraguaNigeriaNorth AmericaNorth MacedoniaNorthern AfricaNorthern EuropeNorwayOceaniaPakistanPanamaPeruPhilippinesPolandPortugalRomaniaRussiaSaudi ArabiaScotlandSenegalSerbiaSierra LeoneSingaporeSomaliaSouth AfricaSouth AmericaSouth Central AsiaSouth Eastern AsiaSouthern EuropeSpainSri LankaSt. Vincent and the GrenadinesSudanSwedenSwitzerlandSyriaTaiwanThailandTrinidad and TobagoTurkeyUgandaUkraineUruguayUzbekistanVenezuelaVietnamWest IndiesWestern AfricaWestern AsiaWestern EuropeYemenZaireZimbabweAzores
Select to Compare
Race
Ancestry
AfghanAfricanAlaska NativeAlaskan AthabascanAlbanianAleutAlsatianAmericanApacheArabArapahoArgentineanArmenianAssyrian/Chaldean/SyriacAustralianAustrianBahamianBangladeshiBarbadianBasqueBelgianBelizeanBermudanBhutaneseBlackfeetBolivianBrazilianBritishBritish West IndianBulgarianBurmeseCajunCambodianCanadianCape VerdeanCarpatho RusynCelticCentral AmericanCentral American IndianCherokeeCheyenneChickasawChileanChineseChippewaChoctawColombianColvilleComancheCosta RicanCreeCreekCroatianCrowCubanCypriotCzechCzechoslovakianDanishDelawareDominicanDutchDutch West IndianEastern EuropeanEcuadorianEgyptianEnglishEstonianEthiopianEuropeanFijianFilipinoFinnishFrenchFrench American IndianFrench CanadianGermanGerman RussianGhanaianGreekGuamanian/ChamorroGuatemalanGuyaneseHaitianHmongHonduranHopiHoumaHungarianIcelanderIndian (Asian)IndonesianInupiatIranianIraqiIrishIroquoisIsraeliItalianJamaicanJapaneseJordanianKenyanKiowaKoreanLaotianLatvianLebaneseLiberianLithuanianLumbeeLuxembourgerMacedonianMalteseMarshalleseMenomineeMexicanMexican American IndianMongolianMoroccanNative HawaiianNavajoNepaleseNew ZealanderNicaraguanNigerianNorthern EuropeanNorwegianOkinawanOsageOttawaPaiutePakistaniPalestinianPanamanianParaguayanPennsylvania GermanPeruvianPimaPolishPortuguesePotawatomiPuebloPuerto RicanPuget Sound SalishRomanianRussianSalvadoranSamoanScandinavianScotch-IrishScottishSeminoleSenegaleseSerbianShoshoneSierra LeoneanSiouxSlavicSlovakSloveneSomaliSouth AfricanSouth AmericanSouth American IndianSoviet UnionSpaniardSpanishSpanish AmericanSpanish American IndianSri LankanSubsaharan AfricanSudaneseSwedishSwissSyrianTaiwaneseThaiTlingit-HaidaTohono O'OdhamTonganTrinidadian and TobagonianTsimshianTurkishU.S. Virgin IslanderUgandanUkrainianUruguayanUteVenezuelanVietnameseWelshWest IndianYakamaYaquiYugoslavianYumanYup'ikZimbabwean
Immigration
NonimmigrantsImmigrantsAfghanistanAfricaAlbaniaArgentinaArmeniaAsiaAustraliaAustriaBahamasBangladeshBarbadosBelarusBelgiumBelizeBoliviaBosnia and HerzegovinaBrazilBulgariaBurma/MyanmarCabo VerdeCambodiaCameroonCanadaCaribbeanCentral AmericaChileChinaColombiaCongoCosta RicaCroatiaCubaCzechoslovakiaDenmarkDominicaDominican RepublicEastern AfricaEastern AsiaEastern EuropeEcuadorEgyptEl SalvadorEnglandEritreaEthiopiaEuropeFijiFranceGermanyGhanaGreeceGrenadaGuatemalaGuyanaHaitiHondurasHong KongHungaryIndiaIndonesiaIranIraqIrelandIsraelItalyJamaicaJapanJordanKazakhstanKenyaKoreaKuwaitLaosLatin AmericaLatviaLebanonLiberiaLithuaniaMalaysiaMexicoMicronesiaMiddle AfricaMoldovaMoroccoNepalNetherlandsNicaraguaNigeriaNorth AmericaNorth MacedoniaNorthern AfricaNorthern EuropeNorwayOceaniaPakistanPanamaPeruPhilippinesPolandPortugalRomaniaRussiaSaudi ArabiaScotlandSenegalSerbiaSierra LeoneSingaporeSomaliaSouth AfricaSouth AmericaSouth Central AsiaSouth Eastern AsiaSouthern EuropeSpainSri LankaSt. Vincent and the GrenadinesSudanSwedenSwitzerlandSyriaTaiwanThailandTrinidad and TobagoTurkeyUgandaUkraineUruguayUzbekistanVenezuelaVietnamWest IndiesWestern AfricaWestern AsiaWestern EuropeYemenZaireZimbabweAzores
Disability Age Under 5
Income
Poverty
Unemployment
Labor Participation
Family Structure
Vehicle Availability
Education Level
Disability

Malaysian Disability Age Under 5
Poor

1.3%
DISABILITY | AGE UNDER 5
13.2/ 100
METRIC RATING
218th/ 347
METRIC RANK

Malaysian Disability Age Under 5 Correlation Chart

The statistical analysis conducted on geographies consisting of 149,792,432 people shows a strong positive correlation between the proportion of Malaysians and percentage of population with a disability under the age of 5 in the United States with a correlation coefficient (R) of 0.800 and weighted average of 1.3%. On average, for every 1% (one percent) increase in Malaysians within a typical geography, there is an increase of 0.84% in percentage of population with a disability under the age of 5.
Malaysian Disability Age Under 5
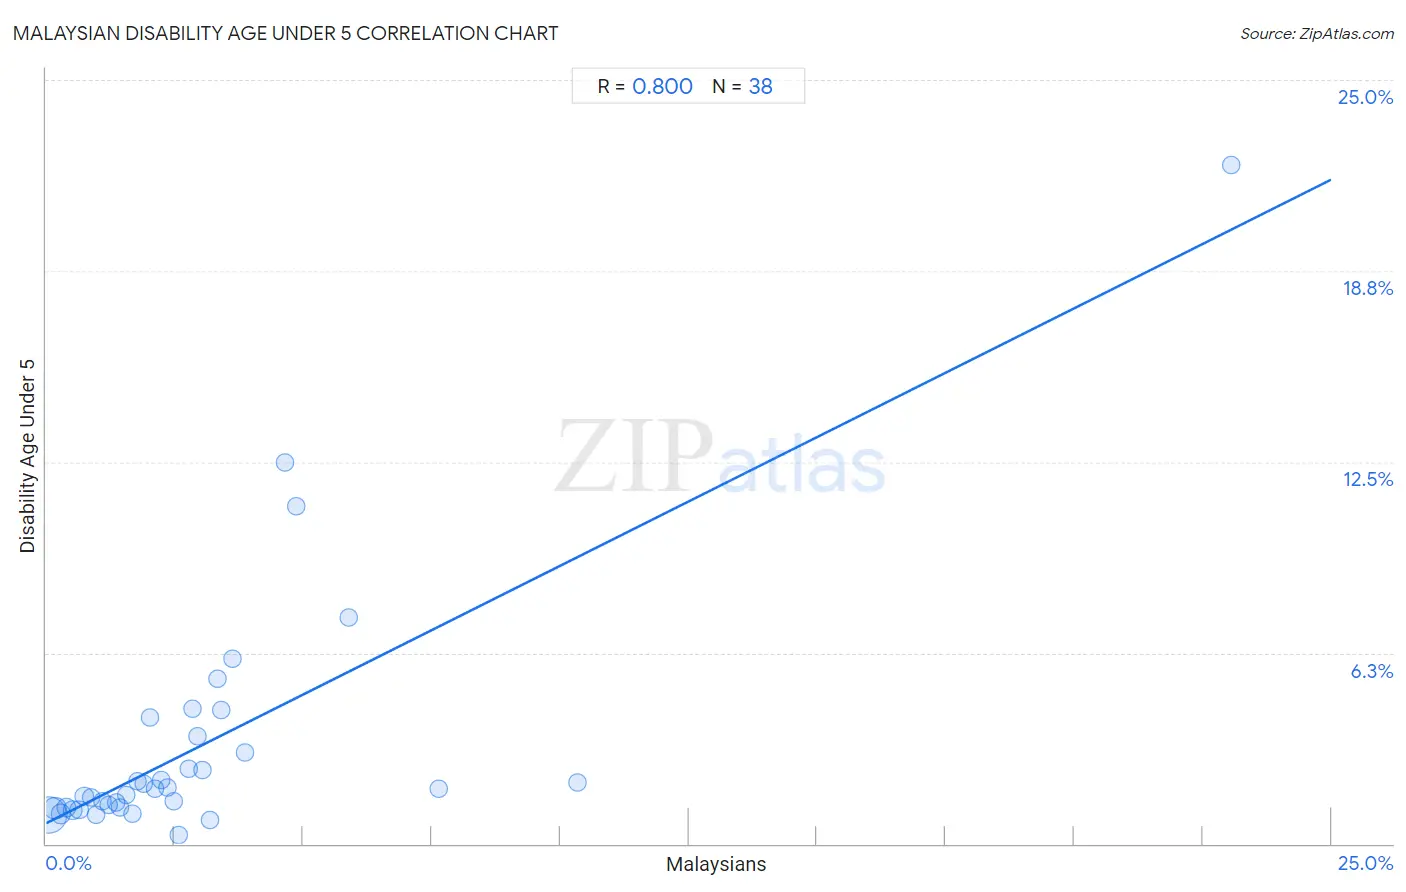
It is essential to understand that the correlation between the percentage of Malaysians and percentage of population with a disability under the age of 5 does not imply a direct cause-and-effect relationship. It remains uncertain whether the presence of Malaysians influences an upward or downward trend in the level of percentage of population with a disability under the age of 5 within an area, or if Malaysians simply ended up residing in those areas with higher or lower levels of percentage of population with a disability under the age of 5 due to other factors.

Demographics Similar to Malaysians by Disability Age Under 5

In terms of disability age under 5, the demographic groups most similar to Malaysians are Cypriot (1.3%, a difference of 0.31%), Immigrants from Croatia (1.3%, a difference of 0.40%), Bangladeshi (1.3%, a difference of 0.41%), Syrian (1.3%, a difference of 0.51%), and Immigrants from Chile (1.3%, a difference of 0.68%).
DemographicsRating | RankDisability Age Under 5
Immigrants from Greece
19.1
/100
|
#211
Poor
1.3%
Chileans
18.8
/100
|
#212
Poor
1.3%
Immigrants from Sudan
18.7
/100
|
#213
Poor
1.3%
Immigrants from Chile
17.2
/100
|
#214
Poor
1.3%
Syrians
16.1
/100
|
#215
Poor
1.3%
Bangladeshis
15.5
/100
|
#216
Poor
1.3%
Cypriots
14.9
/100
|
#217
Poor
1.3%
Malaysians
13.2
/100
|
#218
Poor
1.3%
Immigrants from Croatia
11.2
/100
|
#219
Poor
1.3%
Serbians
9.6
/100
|
#220
Tragic
1.3%
Sub-Saharan Africans
8.3
/100
|
#221
Tragic
1.3%
Ukrainians
8.3
/100
|
#222
Tragic
1.3%
Hispanics or Latinos
7.7
/100
|
#223
Tragic
1.3%
Latvians
7.1
/100
|
#224
Tragic
1.3%
Panamanians
7.1
/100
|
#225
Tragic
1.3%

Malaysian Disability Age Under 5 Correlation Summary

MeasurementMalaysian DataDisability Age Under 5 Data
Minimum0.042%0.28%
Maximum23.0%22.2%
Range23.0%21.9%
Mean3.0%3.2%
Median2.2%1.8%
Interquartile 25% (IQ1)1.1%1.2%
Interquartile 75% (IQ3)3.3%3.5%
Interquartile Range (IQR)2.2%2.3%
Standard Deviation (Sample)3.9%4.1%
Standard Deviation (Population)3.9%4.1%

Correlation Details

Malaysian PercentileSample SizeDisability Age Under 5
[
0.0%
-
0.5%
]
0.042%
94,753,9130.95%
[
0.0%
-
0.5%
]
0.17%
24,575,2991.2%
[
0.0%
-
0.5%
]
0.29%
10,895,9100.97%
[
0.0%
-
0.5%
]
0.40%
5,232,7161.2%
[
0.5%
-
1.0%
]
0.52%
4,317,7731.1%
[
0.5%
-
1.0%
]
0.64%
1,915,5261.1%
[
0.5%
-
1.0%
]
0.74%
1,227,4711.6%
[
0.5%
-
1.0%
]
0.86%
955,4711.5%
[
0.5%
-
1.0%
]
0.96%
1,784,0470.95%
[
1.0%
-
1.5%
]
1.09%
419,1461.4%
[
1.0%
-
1.5%
]
1.22%
992,9911.3%
[
1.0%
-
1.5%
]
1.35%
465,1211.4%
[
1.0%
-
1.5%
]
1.44%
255,1421.2%
[
1.5%
-
2.0%
]
1.55%
273,2501.6%
[
1.5%
-
2.0%
]
1.67%
546,6720.98%
[
1.5%
-
2.0%
]
1.77%
171,1462.0%
[
1.5%
-
2.0%
]
1.90%
107,3942.0%
[
2.0%
-
2.5%
]
2.03%
47,2554.1%
[
2.0%
-
2.5%
]
2.12%
103,4101.8%
[
2.0%
-
2.5%
]
2.23%
32,1882.1%
[
2.0%
-
2.5%
]
2.36%
143,4541.8%
[
2.0%
-
2.5%
]
2.48%
96,9971.4%
[
2.5%
-
3.0%
]
2.57%
86,1920.28%
[
2.5%
-
3.0%
]
2.76%
1,3752.4%
[
2.5%
-
3.0%
]
2.85%
74,0214.4%
[
2.5%
-
3.0%
]
2.94%
184,4213.5%
[
3.0%
-
3.5%
]
3.03%
67,6202.4%
[
3.0%
-
3.5%
]
3.20%
2,8780.80%
[
3.0%
-
3.5%
]
3.33%
11,7265.4%
[
3.0%
-
3.5%
]
3.42%
2,4894.4%
[
3.5%
-
4.0%
]
3.63%
3,2206.1%
[
3.5%
-
4.0%
]
3.87%
10,9233.0%
[
4.5%
-
5.0%
]
4.64%
2,84512.5%
[
4.5%
-
5.0%
]
4.86%
5,20211.0%
[
5.5%
-
6.0%
]
5.88%
3,2647.4%
[
7.5%
-
8.0%
]
7.63%
22,5391.8%
[
10.0%
-
10.5%
]
10.34%
8612.0%
[
23.0%
-
23.5%
]
23.05%
56422.2%