Immigrants from Cuba Disability Age Under 5

COMPARE

Immigrants from Cuba
Race
Ancestry
AfghanAfricanAlaska NativeAlaskan AthabascanAlbanianAleutAlsatianAmericanApacheArabArapahoArgentineanArmenianAssyrian/Chaldean/SyriacAustralianAustrianBahamianBangladeshiBarbadianBasqueBelgianBelizeanBermudanBhutaneseBlackfeetBolivianBrazilianBritishBritish West IndianBulgarianBurmeseCajunCambodianCanadianCape VerdeanCarpatho RusynCelticCentral AmericanCentral American IndianCherokeeCheyenneChickasawChileanChineseChippewaChoctawColombianColvilleComancheCosta RicanCreeCreekCroatianCrowCubanCypriotCzechCzechoslovakianDanishDelawareDominicanDutchDutch West IndianEastern EuropeanEcuadorianEgyptianEnglishEstonianEthiopianEuropeanFijianFilipinoFinnishFrenchFrench American IndianFrench CanadianGermanGerman RussianGhanaianGreekGuamanian/ChamorroGuatemalanGuyaneseHaitianHmongHonduranHopiHoumaHungarianIcelanderIndian (Asian)IndonesianInupiatIranianIraqiIrishIroquoisIsraeliItalianJamaicanJapaneseJordanianKenyanKiowaKoreanLaotianLatvianLebaneseLiberianLithuanianLumbeeLuxembourgerMacedonianMalaysianMalteseMarshalleseMenomineeMexicanMexican American IndianMongolianMoroccanNative HawaiianNavajoNepaleseNew ZealanderNicaraguanNigerianNorthern EuropeanNorwegianOkinawanOsageOttawaPaiutePakistaniPalestinianPanamanianParaguayanPennsylvania GermanPeruvianPimaPolishPortuguesePotawatomiPuebloPuerto RicanPuget Sound SalishRomanianRussianSalvadoranSamoanScandinavianScotch-IrishScottishSeminoleSenegaleseSerbianShoshoneSierra LeoneanSiouxSlavicSlovakSloveneSomaliSouth AfricanSouth AmericanSouth American IndianSoviet UnionSpaniardSpanishSpanish AmericanSpanish American IndianSri LankanSubsaharan AfricanSudaneseSwedishSwissSyrianTaiwaneseThaiTlingit-HaidaTohono O'OdhamTonganTrinidadian and TobagonianTsimshianTurkishU.S. Virgin IslanderUgandanUkrainianUruguayanUteVenezuelanVietnameseWelshWest IndianYakamaYaquiYugoslavianYumanYup'ikZimbabwean
Immigration
NonimmigrantsImmigrantsAfghanistanAfricaAlbaniaArgentinaArmeniaAsiaAustraliaAustriaBahamasBangladeshBarbadosBelarusBelgiumBelizeBoliviaBosnia and HerzegovinaBrazilBulgariaBurma/MyanmarCabo VerdeCambodiaCameroonCanadaCaribbeanCentral AmericaChileChinaColombiaCongoCosta RicaCroatiaCubaCzechoslovakiaDenmarkDominicaDominican RepublicEastern AfricaEastern AsiaEastern EuropeEcuadorEgyptEl SalvadorEnglandEritreaEthiopiaEuropeFijiFranceGermanyGhanaGreeceGrenadaGuatemalaGuyanaHaitiHondurasHong KongHungaryIndiaIndonesiaIranIraqIrelandIsraelItalyJamaicaJapanJordanKazakhstanKenyaKoreaKuwaitLaosLatin AmericaLatviaLebanonLiberiaLithuaniaMalaysiaMexicoMicronesiaMiddle AfricaMoldovaMoroccoNepalNetherlandsNicaraguaNigeriaNorth AmericaNorth MacedoniaNorthern AfricaNorthern EuropeNorwayOceaniaPakistanPanamaPeruPhilippinesPolandPortugalRomaniaRussiaSaudi ArabiaScotlandSenegalSerbiaSierra LeoneSingaporeSomaliaSouth AfricaSouth AmericaSouth Central AsiaSouth Eastern AsiaSouthern EuropeSpainSri LankaSt. Vincent and the GrenadinesSudanSwedenSwitzerlandSyriaTaiwanThailandTrinidad and TobagoTurkeyUgandaUkraineUruguayUzbekistanVenezuelaVietnamWest IndiesWestern AfricaWestern AsiaWestern EuropeYemenZaireZimbabweAzores
Select to Compare
Race
Ancestry
AfghanAfricanAlaska NativeAlaskan AthabascanAlbanianAleutAlsatianAmericanApacheArabArapahoArgentineanArmenianAssyrian/Chaldean/SyriacAustralianAustrianBahamianBangladeshiBarbadianBasqueBelgianBelizeanBermudanBhutaneseBlackfeetBolivianBrazilianBritishBritish West IndianBulgarianBurmeseCajunCambodianCanadianCape VerdeanCarpatho RusynCelticCentral AmericanCentral American IndianCherokeeCheyenneChickasawChileanChineseChippewaChoctawColombianColvilleComancheCosta RicanCreeCreekCroatianCrowCubanCypriotCzechCzechoslovakianDanishDelawareDominicanDutchDutch West IndianEastern EuropeanEcuadorianEgyptianEnglishEstonianEthiopianEuropeanFijianFilipinoFinnishFrenchFrench American IndianFrench CanadianGermanGerman RussianGhanaianGreekGuamanian/ChamorroGuatemalanGuyaneseHaitianHmongHonduranHopiHoumaHungarianIcelanderIndian (Asian)IndonesianInupiatIranianIraqiIrishIroquoisIsraeliItalianJamaicanJapaneseJordanianKenyanKiowaKoreanLaotianLatvianLebaneseLiberianLithuanianLumbeeLuxembourgerMacedonianMalaysianMalteseMarshalleseMenomineeMexicanMexican American IndianMongolianMoroccanNative HawaiianNavajoNepaleseNew ZealanderNicaraguanNigerianNorthern EuropeanNorwegianOkinawanOsageOttawaPaiutePakistaniPalestinianPanamanianParaguayanPennsylvania GermanPeruvianPimaPolishPortuguesePotawatomiPuebloPuerto RicanPuget Sound SalishRomanianRussianSalvadoranSamoanScandinavianScotch-IrishScottishSeminoleSenegaleseSerbianShoshoneSierra LeoneanSiouxSlavicSlovakSloveneSomaliSouth AfricanSouth AmericanSouth American IndianSoviet UnionSpaniardSpanishSpanish AmericanSpanish American IndianSri LankanSubsaharan AfricanSudaneseSwedishSwissSyrianTaiwaneseThaiTlingit-HaidaTohono O'OdhamTonganTrinidadian and TobagonianTsimshianTurkishU.S. Virgin IslanderUgandanUkrainianUruguayanUteVenezuelanVietnameseWelshWest IndianYakamaYaquiYugoslavianYumanYup'ikZimbabwean
Immigration
NonimmigrantsImmigrantsAfghanistanAfricaAlbaniaArgentinaArmeniaAsiaAustraliaAustriaBahamasBangladeshBarbadosBelarusBelgiumBelizeBoliviaBosnia and HerzegovinaBrazilBulgariaBurma/MyanmarCabo VerdeCambodiaCameroonCanadaCaribbeanCentral AmericaChileChinaColombiaCongoCosta RicaCroatiaCzechoslovakiaDenmarkDominicaDominican RepublicEastern AfricaEastern AsiaEastern EuropeEcuadorEgyptEl SalvadorEnglandEritreaEthiopiaEuropeFijiFranceGermanyGhanaGreeceGrenadaGuatemalaGuyanaHaitiHondurasHong KongHungaryIndiaIndonesiaIranIraqIrelandIsraelItalyJamaicaJapanJordanKazakhstanKenyaKoreaKuwaitLaosLatin AmericaLatviaLebanonLiberiaLithuaniaMalaysiaMexicoMicronesiaMiddle AfricaMoldovaMoroccoNepalNetherlandsNicaraguaNigeriaNorth AmericaNorth MacedoniaNorthern AfricaNorthern EuropeNorwayOceaniaPakistanPanamaPeruPhilippinesPolandPortugalRomaniaRussiaSaudi ArabiaScotlandSenegalSerbiaSierra LeoneSingaporeSomaliaSouth AfricaSouth AmericaSouth Central AsiaSouth Eastern AsiaSouthern EuropeSpainSri LankaSt. Vincent and the GrenadinesSudanSwedenSwitzerlandSyriaTaiwanThailandTrinidad and TobagoTurkeyUgandaUkraineUruguayUzbekistanVenezuelaVietnamWest IndiesWestern AfricaWestern AsiaWestern EuropeYemenZaireZimbabweAzores
Disability Age Under 5
Income
Poverty
Unemployment
Labor Participation
Family Structure
Vehicle Availability
Education Level
Disability

Immigrants from Cuba Disability Age Under 5
Exceptional

1.1%
DISABILITY | AGE UNDER 5
97.0/ 100
METRIC RATING
92nd/ 347
METRIC RANK

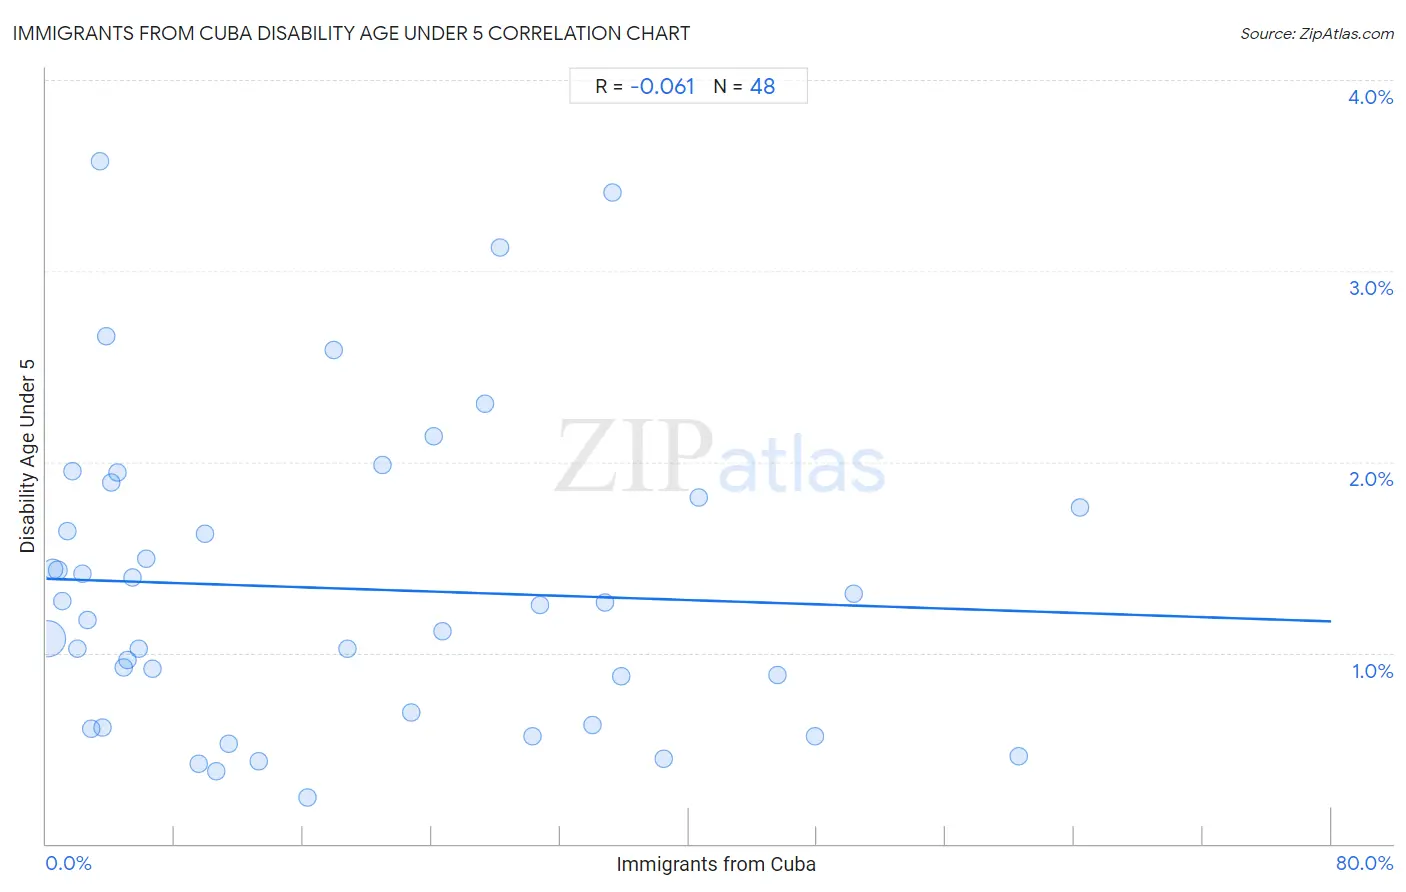
Immigrants from Cuba Disability Age Under 5 Correlation Chart

The statistical analysis conducted on geographies consisting of 186,893,063 people shows a slight negative correlation between the proportion of Immigrants from Cuba and percentage of population with a disability under the age of 5 in the United States with a correlation coefficient (R) of -0.061 and weighted average of 1.1%. On average, for every 1% (one percent) increase in Immigrants from Cuba within a typical geography, there is a decrease of 0.0028% in percentage of population with a disability under the age of 5.
Immigrants from Cuba Disability Age Under 5
It is essential to understand that the correlation between the percentage of Immigrants from Cuba and percentage of population with a disability under the age of 5 does not imply a direct cause-and-effect relationship. It remains uncertain whether the presence of Immigrants from Cuba influences an upward or downward trend in the level of percentage of population with a disability under the age of 5 within an area, or if Immigrants from Cuba simply ended up residing in those areas with higher or lower levels of percentage of population with a disability under the age of 5 due to other factors.

Demographics Similar to Immigrants from Cuba by Disability Age Under 5

In terms of disability age under 5, the demographic groups most similar to Immigrants from Cuba are Spanish American (1.1%, a difference of 0.030%), Sri Lankan (1.1%, a difference of 0.090%), Immigrants from Moldova (1.1%, a difference of 0.14%), Albanian (1.1%, a difference of 0.17%), and Chinese (1.1%, a difference of 0.21%).
DemographicsRating | RankDisability Age Under 5
Sudanese
97.7
/100
|
#85
Exceptional
1.1%
Okinawans
97.6
/100
|
#86
Exceptional
1.1%
Ugandans
97.5
/100
|
#87
Exceptional
1.1%
Immigrants from Dominican Republic
97.5
/100
|
#88
Exceptional
1.1%
Ethiopians
97.2
/100
|
#89
Exceptional
1.1%
Chinese
97.2
/100
|
#90
Exceptional
1.1%
Albanians
97.2
/100
|
#91
Exceptional
1.1%
Immigrants from Cuba
97.0
/100
|
#92
Exceptional
1.1%
Spanish Americans
96.9
/100
|
#93
Exceptional
1.1%
Sri Lankans
96.8
/100
|
#94
Exceptional
1.1%
Immigrants from Moldova
96.8
/100
|
#95
Exceptional
1.1%
Mongolians
96.6
/100
|
#96
Exceptional
1.1%
Immigrants from Iraq
96.5
/100
|
#97
Exceptional
1.1%
Immigrants from South Eastern Asia
96.5
/100
|
#98
Exceptional
1.1%
Dominicans
96.3
/100
|
#99
Exceptional
1.1%

Immigrants from Cuba Disability Age Under 5 Correlation Summary

MeasurementImmigrants from Cuba DataDisability Age Under 5 Data
Minimum0.093%0.24%
Maximum64.4%3.6%
Range64.3%3.3%
Mean18.2%1.3%
Median11.0%1.2%
Interquartile 25% (IQ1)3.6%0.66%
Interquartile 75% (IQ3)30.5%1.8%
Interquartile Range (IQR)26.9%1.1%
Standard Deviation (Sample)17.4%0.80%
Standard Deviation (Population)17.3%0.79%

Correlation Details

Immigrants from Cuba PercentileSample SizeDisability Age Under 5
[
0.0%
-
0.5%
]
0.093%
153,980,6611.1%
[
0.0%
-
0.5%
]
0.42%
14,814,2631.4%
[
0.5%
-
1.0%
]
0.74%
5,463,1331.4%
[
1.0%
-
1.5%
]
1.03%
2,957,9561.3%
[
1.0%
-
1.5%
]
1.34%
1,901,2941.6%
[
1.5%
-
2.0%
]
1.66%
1,053,9832.0%
[
1.5%
-
2.0%
]
1.95%
1,563,3951.0%
[
2.0%
-
2.5%
]
2.29%
529,9111.4%
[
2.5%
-
3.0%
]
2.57%
303,2411.2%
[
2.5%
-
3.0%
]
2.83%
337,9280.60%
[
3.0%
-
3.5%
]
3.32%
50,8833.6%
[
3.0%
-
3.5%
]
3.47%
45,6220.61%
[
3.5%
-
4.0%
]
3.74%
208,4362.7%
[
4.0%
-
4.5%
]
4.02%
151,2321.9%
[
4.0%
-
4.5%
]
4.46%
65,9091.9%
[
4.5%
-
5.0%
]
4.82%
506,9160.92%
[
5.0%
-
5.5%
]
5.03%
216,2150.96%
[
5.0%
-
5.5%
]
5.34%
203,1091.4%
[
5.5%
-
6.0%
]
5.75%
153,4371.0%
[
6.0%
-
6.5%
]
6.19%
286,1751.5%
[
6.5%
-
7.0%
]
6.58%
49,2960.92%
[
9.0%
-
9.5%
]
9.49%
100,6080.42%
[
9.5%
-
10.0%
]
9.87%
32,5821.6%
[
10.5%
-
11.0%
]
10.55%
161,7140.38%
[
11.0%
-
11.5%
]
11.38%
108,7080.52%
[
13.0%
-
13.5%
]
13.24%
111,6180.43%
[
16.0%
-
16.5%
]
16.27%
68,1210.24%
[
17.5%
-
18.0%
]
17.88%
59,1212.6%
[
18.5%
-
19.0%
]
18.72%
31,5901.0%
[
20.5%
-
21.0%
]
20.97%
16,2302.0%
[
22.5%
-
23.0%
]
22.72%
27,0330.69%
[
24.0%
-
24.5%
]
24.15%
57,3272.1%
[
24.5%
-
25.0%
]
24.70%
443,6651.1%
[
27.0%
-
27.5%
]
27.31%
37,9542.3%
[
28.0%
-
28.5%
]
28.25%
37,9583.1%
[
30.0%
-
30.5%
]
30.28%
29,5300.56%
[
30.5%
-
31.0%
]
30.73%
86,0311.2%
[
34.0%
-
34.5%
]
34.03%
35,7050.62%
[
34.5%
-
35.0%
]
34.79%
57,0661.3%
[
35.0%
-
35.5%
]
35.23%
13,1633.4%
[
35.5%
-
36.0%
]
35.78%
37,9770.88%
[
38.0%
-
38.5%
]
38.43%
43,7020.44%
[
40.5%
-
41.0%
]
40.65%
34,3351.8%
[
45.5%
-
46.0%
]
45.55%
24,5970.88%
[
47.5%
-
48.0%
]
47.86%
52,8510.56%
[
50.0%
-
50.5%
]
50.26%
46,7981.3%
[
60.5%
-
61.0%
]
60.57%
222,9960.46%
[
64.0%
-
64.5%
]
64.39%
71,0881.8%