Choctaw Disability Age Under 5
COMPARE
Choctaw
Select to Compare
Disability Age Under 5
Choctaw Disability Age Under 5
1.9%
DISABILITY | AGE UNDER 5
0.0/ 100
METRIC RATING
330th/ 347
METRIC RANK
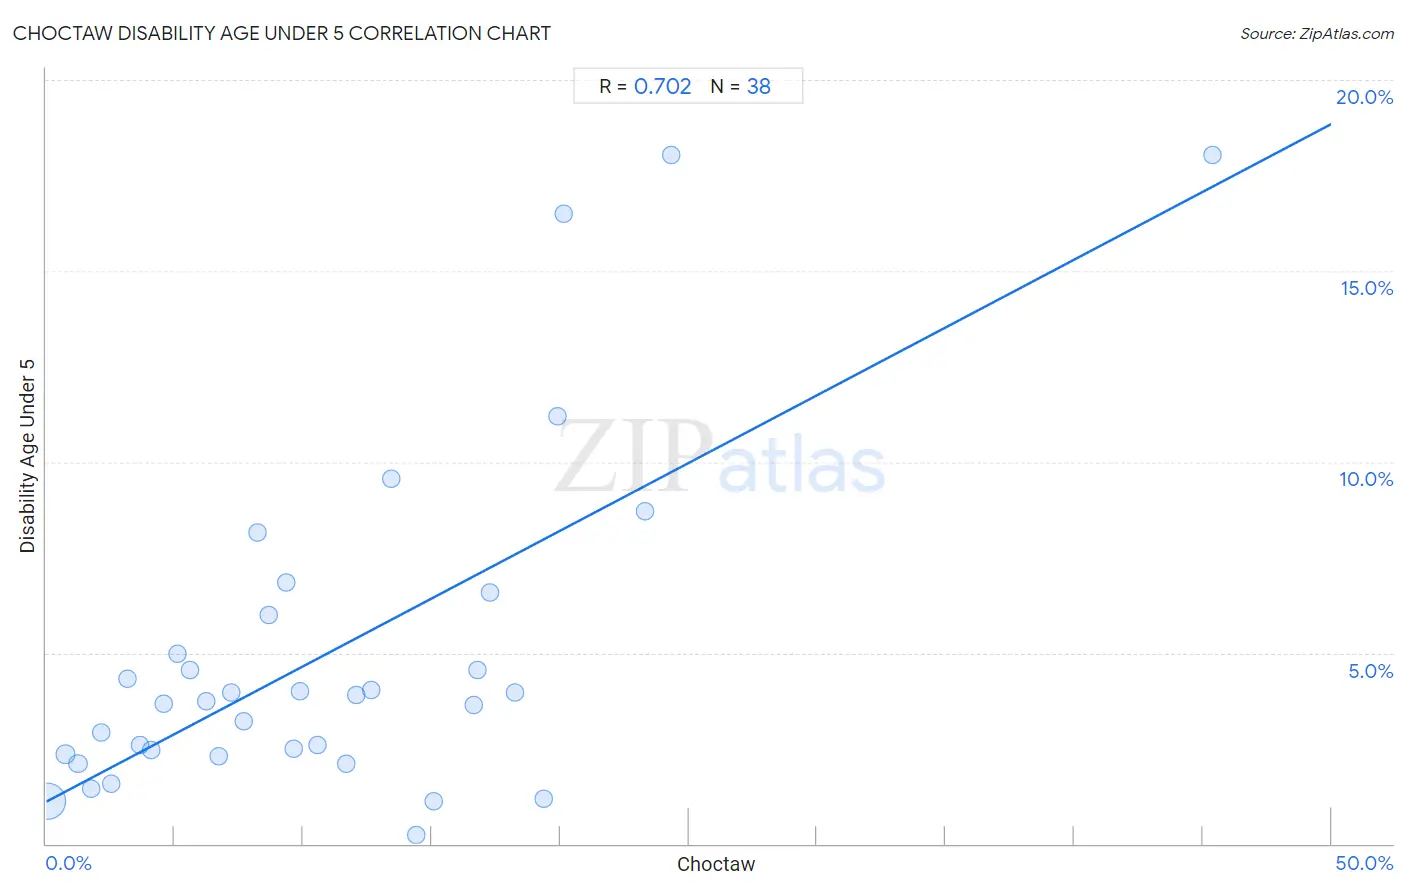
Choctaw Disability Age Under 5 Correlation Chart
The statistical analysis conducted on geographies consisting of 165,165,816 people shows a strong positive correlation between the proportion of Choctaw and percentage of population with a disability under the age of 5 in the United States with a correlation coefficient (R) of 0.702 and weighted average of 1.9%. On average, for every 1% (one percent) increase in Choctaw within a typical geography, there is an increase of 0.35% in percentage of population with a disability under the age of 5.
It is essential to understand that the correlation between the percentage of Choctaw and percentage of population with a disability under the age of 5 does not imply a direct cause-and-effect relationship. It remains uncertain whether the presence of Choctaw influences an upward or downward trend in the level of percentage of population with a disability under the age of 5 within an area, or if Choctaw simply ended up residing in those areas with higher or lower levels of percentage of population with a disability under the age of 5 due to other factors.
Demographics Similar to Choctaw by Disability Age Under 5
In terms of disability age under 5, the demographic groups most similar to Choctaw are French Canadian (1.9%, a difference of 0.30%), Houma (1.9%, a difference of 0.32%), Chippewa (1.9%, a difference of 0.36%), American (1.9%, a difference of 0.80%), and Osage (1.8%, a difference of 2.5%).
| Demographics | Rating | Rank | Disability Age Under 5 |
| Chickasaw | 0.0 /100 | #323 | Tragic 1.7% |
| Cherokee | 0.0 /100 | #324 | Tragic 1.8% |
| Immigrants from Portugal | 0.0 /100 | #325 | Tragic 1.8% |
| Sioux | 0.0 /100 | #326 | Tragic 1.8% |
| Osage | 0.0 /100 | #327 | Tragic 1.8% |
| Americans | 0.0 /100 | #328 | Tragic 1.9% |
| Houma | 0.0 /100 | #329 | Tragic 1.9% |
| Choctaw | 0.0 /100 | #330 | Tragic 1.9% |
| French Canadians | 0.0 /100 | #331 | Tragic 1.9% |
| Chippewa | 0.0 /100 | #332 | Tragic 1.9% |
| Dutch West Indians | 0.0 /100 | #333 | Tragic 1.9% |
| Natives/Alaskans | 0.0 /100 | #334 | Tragic 1.9% |
| Pennsylvania Germans | 0.0 /100 | #335 | Tragic 1.9% |
| Paraguayans | 0.0 /100 | #336 | Tragic 2.0% |
| Apache | 0.0 /100 | #337 | Tragic 2.0% |
Choctaw Disability Age Under 5 Correlation Summary
| Measurement | Choctaw Data | Disability Age Under 5 Data |
| Minimum | 0.071% | 0.24% |
| Maximum | 45.4% | 18.0% |
| Range | 45.3% | 17.8% |
| Mean | 11.0% | 5.0% |
| Median | 9.5% | 3.8% |
| Interquartile 25% (IQ1) | 4.6% | 2.3% |
| Interquartile 75% (IQ3) | 16.6% | 6.0% |
| Interquartile Range (IQR) | 12.1% | 3.6% |
| Standard Deviation (Sample) | 8.8% | 4.4% |
| Standard Deviation (Population) | 8.7% | 4.4% |
Correlation Details
| Choctaw Percentile | Sample Size | Disability Age Under 5 |
[ 0.0% - 0.5% ] 0.071% | 159,463,544 | 1.1% |
[ 0.5% - 1.0% ] 0.75% | 2,374,770 | 2.3% |
[ 1.0% - 1.5% ] 1.24% | 1,536,511 | 2.1% |
[ 1.5% - 2.0% ] 1.73% | 749,567 | 1.5% |
[ 2.0% - 2.5% ] 2.15% | 240,472 | 2.9% |
[ 2.5% - 3.0% ] 2.51% | 198,167 | 1.6% |
[ 3.0% - 3.5% ] 3.17% | 82,975 | 4.3% |
[ 3.5% - 4.0% ] 3.64% | 100,664 | 2.6% |
[ 4.0% - 4.5% ] 4.07% | 53,647 | 2.4% |
[ 4.5% - 5.0% ] 4.56% | 12,581 | 3.7% |
[ 5.0% - 5.5% ] 5.08% | 9,167 | 5.0% |
[ 5.5% - 6.0% ] 5.60% | 10,579 | 4.6% |
[ 6.0% - 6.5% ] 6.21% | 3,367 | 3.7% |
[ 6.5% - 7.0% ] 6.73% | 85,838 | 2.3% |
[ 7.0% - 7.5% ] 7.19% | 25,783 | 4.0% |
[ 7.5% - 8.0% ] 7.68% | 12,482 | 3.2% |
[ 8.0% - 8.5% ] 8.22% | 1,630 | 8.1% |
[ 8.5% - 9.0% ] 8.65% | 8,363 | 6.0% |
[ 9.0% - 9.5% ] 9.32% | 966 | 6.8% |
[ 9.5% - 10.0% ] 9.62% | 468 | 2.5% |
[ 9.5% - 10.0% ] 9.85% | 12,742 | 4.0% |
[ 10.5% - 11.0% ] 10.57% | 12,495 | 2.6% |
[ 11.5% - 12.0% ] 11.65% | 2,008 | 2.1% |
[ 12.0% - 12.5% ] 12.07% | 59,821 | 3.9% |
[ 12.5% - 13.0% ] 12.65% | 2,095 | 4.0% |
[ 13.0% - 13.5% ] 13.41% | 1,238 | 9.6% |
[ 14.0% - 14.5% ] 14.39% | 26,158 | 0.24% |
[ 15.0% - 15.5% ] 15.07% | 21,875 | 1.1% |
[ 16.5% - 17.0% ] 16.62% | 9,835 | 3.6% |
[ 16.5% - 17.0% ] 16.79% | 8,006 | 4.6% |
[ 17.0% - 17.5% ] 17.25% | 1,600 | 6.6% |
[ 18.0% - 18.5% ] 18.23% | 6,825 | 3.9% |
[ 19.0% - 19.5% ] 19.38% | 20,726 | 1.2% |
[ 19.5% - 20.0% ] 19.89% | 3,117 | 11.2% |
[ 20.0% - 20.5% ] 20.13% | 1,754 | 16.5% |
[ 23.0% - 23.5% ] 23.29% | 425 | 8.7% |
[ 24.0% - 24.5% ] 24.32% | 2,315 | 18.0% |
[ 45.0% - 45.5% ] 45.40% | 1,240 | 18.0% |