Immigrants from Nigeria Disability Age Under 5
COMPARE
Immigrants from Nigeria
Select to Compare
Disability Age Under 5
Immigrants from Nigeria Disability Age Under 5
1.2%
DISABILITY | AGE UNDER 5
50.0/ 100
METRIC RATING
175th/ 347
METRIC RANK
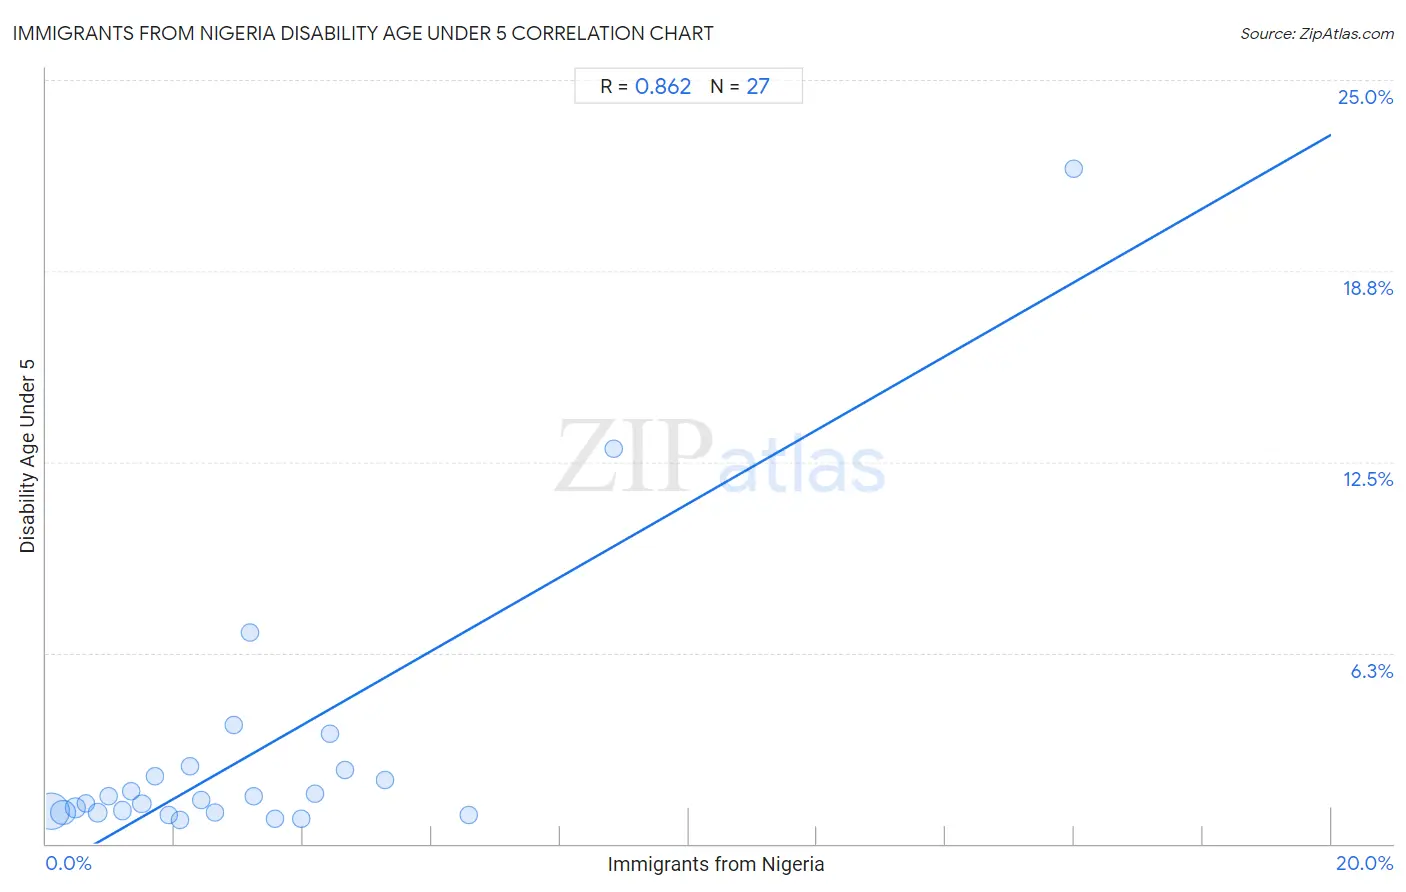
Immigrants from Nigeria Disability Age Under 5 Correlation Chart
The statistical analysis conducted on geographies consisting of 173,767,692 people shows a very strong positive correlation between the proportion of Immigrants from Nigeria and percentage of population with a disability under the age of 5 in the United States with a correlation coefficient (R) of 0.862 and weighted average of 1.2%. On average, for every 1% (one percent) increase in Immigrants from Nigeria within a typical geography, there is an increase of 1.2% in percentage of population with a disability under the age of 5.
It is essential to understand that the correlation between the percentage of Immigrants from Nigeria and percentage of population with a disability under the age of 5 does not imply a direct cause-and-effect relationship. It remains uncertain whether the presence of Immigrants from Nigeria influences an upward or downward trend in the level of percentage of population with a disability under the age of 5 within an area, or if Immigrants from Nigeria simply ended up residing in those areas with higher or lower levels of percentage of population with a disability under the age of 5 due to other factors.
Demographics Similar to Immigrants from Nigeria by Disability Age Under 5
In terms of disability age under 5, the demographic groups most similar to Immigrants from Nigeria are Immigrants from Latvia (1.2%, a difference of 0.0%), Immigrants from Ireland (1.2%, a difference of 0.030%), Crow (1.2%, a difference of 0.090%), Immigrants from Kenya (1.2%, a difference of 0.13%), and Comanche (1.2%, a difference of 0.22%).
| Demographics | Rating | Rank | Disability Age Under 5 |
| Sierra Leoneans | 59.1 /100 | #168 | Average 1.2% |
| Immigrants from Uruguay | 59.0 /100 | #169 | Average 1.2% |
| Immigrants from Jamaica | 58.8 /100 | #170 | Average 1.2% |
| Guamanians/Chamorros | 57.8 /100 | #171 | Average 1.2% |
| Crow | 51.0 /100 | #172 | Average 1.2% |
| Immigrants from Ireland | 50.3 /100 | #173 | Average 1.2% |
| Immigrants from Latvia | 50.0 /100 | #174 | Average 1.2% |
| Immigrants from Nigeria | 50.0 /100 | #175 | Average 1.2% |
| Immigrants from Kenya | 48.6 /100 | #176 | Average 1.2% |
| Comanche | 47.5 /100 | #177 | Average 1.2% |
| Venezuelans | 47.1 /100 | #178 | Average 1.2% |
| Immigrants from Bahamas | 45.2 /100 | #179 | Average 1.2% |
| Immigrants from Mexico | 44.4 /100 | #180 | Average 1.2% |
| Macedonians | 43.7 /100 | #181 | Average 1.2% |
| Immigrants from Peru | 43.7 /100 | #181 | Average 1.2% |
Immigrants from Nigeria Disability Age Under 5 Correlation Summary
| Measurement | Immigrants from Nigeria Data | Disability Age Under 5 Data |
| Minimum | 0.073% | 0.78% |
| Maximum | 16.0% | 22.1% |
| Range | 15.9% | 21.3% |
| Mean | 3.2% | 3.0% |
| Median | 2.4% | 1.4% |
| Interquartile 25% (IQ1) | 1.2% | 1.0% |
| Interquartile 75% (IQ3) | 4.2% | 2.4% |
| Interquartile Range (IQR) | 3.0% | 1.4% |
| Standard Deviation (Sample) | 3.3% | 4.6% |
| Standard Deviation (Population) | 3.2% | 4.5% |
Correlation Details
| Immigrants from Nigeria Percentile | Sample Size | Disability Age Under 5 |
[ 0.0% - 0.5% ] 0.073% | 110,756,430 | 1.1% |
[ 0.0% - 0.5% ] 0.26% | 37,656,800 | 1.0% |
[ 0.0% - 0.5% ] 0.45% | 10,607,665 | 1.2% |
[ 0.5% - 1.0% ] 0.62% | 4,574,217 | 1.3% |
[ 0.5% - 1.0% ] 0.80% | 5,343,941 | 1.0% |
[ 0.5% - 1.0% ] 0.97% | 1,249,122 | 1.6% |
[ 1.0% - 1.5% ] 1.18% | 720,263 | 1.1% |
[ 1.0% - 1.5% ] 1.32% | 568,915 | 1.7% |
[ 1.0% - 1.5% ] 1.49% | 468,084 | 1.3% |
[ 1.5% - 2.0% ] 1.70% | 346,176 | 2.2% |
[ 1.5% - 2.0% ] 1.90% | 135,747 | 0.93% |
[ 2.0% - 2.5% ] 2.09% | 465,294 | 0.78% |
[ 2.0% - 2.5% ] 2.24% | 170,286 | 2.5% |
[ 2.0% - 2.5% ] 2.41% | 120,574 | 1.4% |
[ 2.5% - 3.0% ] 2.62% | 98,631 | 1.0% |
[ 2.5% - 3.0% ] 2.92% | 97,647 | 3.9% |
[ 3.0% - 3.5% ] 3.16% | 6,132 | 6.9% |
[ 3.0% - 3.5% ] 3.24% | 50,725 | 1.6% |
[ 3.5% - 4.0% ] 3.56% | 25,251 | 0.83% |
[ 3.5% - 4.0% ] 3.98% | 63,047 | 0.82% |
[ 4.0% - 4.5% ] 4.18% | 55,847 | 1.7% |
[ 4.0% - 4.5% ] 4.42% | 39,501 | 3.6% |
[ 4.5% - 5.0% ] 4.64% | 27,830 | 2.4% |
[ 5.0% - 5.5% ] 5.27% | 35,318 | 2.1% |
[ 6.5% - 7.0% ] 6.57% | 75,004 | 0.95% |
[ 8.5% - 9.0% ] 8.84% | 5,331 | 12.9% |
[ 15.5% - 16.0% ] 15.99% | 3,914 | 22.1% |