Arab Disability Age Under 5
COMPARE
Arab
Select to Compare
Disability Age Under 5
Arab Disability Age Under 5
1.2%
DISABILITY | AGE UNDER 5
66.4/ 100
METRIC RATING
158th/ 347
METRIC RANK
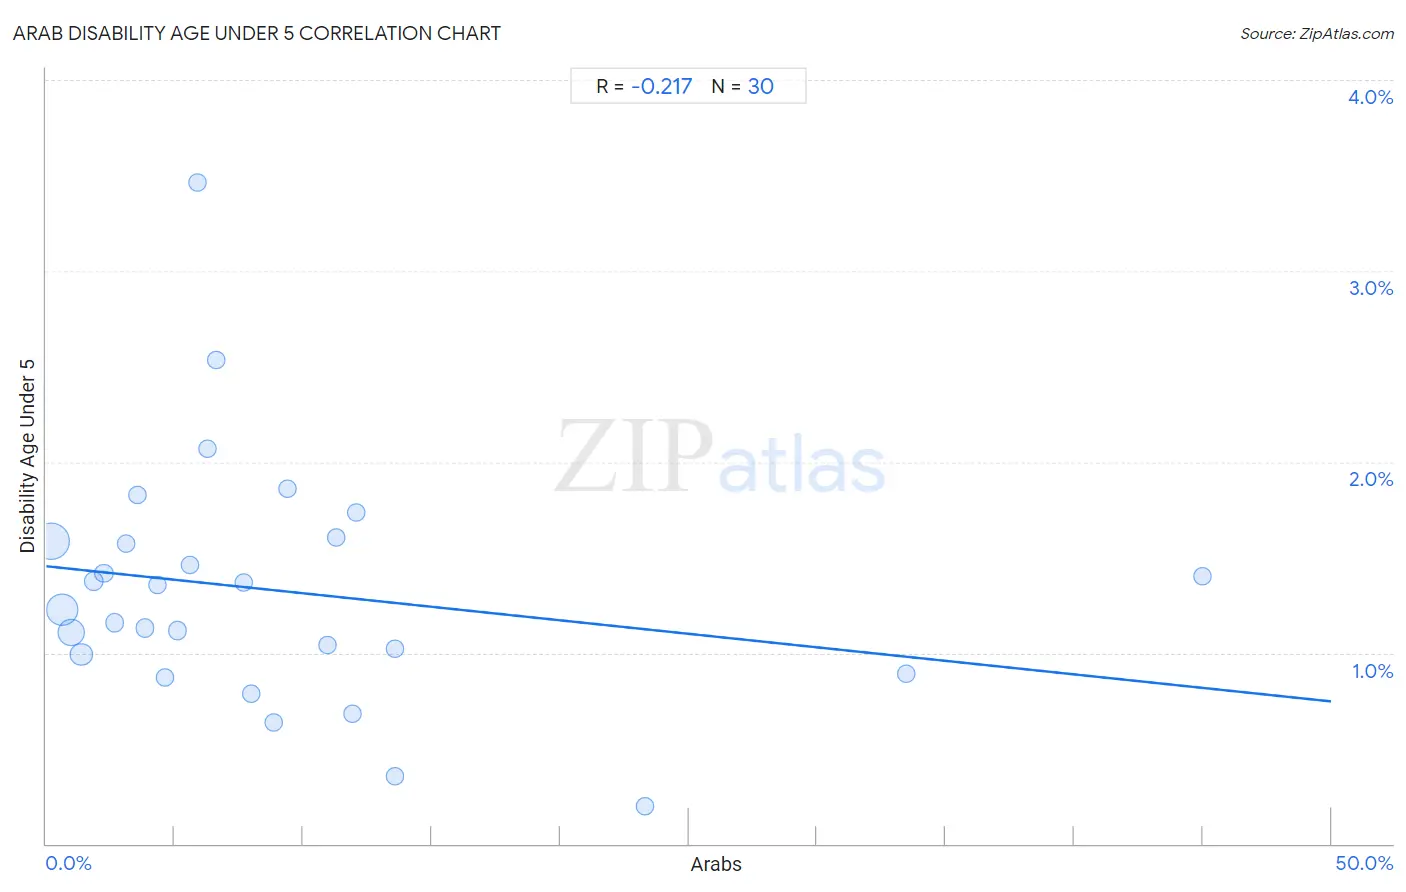
Arab Disability Age Under 5 Correlation Chart
The statistical analysis conducted on geographies consisting of 244,671,957 people shows a weak negative correlation between the proportion of Arabs and percentage of population with a disability under the age of 5 in the United States with a correlation coefficient (R) of -0.217 and weighted average of 1.2%. On average, for every 1% (one percent) increase in Arabs within a typical geography, there is a decrease of 0.014% in percentage of population with a disability under the age of 5.
It is essential to understand that the correlation between the percentage of Arabs and percentage of population with a disability under the age of 5 does not imply a direct cause-and-effect relationship. It remains uncertain whether the presence of Arabs influences an upward or downward trend in the level of percentage of population with a disability under the age of 5 within an area, or if Arabs simply ended up residing in those areas with higher or lower levels of percentage of population with a disability under the age of 5 due to other factors.
Demographics Similar to Arabs by Disability Age Under 5
In terms of disability age under 5, the demographic groups most similar to Arabs are Immigrants from South America (1.2%, a difference of 0.060%), Colombian (1.2%, a difference of 0.060%), Immigrants from Latin America (1.2%, a difference of 0.060%), Immigrants from Africa (1.2%, a difference of 0.13%), and Hawaiian (1.2%, a difference of 0.22%).
| Demographics | Rating | Rank | Disability Age Under 5 |
| Yaqui | 74.8 /100 | #151 | Good 1.2% |
| Hondurans | 72.5 /100 | #152 | Good 1.2% |
| Immigrants from Thailand | 69.4 /100 | #153 | Good 1.2% |
| Uruguayans | 68.8 /100 | #154 | Good 1.2% |
| Immigrants from Ghana | 68.7 /100 | #155 | Good 1.2% |
| Hawaiians | 68.5 /100 | #156 | Good 1.2% |
| Immigrants from South America | 67.0 /100 | #157 | Good 1.2% |
| Arabs | 66.4 /100 | #158 | Good 1.2% |
| Colombians | 65.8 /100 | #159 | Good 1.2% |
| Immigrants from Latin America | 65.8 /100 | #160 | Good 1.2% |
| Immigrants from Africa | 65.1 /100 | #161 | Good 1.2% |
| Guatemalans | 63.6 /100 | #162 | Good 1.2% |
| Immigrants from Guatemala | 63.2 /100 | #163 | Good 1.2% |
| Laotians | 62.8 /100 | #164 | Good 1.2% |
| Immigrants from Kuwait | 62.6 /100 | #165 | Good 1.2% |
Arab Disability Age Under 5 Correlation Summary
| Measurement | Arab Data | Disability Age Under 5 Data |
| Minimum | 0.20% | 0.20% |
| Maximum | 45.0% | 3.5% |
| Range | 44.8% | 3.3% |
| Mean | 8.9% | 1.3% |
| Median | 6.1% | 1.3% |
| Interquartile 25% (IQ1) | 3.1% | 0.99% |
| Interquartile 75% (IQ3) | 11.3% | 1.6% |
| Interquartile Range (IQR) | 8.2% | 0.59% |
| Standard Deviation (Sample) | 9.8% | 0.64% |
| Standard Deviation (Population) | 9.6% | 0.63% |
Correlation Details
| Arab Percentile | Sample Size | Disability Age Under 5 |
[ 0.0% - 0.5% ] 0.20% | 90,341,665 | 1.6% |
[ 0.5% - 1.0% ] 0.62% | 69,099,627 | 1.2% |
[ 0.5% - 1.0% ] 0.99% | 42,451,625 | 1.1% |
[ 1.0% - 1.5% ] 1.36% | 23,417,045 | 0.99% |
[ 1.5% - 2.0% ] 1.84% | 6,256,056 | 1.4% |
[ 2.0% - 2.5% ] 2.24% | 4,693,545 | 1.4% |
[ 2.5% - 3.0% ] 2.65% | 3,593,493 | 1.2% |
[ 3.0% - 3.5% ] 3.11% | 1,243,334 | 1.6% |
[ 3.5% - 4.0% ] 3.55% | 474,542 | 1.8% |
[ 3.5% - 4.0% ] 3.86% | 707,381 | 1.1% |
[ 4.0% - 4.5% ] 4.31% | 387,239 | 1.4% |
[ 4.5% - 5.0% ] 4.63% | 143,945 | 0.87% |
[ 5.0% - 5.5% ] 5.12% | 369,806 | 1.1% |
[ 5.5% - 6.0% ] 5.60% | 184,378 | 1.5% |
[ 5.5% - 6.0% ] 5.88% | 135,125 | 3.5% |
[ 6.0% - 6.5% ] 6.29% | 60,624 | 2.1% |
[ 6.5% - 7.0% ] 6.64% | 117,157 | 2.5% |
[ 7.5% - 8.0% ] 7.70% | 77,703 | 1.4% |
[ 7.5% - 8.0% ] 7.97% | 161,116 | 0.79% |
[ 8.5% - 9.0% ] 8.87% | 274,738 | 0.64% |
[ 9.0% - 9.5% ] 9.40% | 26,547 | 1.9% |
[ 10.5% - 11.0% ] 10.93% | 80,711 | 1.0% |
[ 11.0% - 11.5% ] 11.28% | 112,683 | 1.6% |
[ 11.5% - 12.0% ] 11.90% | 19,762 | 0.68% |
[ 12.0% - 12.5% ] 12.06% | 19,625 | 1.7% |
[ 13.5% - 14.0% ] 13.55% | 33,174 | 0.35% |
[ 13.5% - 14.0% ] 13.57% | 43,232 | 1.0% |
[ 23.0% - 23.5% ] 23.30% | 43,213 | 0.20% |
[ 33.0% - 33.5% ] 33.47% | 62,474 | 0.89% |
[ 44.5% - 45.0% ] 44.98% | 40,392 | 1.4% |