Albanian Disability Age Under 5
COMPARE
Albanian
Select to Compare
Disability Age Under 5
Albanian Disability Age Under 5
1.1%
DISABILITY | AGE UNDER 5
97.2/ 100
METRIC RATING
91st/ 347
METRIC RANK
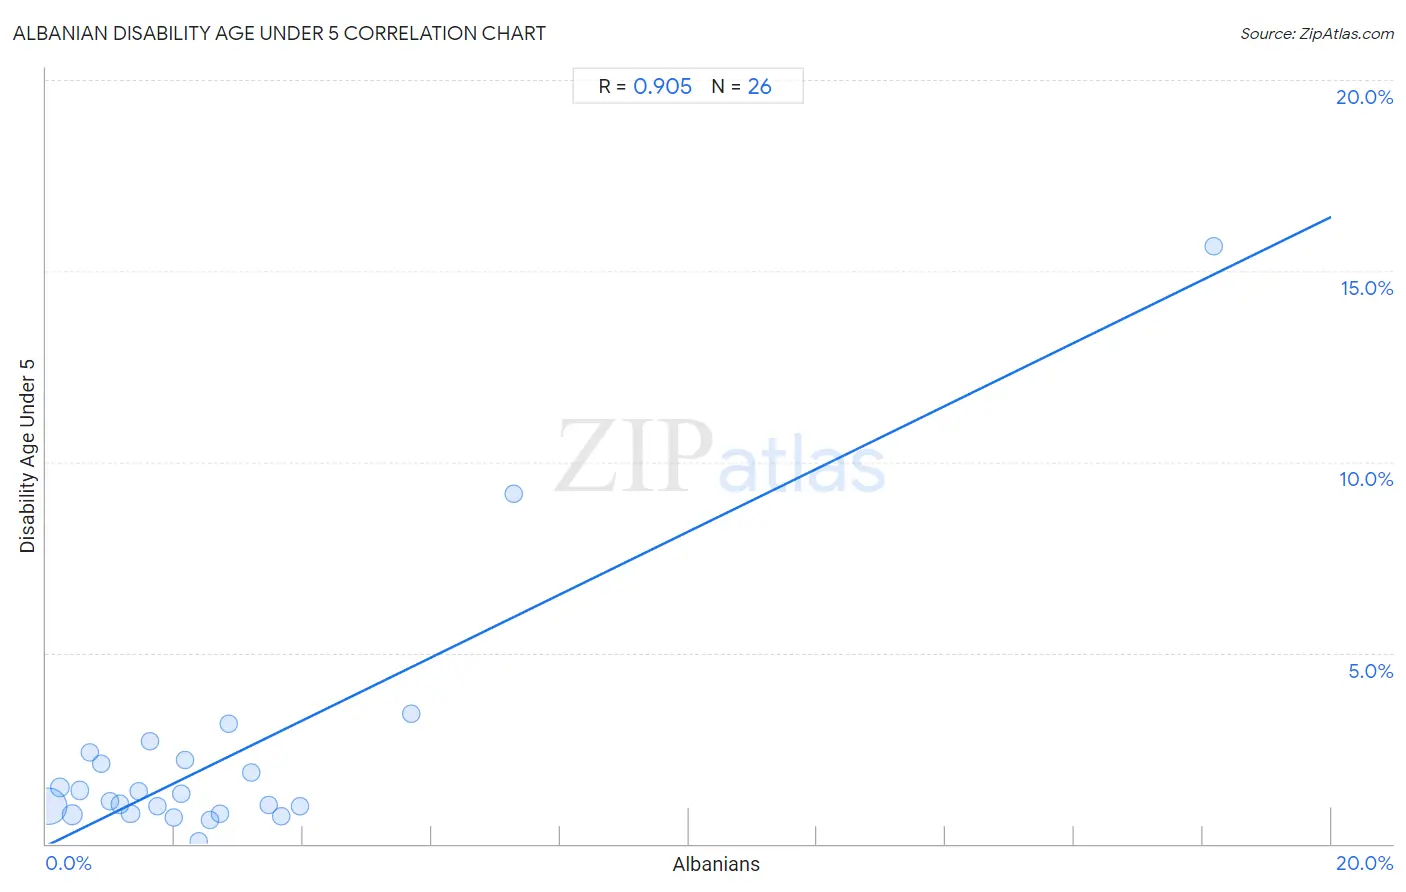
Albanian Disability Age Under 5 Correlation Chart
The statistical analysis conducted on geographies consisting of 123,207,813 people shows a near-perfect positive correlation between the proportion of Albanians and percentage of population with a disability under the age of 5 in the United States with a correlation coefficient (R) of 0.905 and weighted average of 1.1%. On average, for every 1% (one percent) increase in Albanians within a typical geography, there is an increase of 0.82% in percentage of population with a disability under the age of 5.
It is essential to understand that the correlation between the percentage of Albanians and percentage of population with a disability under the age of 5 does not imply a direct cause-and-effect relationship. It remains uncertain whether the presence of Albanians influences an upward or downward trend in the level of percentage of population with a disability under the age of 5 within an area, or if Albanians simply ended up residing in those areas with higher or lower levels of percentage of population with a disability under the age of 5 due to other factors.
Demographics Similar to Albanians by Disability Age Under 5
In terms of disability age under 5, the demographic groups most similar to Albanians are Chinese (1.1%, a difference of 0.040%), Ethiopian (1.1%, a difference of 0.070%), Immigrants from Cuba (1.1%, a difference of 0.17%), Spanish American (1.1%, a difference of 0.20%), and Sri Lankan (1.1%, a difference of 0.26%).
| Demographics | Rating | Rank | Disability Age Under 5 |
| Immigrants from Zaire | 97.8 /100 | #84 | Exceptional 1.1% |
| Sudanese | 97.7 /100 | #85 | Exceptional 1.1% |
| Okinawans | 97.6 /100 | #86 | Exceptional 1.1% |
| Ugandans | 97.5 /100 | #87 | Exceptional 1.1% |
| Immigrants from Dominican Republic | 97.5 /100 | #88 | Exceptional 1.1% |
| Ethiopians | 97.2 /100 | #89 | Exceptional 1.1% |
| Chinese | 97.2 /100 | #90 | Exceptional 1.1% |
| Albanians | 97.2 /100 | #91 | Exceptional 1.1% |
| Immigrants from Cuba | 97.0 /100 | #92 | Exceptional 1.1% |
| Spanish Americans | 96.9 /100 | #93 | Exceptional 1.1% |
| Sri Lankans | 96.8 /100 | #94 | Exceptional 1.1% |
| Immigrants from Moldova | 96.8 /100 | #95 | Exceptional 1.1% |
| Mongolians | 96.6 /100 | #96 | Exceptional 1.1% |
| Immigrants from Iraq | 96.5 /100 | #97 | Exceptional 1.1% |
| Immigrants from South Eastern Asia | 96.5 /100 | #98 | Exceptional 1.1% |
Albanian Disability Age Under 5 Correlation Summary
| Measurement | Albanian Data | Disability Age Under 5 Data |
| Minimum | 0.038% | 0.063% |
| Maximum | 18.2% | 15.7% |
| Range | 18.1% | 15.6% |
| Mean | 2.8% | 2.3% |
| Median | 2.0% | 1.2% |
| Interquartile 25% (IQ1) | 1.00% | 0.78% |
| Interquartile 75% (IQ3) | 3.2% | 2.2% |
| Interquartile Range (IQR) | 2.2% | 1.4% |
| Standard Deviation (Sample) | 3.5% | 3.2% |
| Standard Deviation (Population) | 3.5% | 3.2% |
Correlation Details
| Albanian Percentile | Sample Size | Disability Age Under 5 |
[ 0.0% - 0.5% ] 0.038% | 94,035,443 | 0.99% |
[ 0.0% - 0.5% ] 0.22% | 7,317,337 | 1.5% |
[ 0.0% - 0.5% ] 0.40% | 14,934,440 | 0.76% |
[ 0.5% - 1.0% ] 0.53% | 1,917,298 | 1.4% |
[ 0.5% - 1.0% ] 0.69% | 1,266,802 | 2.4% |
[ 0.5% - 1.0% ] 0.85% | 571,006 | 2.1% |
[ 0.5% - 1.0% ] 1.00% | 459,561 | 1.1% |
[ 1.0% - 1.5% ] 1.14% | 583,514 | 1.0% |
[ 1.0% - 1.5% ] 1.31% | 413,834 | 0.78% |
[ 1.0% - 1.5% ] 1.43% | 154,770 | 1.4% |
[ 1.5% - 2.0% ] 1.62% | 115,050 | 2.7% |
[ 1.5% - 2.0% ] 1.74% | 475,528 | 0.98% |
[ 1.5% - 2.0% ] 1.98% | 115,431 | 0.69% |
[ 2.0% - 2.5% ] 2.10% | 70,938 | 1.3% |
[ 2.0% - 2.5% ] 2.16% | 159,243 | 2.2% |
[ 2.0% - 2.5% ] 2.36% | 98,713 | 0.063% |
[ 2.5% - 3.0% ] 2.54% | 177,999 | 0.62% |
[ 2.5% - 3.0% ] 2.70% | 114,380 | 0.78% |
[ 2.5% - 3.0% ] 2.84% | 56,232 | 3.1% |
[ 3.0% - 3.5% ] 3.19% | 28,248 | 1.9% |
[ 3.0% - 3.5% ] 3.47% | 43,232 | 1.0% |
[ 3.5% - 4.0% ] 3.67% | 29,215 | 0.71% |
[ 3.5% - 4.0% ] 3.95% | 50,868 | 0.98% |
[ 5.5% - 6.0% ] 5.68% | 15,459 | 3.4% |
[ 7.0% - 7.5% ] 7.28% | 2,336 | 9.2% |
[ 18.0% - 18.5% ] 18.16% | 936 | 15.7% |