Immigrants from Western Europe Disability Age Under 5

COMPARE

Immigrants from Western Europe
Race
Ancestry
AfghanAfricanAlaska NativeAlaskan AthabascanAlbanianAleutAlsatianAmericanApacheArabArapahoArgentineanArmenianAssyrian/Chaldean/SyriacAustralianAustrianBahamianBangladeshiBarbadianBasqueBelgianBelizeanBermudanBhutaneseBlackfeetBolivianBrazilianBritishBritish West IndianBulgarianBurmeseCajunCambodianCanadianCape VerdeanCarpatho RusynCelticCentral AmericanCentral American IndianCherokeeCheyenneChickasawChileanChineseChippewaChoctawColombianColvilleComancheCosta RicanCreeCreekCroatianCrowCubanCypriotCzechCzechoslovakianDanishDelawareDominicanDutchDutch West IndianEastern EuropeanEcuadorianEgyptianEnglishEstonianEthiopianEuropeanFijianFilipinoFinnishFrenchFrench American IndianFrench CanadianGermanGerman RussianGhanaianGreekGuamanian/ChamorroGuatemalanGuyaneseHaitianHmongHonduranHopiHoumaHungarianIcelanderIndian (Asian)IndonesianInupiatIranianIraqiIrishIroquoisIsraeliItalianJamaicanJapaneseJordanianKenyanKiowaKoreanLaotianLatvianLebaneseLiberianLithuanianLumbeeLuxembourgerMacedonianMalaysianMalteseMarshalleseMenomineeMexicanMexican American IndianMongolianMoroccanNative HawaiianNavajoNepaleseNew ZealanderNicaraguanNigerianNorthern EuropeanNorwegianOkinawanOsageOttawaPaiutePakistaniPalestinianPanamanianParaguayanPennsylvania GermanPeruvianPimaPolishPortuguesePotawatomiPuebloPuerto RicanPuget Sound SalishRomanianRussianSalvadoranSamoanScandinavianScotch-IrishScottishSeminoleSenegaleseSerbianShoshoneSierra LeoneanSiouxSlavicSlovakSloveneSomaliSouth AfricanSouth AmericanSouth American IndianSoviet UnionSpaniardSpanishSpanish AmericanSpanish American IndianSri LankanSubsaharan AfricanSudaneseSwedishSwissSyrianTaiwaneseThaiTlingit-HaidaTohono O'OdhamTonganTrinidadian and TobagonianTsimshianTurkishU.S. Virgin IslanderUgandanUkrainianUruguayanUteVenezuelanVietnameseWelshWest IndianYakamaYaquiYugoslavianYumanYup'ikZimbabwean
Immigration
NonimmigrantsImmigrantsAfghanistanAfricaAlbaniaArgentinaArmeniaAsiaAustraliaAustriaBahamasBangladeshBarbadosBelarusBelgiumBelizeBoliviaBosnia and HerzegovinaBrazilBulgariaBurma/MyanmarCabo VerdeCambodiaCameroonCanadaCaribbeanCentral AmericaChileChinaColombiaCongoCosta RicaCroatiaCubaCzechoslovakiaDenmarkDominicaDominican RepublicEastern AfricaEastern AsiaEastern EuropeEcuadorEgyptEl SalvadorEnglandEritreaEthiopiaEuropeFijiFranceGermanyGhanaGreeceGrenadaGuatemalaGuyanaHaitiHondurasHong KongHungaryIndiaIndonesiaIranIraqIrelandIsraelItalyJamaicaJapanJordanKazakhstanKenyaKoreaKuwaitLaosLatin AmericaLatviaLebanonLiberiaLithuaniaMalaysiaMexicoMicronesiaMiddle AfricaMoldovaMoroccoNepalNetherlandsNicaraguaNigeriaNorth AmericaNorth MacedoniaNorthern AfricaNorthern EuropeNorwayOceaniaPakistanPanamaPeruPhilippinesPolandPortugalRomaniaRussiaSaudi ArabiaScotlandSenegalSerbiaSierra LeoneSingaporeSomaliaSouth AfricaSouth AmericaSouth Central AsiaSouth Eastern AsiaSouthern EuropeSpainSri LankaSt. Vincent and the GrenadinesSudanSwedenSwitzerlandSyriaTaiwanThailandTrinidad and TobagoTurkeyUgandaUkraineUruguayUzbekistanVenezuelaVietnamWest IndiesWestern AfricaWestern AsiaWestern EuropeYemenZaireZimbabweAzores
Select to Compare
Race
Ancestry
AfghanAfricanAlaska NativeAlaskan AthabascanAlbanianAleutAlsatianAmericanApacheArabArapahoArgentineanArmenianAssyrian/Chaldean/SyriacAustralianAustrianBahamianBangladeshiBarbadianBasqueBelgianBelizeanBermudanBhutaneseBlackfeetBolivianBrazilianBritishBritish West IndianBulgarianBurmeseCajunCambodianCanadianCape VerdeanCarpatho RusynCelticCentral AmericanCentral American IndianCherokeeCheyenneChickasawChileanChineseChippewaChoctawColombianColvilleComancheCosta RicanCreeCreekCroatianCrowCubanCypriotCzechCzechoslovakianDanishDelawareDominicanDutchDutch West IndianEastern EuropeanEcuadorianEgyptianEnglishEstonianEthiopianEuropeanFijianFilipinoFinnishFrenchFrench American IndianFrench CanadianGermanGerman RussianGhanaianGreekGuamanian/ChamorroGuatemalanGuyaneseHaitianHmongHonduranHopiHoumaHungarianIcelanderIndian (Asian)IndonesianInupiatIranianIraqiIrishIroquoisIsraeliItalianJamaicanJapaneseJordanianKenyanKiowaKoreanLaotianLatvianLebaneseLiberianLithuanianLumbeeLuxembourgerMacedonianMalaysianMalteseMarshalleseMenomineeMexicanMexican American IndianMongolianMoroccanNative HawaiianNavajoNepaleseNew ZealanderNicaraguanNigerianNorthern EuropeanNorwegianOkinawanOsageOttawaPaiutePakistaniPalestinianPanamanianParaguayanPennsylvania GermanPeruvianPimaPolishPortuguesePotawatomiPuebloPuerto RicanPuget Sound SalishRomanianRussianSalvadoranSamoanScandinavianScotch-IrishScottishSeminoleSenegaleseSerbianShoshoneSierra LeoneanSiouxSlavicSlovakSloveneSomaliSouth AfricanSouth AmericanSouth American IndianSoviet UnionSpaniardSpanishSpanish AmericanSpanish American IndianSri LankanSubsaharan AfricanSudaneseSwedishSwissSyrianTaiwaneseThaiTlingit-HaidaTohono O'OdhamTonganTrinidadian and TobagonianTsimshianTurkishU.S. Virgin IslanderUgandanUkrainianUruguayanUteVenezuelanVietnameseWelshWest IndianYakamaYaquiYugoslavianYumanYup'ikZimbabwean
Immigration
NonimmigrantsImmigrantsAfghanistanAfricaAlbaniaArgentinaArmeniaAsiaAustraliaAustriaBahamasBangladeshBarbadosBelarusBelgiumBelizeBoliviaBosnia and HerzegovinaBrazilBulgariaBurma/MyanmarCabo VerdeCambodiaCameroonCanadaCaribbeanCentral AmericaChileChinaColombiaCongoCosta RicaCroatiaCubaCzechoslovakiaDenmarkDominicaDominican RepublicEastern AfricaEastern AsiaEastern EuropeEcuadorEgyptEl SalvadorEnglandEritreaEthiopiaEuropeFijiFranceGermanyGhanaGreeceGrenadaGuatemalaGuyanaHaitiHondurasHong KongHungaryIndiaIndonesiaIranIraqIrelandIsraelItalyJamaicaJapanJordanKazakhstanKenyaKoreaKuwaitLaosLatin AmericaLatviaLebanonLiberiaLithuaniaMalaysiaMexicoMicronesiaMiddle AfricaMoldovaMoroccoNepalNetherlandsNicaraguaNigeriaNorth AmericaNorth MacedoniaNorthern AfricaNorthern EuropeNorwayOceaniaPakistanPanamaPeruPhilippinesPolandPortugalRomaniaRussiaSaudi ArabiaScotlandSenegalSerbiaSierra LeoneSingaporeSomaliaSouth AfricaSouth AmericaSouth Central AsiaSouth Eastern AsiaSouthern EuropeSpainSri LankaSt. Vincent and the GrenadinesSudanSwedenSwitzerlandSyriaTaiwanThailandTrinidad and TobagoTurkeyUgandaUkraineUruguayUzbekistanVenezuelaVietnamWest IndiesWestern AfricaWestern AsiaYemenZaireZimbabweAzores
Disability Age Under 5
Income
Poverty
Unemployment
Labor Participation
Family Structure
Vehicle Availability
Education Level
Disability

Immigrants from Western Europe Disability Age Under 5
Tragic

1.4%
DISABILITY | AGE UNDER 5
0.5/ 100
METRIC RATING
256th/ 347
METRIC RANK

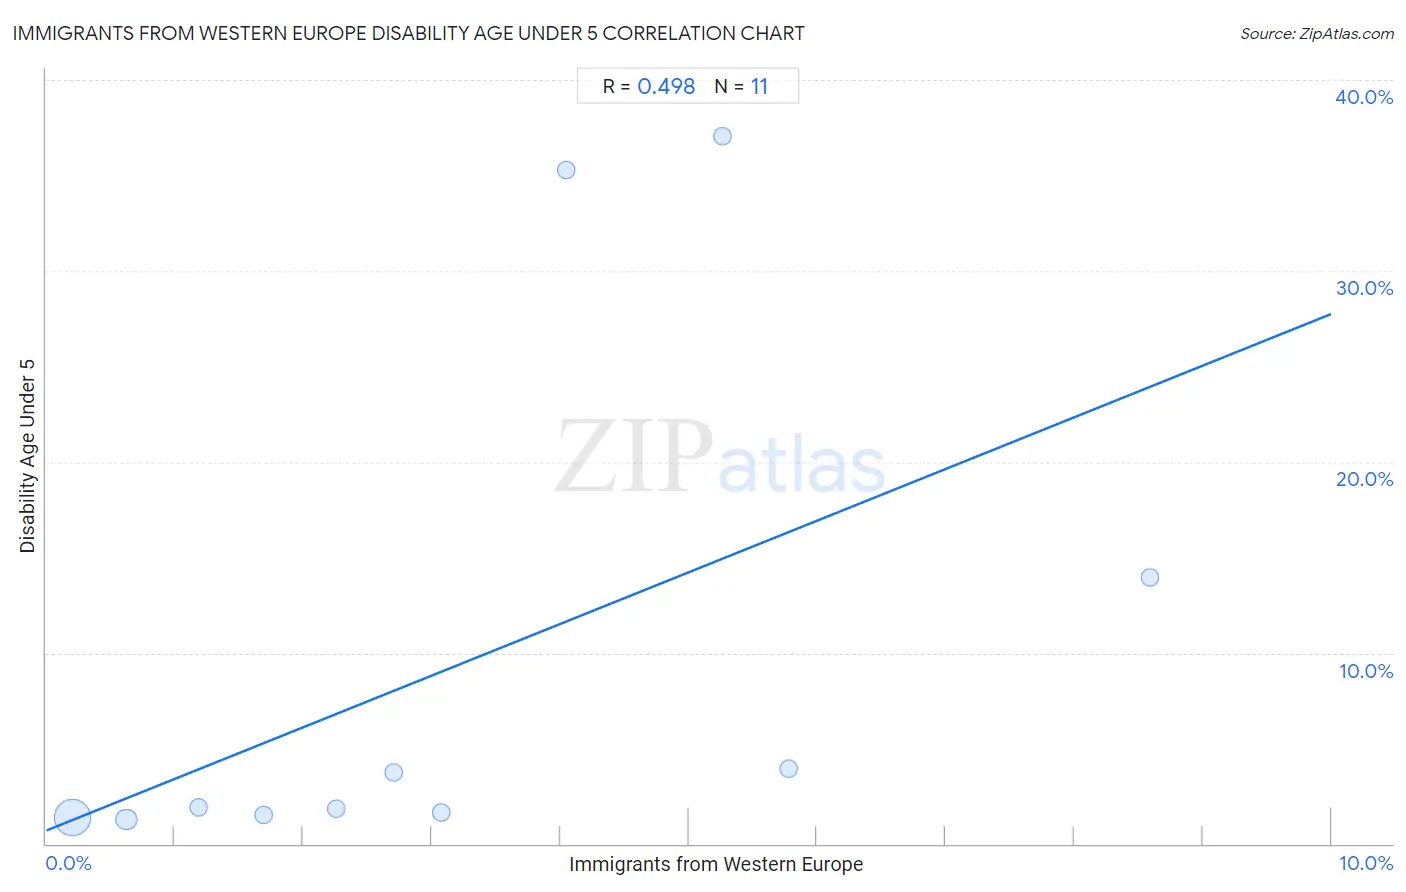
Immigrants from Western Europe Disability Age Under 5 Correlation Chart

The statistical analysis conducted on geographies consisting of 244,253,357 people shows a moderate positive correlation between the proportion of Immigrants from Western Europe and percentage of population with a disability under the age of 5 in the United States with a correlation coefficient (R) of 0.498 and weighted average of 1.4%. On average, for every 1% (one percent) increase in Immigrants from Western Europe within a typical geography, there is an increase of 2.7% in percentage of population with a disability under the age of 5.
Immigrants from Western Europe Disability Age Under 5
It is essential to understand that the correlation between the percentage of Immigrants from Western Europe and percentage of population with a disability under the age of 5 does not imply a direct cause-and-effect relationship. It remains uncertain whether the presence of Immigrants from Western Europe influences an upward or downward trend in the level of percentage of population with a disability under the age of 5 within an area, or if Immigrants from Western Europe simply ended up residing in those areas with higher or lower levels of percentage of population with a disability under the age of 5 due to other factors.

Demographics Similar to Immigrants from Western Europe by Disability Age Under 5

In terms of disability age under 5, the demographic groups most similar to Immigrants from Western Europe are Immigrants from Liberia (1.4%, a difference of 0.42%), Immigrants from Brazil (1.4%, a difference of 0.48%), Australian (1.4%, a difference of 0.56%), Slovene (1.4%, a difference of 0.89%), and Costa Rican (1.4%, a difference of 1.1%).
DemographicsRating | RankDisability Age Under 5
Bermudans
1.0
/100
|
#249
Tragic
1.4%
Africans
1.0
/100
|
#250
Tragic
1.4%
Immigrants from Hungary
1.0
/100
|
#251
Tragic
1.4%
Immigrants from Scotland
0.9
/100
|
#252
Tragic
1.4%
Australians
0.7
/100
|
#253
Tragic
1.4%
Immigrants from Brazil
0.7
/100
|
#254
Tragic
1.4%
Immigrants from Liberia
0.6
/100
|
#255
Tragic
1.4%
Immigrants from Western Europe
0.5
/100
|
#256
Tragic
1.4%
Slovenes
0.3
/100
|
#257
Tragic
1.4%
Costa Ricans
0.3
/100
|
#258
Tragic
1.4%
Immigrants from Southern Europe
0.3
/100
|
#259
Tragic
1.4%
Slavs
0.3
/100
|
#260
Tragic
1.4%
Immigrants from Netherlands
0.2
/100
|
#261
Tragic
1.4%
Immigrants from Dominica
0.2
/100
|
#262
Tragic
1.4%
Spanish
0.2
/100
|
#263
Tragic
1.4%

Immigrants from Western Europe Disability Age Under 5 Correlation Summary

MeasurementImmigrants from Western Europe DataDisability Age Under 5 Data
Minimum0.21%1.3%
Maximum8.6%37.0%
Range8.4%35.8%
Mean3.2%9.4%
Median2.7%1.9%
Interquartile 25% (IQ1)1.2%1.5%
Interquartile 75% (IQ3)5.3%14.0%
Interquartile Range (IQR)4.1%12.4%
Standard Deviation (Sample)2.5%13.7%
Standard Deviation (Population)2.4%13.1%

Correlation Details

Immigrants from Western Europe PercentileSample SizeDisability Age Under 5
[
0.0%
-
0.5%
]
0.21%
202,271,7181.3%
[
0.5%
-
1.0%
]
0.62%
36,932,5261.3%
[
1.0%
-
1.5%
]
1.18%
3,519,3271.9%
[
1.5%
-
2.0%
]
1.69%
1,132,6801.5%
[
2.0%
-
2.5%
]
2.26%
292,3161.8%
[
2.5%
-
3.0%
]
2.71%
62,0503.7%
[
3.0%
-
3.5%
]
3.07%
33,7861.7%
[
4.0%
-
4.5%
]
4.04%
3,83335.3%
[
5.0%
-
5.5%
]
5.27%
2,46937.0%
[
5.5%
-
6.0%
]
5.78%
2773.9%
[
8.5%
-
9.0%
]
8.59%
2,37514.0%