Immigrants from France Disability Age Under 5
COMPARE
Immigrants from France
Select to Compare
Disability Age Under 5
Immigrants from France Disability Age Under 5
1.2%
DISABILITY | AGE UNDER 5
88.4/ 100
METRIC RATING
128th/ 347
METRIC RANK
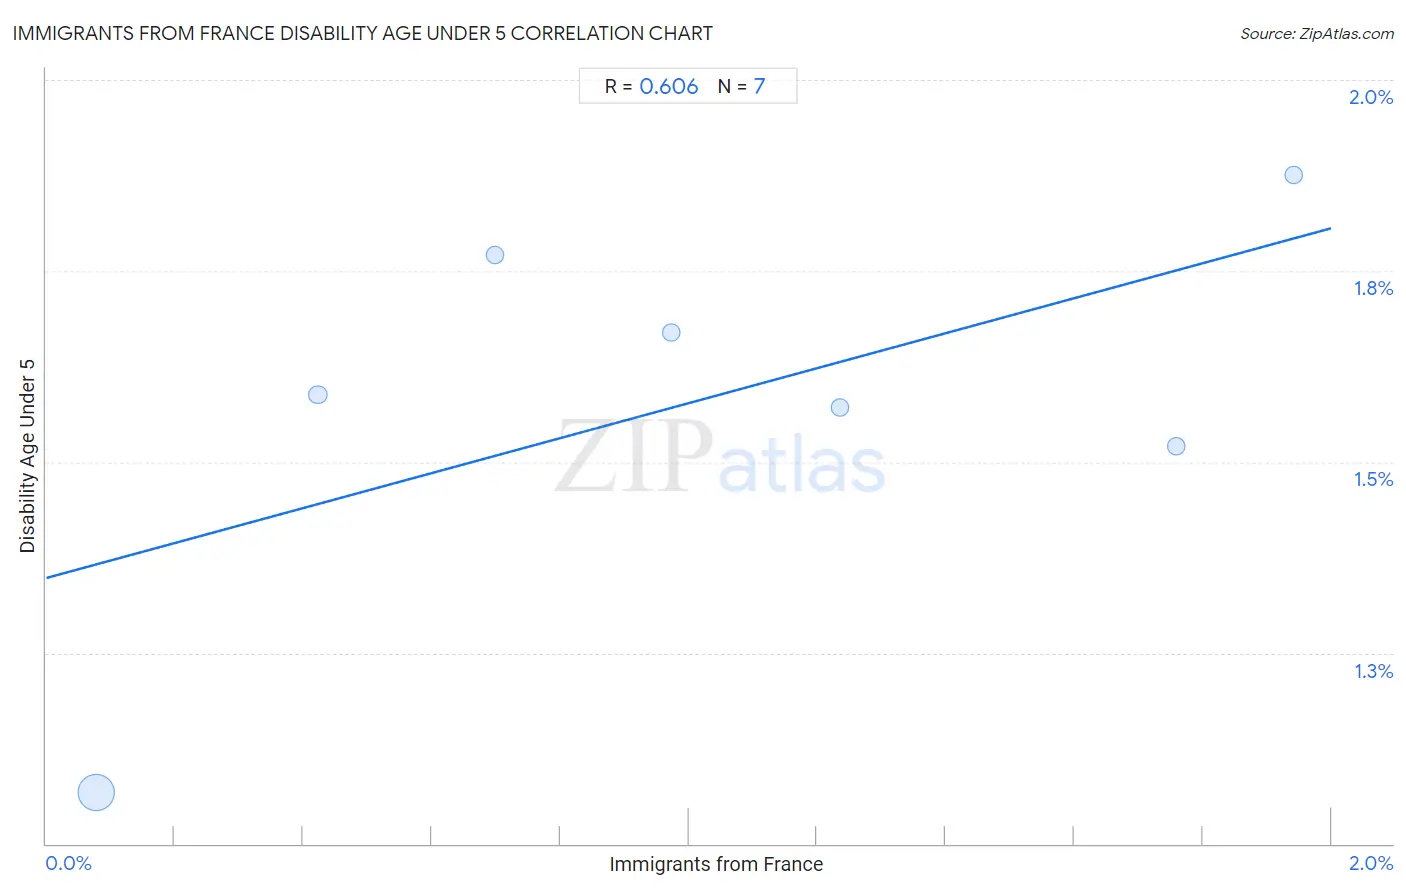
Immigrants from France Disability Age Under 5 Correlation Chart
The statistical analysis conducted on geographies consisting of 171,123,131 people shows a significant positive correlation between the proportion of Immigrants from France and percentage of population with a disability under the age of 5 in the United States with a correlation coefficient (R) of 0.606 and weighted average of 1.2%. On average, for every 1% (one percent) increase in Immigrants from France within a typical geography, there is an increase of 0.23% in percentage of population with a disability under the age of 5.
It is essential to understand that the correlation between the percentage of Immigrants from France and percentage of population with a disability under the age of 5 does not imply a direct cause-and-effect relationship. It remains uncertain whether the presence of Immigrants from France influences an upward or downward trend in the level of percentage of population with a disability under the age of 5 within an area, or if Immigrants from France simply ended up residing in those areas with higher or lower levels of percentage of population with a disability under the age of 5 due to other factors.
Demographics Similar to Immigrants from France by Disability Age Under 5
In terms of disability age under 5, the demographic groups most similar to Immigrants from France are Immigrants from Romania (1.2%, a difference of 0.0%), Immigrants (1.2%, a difference of 0.090%), Korean (1.2%, a difference of 0.17%), Immigrants from Serbia (1.2%, a difference of 0.19%), and Immigrants from Eastern Europe (1.2%, a difference of 0.25%).
| Demographics | Rating | Rank | Disability Age Under 5 |
| Immigrants from Senegal | 91.4 /100 | #121 | Exceptional 1.2% |
| Aleuts | 90.7 /100 | #122 | Exceptional 1.2% |
| Zimbabweans | 90.6 /100 | #123 | Exceptional 1.2% |
| Immigrants from Cambodia | 90.5 /100 | #124 | Exceptional 1.2% |
| Japanese | 90.3 /100 | #125 | Exceptional 1.2% |
| Central Americans | 89.7 /100 | #126 | Excellent 1.2% |
| Immigrants from Romania | 88.4 /100 | #127 | Excellent 1.2% |
| Immigrants from France | 88.4 /100 | #128 | Excellent 1.2% |
| Immigrants | 88.0 /100 | #129 | Excellent 1.2% |
| Koreans | 87.7 /100 | #130 | Excellent 1.2% |
| Immigrants from Serbia | 87.6 /100 | #131 | Excellent 1.2% |
| Immigrants from Eastern Europe | 87.3 /100 | #132 | Excellent 1.2% |
| Immigrants from Spain | 86.5 /100 | #133 | Excellent 1.2% |
| Argentineans | 85.7 /100 | #134 | Excellent 1.2% |
| Fijians | 84.7 /100 | #135 | Excellent 1.2% |
Immigrants from France Disability Age Under 5 Correlation Summary
| Measurement | Immigrants from France Data | Disability Age Under 5 Data |
| Minimum | 0.078% | 1.1% |
| Maximum | 1.9% | 1.9% |
| Range | 1.9% | 0.81% |
| Mean | 1.0% | 1.6% |
| Median | 0.97% | 1.6% |
| Interquartile 25% (IQ1) | 0.42% | 1.5% |
| Interquartile 75% (IQ3) | 1.8% | 1.8% |
| Interquartile Range (IQR) | 1.3% | 0.25% |
| Standard Deviation (Sample) | 0.68% | 0.26% |
| Standard Deviation (Population) | 0.63% | 0.24% |
Correlation Details
| Immigrants from France Percentile | Sample Size | Disability Age Under 5 |
[ 0.0% - 0.5% ] 0.078% | 164,734,736 | 1.1% |
[ 0.0% - 0.5% ] 0.42% | 5,039,346 | 1.6% |
[ 0.5% - 1.0% ] 0.70% | 869,835 | 1.8% |
[ 0.5% - 1.0% ] 0.97% | 286,270 | 1.7% |
[ 1.0% - 1.5% ] 1.23% | 127,799 | 1.6% |
[ 1.5% - 2.0% ] 1.76% | 33,670 | 1.5% |
[ 1.5% - 2.0% ] 1.94% | 31,475 | 1.9% |