Immigrants from St. Vincent and the Grenadines Disability Age Under 5

COMPARE

Immigrants from St. Vincent and the Grenadines
Race
Ancestry
AfghanAfricanAlaska NativeAlaskan AthabascanAlbanianAleutAlsatianAmericanApacheArabArapahoArgentineanArmenianAssyrian/Chaldean/SyriacAustralianAustrianBahamianBangladeshiBarbadianBasqueBelgianBelizeanBermudanBhutaneseBlackfeetBolivianBrazilianBritishBritish West IndianBulgarianBurmeseCajunCambodianCanadianCape VerdeanCarpatho RusynCelticCentral AmericanCentral American IndianCherokeeCheyenneChickasawChileanChineseChippewaChoctawColombianColvilleComancheCosta RicanCreeCreekCroatianCrowCubanCypriotCzechCzechoslovakianDanishDelawareDominicanDutchDutch West IndianEastern EuropeanEcuadorianEgyptianEnglishEstonianEthiopianEuropeanFijianFilipinoFinnishFrenchFrench American IndianFrench CanadianGermanGerman RussianGhanaianGreekGuamanian/ChamorroGuatemalanGuyaneseHaitianHmongHonduranHopiHoumaHungarianIcelanderIndian (Asian)IndonesianInupiatIranianIraqiIrishIroquoisIsraeliItalianJamaicanJapaneseJordanianKenyanKiowaKoreanLaotianLatvianLebaneseLiberianLithuanianLumbeeLuxembourgerMacedonianMalaysianMalteseMarshalleseMenomineeMexicanMexican American IndianMongolianMoroccanNative HawaiianNavajoNepaleseNew ZealanderNicaraguanNigerianNorthern EuropeanNorwegianOkinawanOsageOttawaPaiutePakistaniPalestinianPanamanianParaguayanPennsylvania GermanPeruvianPimaPolishPortuguesePotawatomiPuebloPuerto RicanPuget Sound SalishRomanianRussianSalvadoranSamoanScandinavianScotch-IrishScottishSeminoleSenegaleseSerbianShoshoneSierra LeoneanSiouxSlavicSlovakSloveneSomaliSouth AfricanSouth AmericanSouth American IndianSoviet UnionSpaniardSpanishSpanish AmericanSpanish American IndianSri LankanSubsaharan AfricanSudaneseSwedishSwissSyrianTaiwaneseThaiTlingit-HaidaTohono O'OdhamTonganTrinidadian and TobagonianTsimshianTurkishU.S. Virgin IslanderUgandanUkrainianUruguayanUteVenezuelanVietnameseWelshWest IndianYakamaYaquiYugoslavianYumanYup'ikZimbabwean
Immigration
NonimmigrantsImmigrantsAfghanistanAfricaAlbaniaArgentinaArmeniaAsiaAustraliaAustriaBahamasBangladeshBarbadosBelarusBelgiumBelizeBoliviaBosnia and HerzegovinaBrazilBulgariaBurma/MyanmarCabo VerdeCambodiaCameroonCanadaCaribbeanCentral AmericaChileChinaColombiaCongoCosta RicaCroatiaCubaCzechoslovakiaDenmarkDominicaDominican RepublicEastern AfricaEastern AsiaEastern EuropeEcuadorEgyptEl SalvadorEnglandEritreaEthiopiaEuropeFijiFranceGermanyGhanaGreeceGrenadaGuatemalaGuyanaHaitiHondurasHong KongHungaryIndiaIndonesiaIranIraqIrelandIsraelItalyJamaicaJapanJordanKazakhstanKenyaKoreaKuwaitLaosLatin AmericaLatviaLebanonLiberiaLithuaniaMalaysiaMexicoMicronesiaMiddle AfricaMoldovaMoroccoNepalNetherlandsNicaraguaNigeriaNorth AmericaNorth MacedoniaNorthern AfricaNorthern EuropeNorwayOceaniaPakistanPanamaPeruPhilippinesPolandPortugalRomaniaRussiaSaudi ArabiaScotlandSenegalSerbiaSierra LeoneSingaporeSomaliaSouth AfricaSouth AmericaSouth Central AsiaSouth Eastern AsiaSouthern EuropeSpainSri LankaSt. Vincent and the GrenadinesSudanSwedenSwitzerlandSyriaTaiwanThailandTrinidad and TobagoTurkeyUgandaUkraineUruguayUzbekistanVenezuelaVietnamWest IndiesWestern AfricaWestern AsiaWestern EuropeYemenZaireZimbabweAzores
Select to Compare
Race
Ancestry
AfghanAfricanAlaska NativeAlaskan AthabascanAlbanianAleutAlsatianAmericanApacheArabArapahoArgentineanArmenianAssyrian/Chaldean/SyriacAustralianAustrianBahamianBangladeshiBarbadianBasqueBelgianBelizeanBermudanBhutaneseBlackfeetBolivianBrazilianBritishBritish West IndianBulgarianBurmeseCajunCambodianCanadianCape VerdeanCarpatho RusynCelticCentral AmericanCentral American IndianCherokeeCheyenneChickasawChileanChineseChippewaChoctawColombianColvilleComancheCosta RicanCreeCreekCroatianCrowCubanCypriotCzechCzechoslovakianDanishDelawareDominicanDutchDutch West IndianEastern EuropeanEcuadorianEgyptianEnglishEstonianEthiopianEuropeanFijianFilipinoFinnishFrenchFrench American IndianFrench CanadianGermanGerman RussianGhanaianGreekGuamanian/ChamorroGuatemalanGuyaneseHaitianHmongHonduranHopiHoumaHungarianIcelanderIndian (Asian)IndonesianInupiatIranianIraqiIrishIroquoisIsraeliItalianJamaicanJapaneseJordanianKenyanKiowaKoreanLaotianLatvianLebaneseLiberianLithuanianLumbeeLuxembourgerMacedonianMalaysianMalteseMarshalleseMenomineeMexicanMexican American IndianMongolianMoroccanNative HawaiianNavajoNepaleseNew ZealanderNicaraguanNigerianNorthern EuropeanNorwegianOkinawanOsageOttawaPaiutePakistaniPalestinianPanamanianParaguayanPennsylvania GermanPeruvianPimaPolishPortuguesePotawatomiPuebloPuerto RicanPuget Sound SalishRomanianRussianSalvadoranSamoanScandinavianScotch-IrishScottishSeminoleSenegaleseSerbianShoshoneSierra LeoneanSiouxSlavicSlovakSloveneSomaliSouth AfricanSouth AmericanSouth American IndianSoviet UnionSpaniardSpanishSpanish AmericanSpanish American IndianSri LankanSubsaharan AfricanSudaneseSwedishSwissSyrianTaiwaneseThaiTlingit-HaidaTohono O'OdhamTonganTrinidadian and TobagonianTsimshianTurkishU.S. Virgin IslanderUgandanUkrainianUruguayanUteVenezuelanVietnameseWelshWest IndianYakamaYaquiYugoslavianYumanYup'ikZimbabwean
Immigration
NonimmigrantsImmigrantsAfghanistanAfricaAlbaniaArgentinaArmeniaAsiaAustraliaAustriaBahamasBangladeshBarbadosBelarusBelgiumBelizeBoliviaBosnia and HerzegovinaBrazilBulgariaBurma/MyanmarCabo VerdeCambodiaCameroonCanadaCaribbeanCentral AmericaChileChinaColombiaCongoCosta RicaCroatiaCubaCzechoslovakiaDenmarkDominicaDominican RepublicEastern AfricaEastern AsiaEastern EuropeEcuadorEgyptEl SalvadorEnglandEritreaEthiopiaEuropeFijiFranceGermanyGhanaGreeceGrenadaGuatemalaGuyanaHaitiHondurasHong KongHungaryIndiaIndonesiaIranIraqIrelandIsraelItalyJamaicaJapanJordanKazakhstanKenyaKoreaKuwaitLaosLatin AmericaLatviaLebanonLiberiaLithuaniaMalaysiaMexicoMicronesiaMiddle AfricaMoldovaMoroccoNepalNetherlandsNicaraguaNigeriaNorth AmericaNorth MacedoniaNorthern AfricaNorthern EuropeNorwayOceaniaPakistanPanamaPeruPhilippinesPolandPortugalRomaniaRussiaSaudi ArabiaScotlandSenegalSerbiaSierra LeoneSingaporeSomaliaSouth AfricaSouth AmericaSouth Central AsiaSouth Eastern AsiaSouthern EuropeSpainSri LankaSudanSwedenSwitzerlandSyriaTaiwanThailandTrinidad and TobagoTurkeyUgandaUkraineUruguayUzbekistanVenezuelaVietnamWest IndiesWestern AfricaWestern AsiaWestern EuropeYemenZaireZimbabweAzores
Disability Age Under 5
Income
Poverty
Unemployment
Labor Participation
Family Structure
Vehicle Availability
Education Level
Disability

Immigrants from St. Vincent and the Grenadines Disability Age Under 5
Exceptional

0.79%
DISABILITY | AGE UNDER 5
100.0/ 100
METRIC RATING
2nd/ 347
METRIC RANK

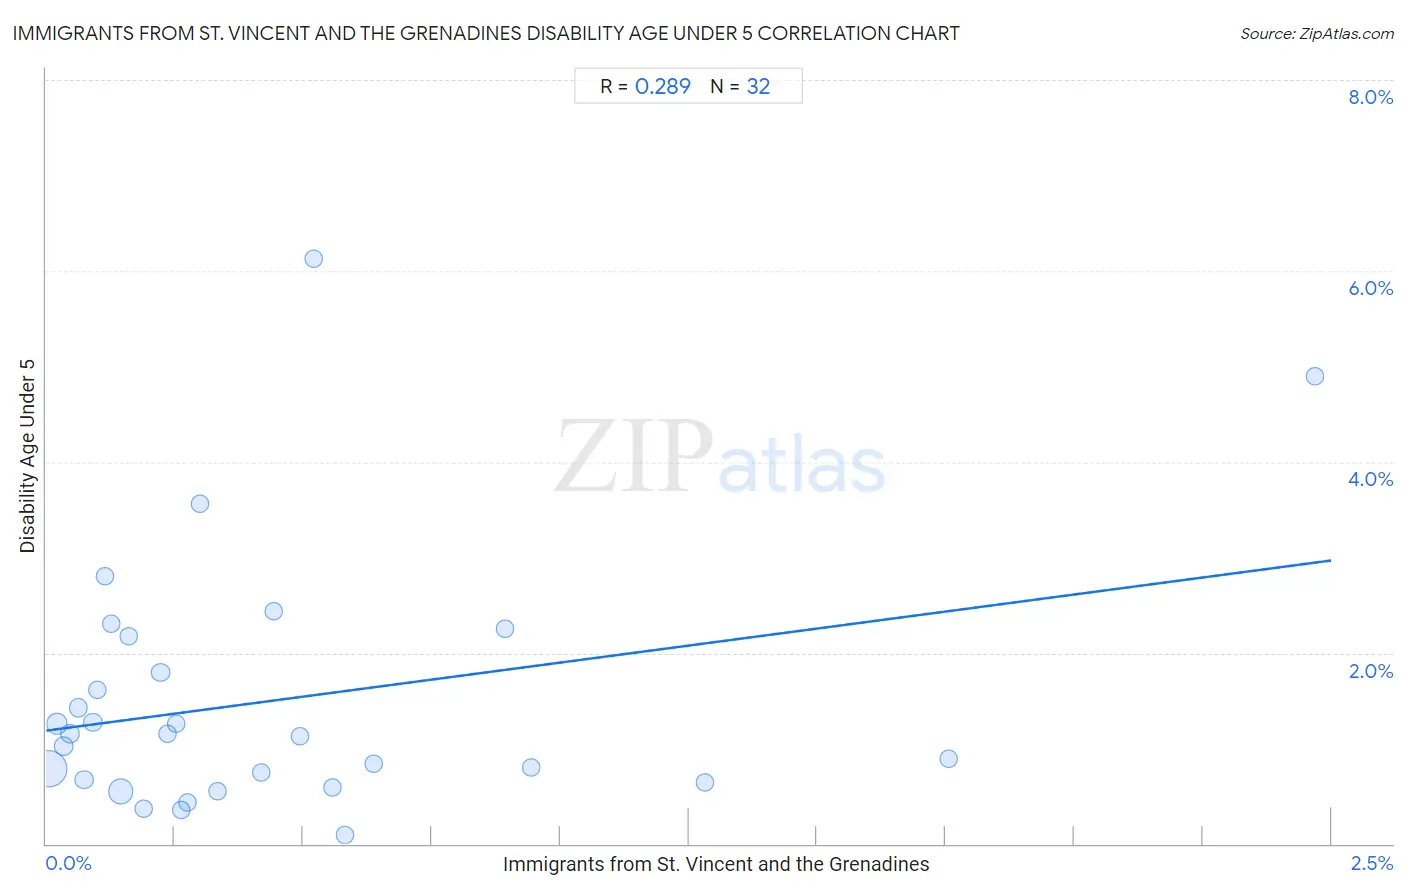
Immigrants from St. Vincent and the Grenadines Disability Age Under 5 Correlation Chart

The statistical analysis conducted on geographies consisting of 43,198,055 people shows a weak positive correlation between the proportion of Immigrants from St. Vincent and the Grenadines and percentage of population with a disability under the age of 5 in the United States with a correlation coefficient (R) of 0.289 and weighted average of 0.79%. On average, for every 1% (one percent) increase in Immigrants from St. Vincent and the Grenadines within a typical geography, there is an increase of 0.71% in percentage of population with a disability under the age of 5.
Immigrants from St. Vincent and the Grenadines Disability Age Under 5
It is essential to understand that the correlation between the percentage of Immigrants from St. Vincent and the Grenadines and percentage of population with a disability under the age of 5 does not imply a direct cause-and-effect relationship. It remains uncertain whether the presence of Immigrants from St. Vincent and the Grenadines influences an upward or downward trend in the level of percentage of population with a disability under the age of 5 within an area, or if Immigrants from St. Vincent and the Grenadines simply ended up residing in those areas with higher or lower levels of percentage of population with a disability under the age of 5 due to other factors.

Demographics Similar to Immigrants from St. Vincent and the Grenadines by Disability Age Under 5

In terms of disability age under 5, the demographic groups most similar to Immigrants from St. Vincent and the Grenadines are Vietnamese (0.81%, a difference of 3.2%), Immigrants from Armenia (0.76%, a difference of 4.1%), Immigrants from Uzbekistan (0.85%, a difference of 7.9%), Immigrants from Bangladesh (0.85%, a difference of 8.4%), and Ute (0.86%, a difference of 9.4%).
DemographicsRating | RankDisability Age Under 5
Immigrants from Armenia
100.0
/100
|
#1
Exceptional
0.76%
Immigrants from St. Vincent and the Grenadines
100.0
/100
|
#2
Exceptional
0.79%
Vietnamese
100.0
/100
|
#3
Exceptional
0.81%
Immigrants from Uzbekistan
100.0
/100
|
#4
Exceptional
0.85%
Immigrants from Bangladesh
100.0
/100
|
#5
Exceptional
0.85%
Ute
100.0
/100
|
#6
Exceptional
0.86%
Immigrants from Afghanistan
100.0
/100
|
#7
Exceptional
0.91%
Immigrants from Yemen
100.0
/100
|
#8
Exceptional
0.91%
Immigrants from Fiji
100.0
/100
|
#9
Exceptional
0.92%
Marshallese
100.0
/100
|
#10
Exceptional
0.94%
Afghans
100.0
/100
|
#11
Exceptional
0.94%
Immigrants from Grenada
100.0
/100
|
#12
Exceptional
0.94%
Soviet Union
100.0
/100
|
#13
Exceptional
0.95%
Yuman
100.0
/100
|
#14
Exceptional
0.95%
Immigrants from Hong Kong
100.0
/100
|
#15
Exceptional
0.95%

Immigrants from St. Vincent and the Grenadines Disability Age Under 5 Correlation Summary

MeasurementImmigrants from St. Vincent and the Grenadines DataDisability Age Under 5 Data
Minimum0.0037%0.086%
Maximum2.5%6.1%
Range2.5%6.0%
Mean0.44%1.5%
Median0.26%1.1%
Interquartile 25% (IQ1)0.11%0.66%
Interquartile 75% (IQ3)0.54%2.0%
Interquartile Range (IQR)0.43%1.3%
Standard Deviation (Sample)0.54%1.3%
Standard Deviation (Population)0.53%1.3%

Correlation Details

Immigrants from St. Vincent and the Grenadines PercentileSample SizeDisability Age Under 5
[
0.0%
-
0.5%
]
0.0037%
22,864,4840.78%
[
0.0%
-
0.5%
]
0.021%
4,355,1571.3%
[
0.0%
-
0.5%
]
0.033%
1,729,1531.0%
[
0.0%
-
0.5%
]
0.046%
1,616,8941.2%
[
0.0%
-
0.5%
]
0.062%
1,017,0311.4%
[
0.0%
-
0.5%
]
0.074%
663,4360.67%
[
0.0%
-
0.5%
]
0.091%
430,8271.3%
[
0.0%
-
0.5%
]
0.099%
375,0091.6%
[
0.0%
-
0.5%
]
0.11%
115,1452.8%
[
0.0%
-
0.5%
]
0.13%
25,1782.3%
[
0.0%
-
0.5%
]
0.15%
8,806,4440.54%
[
0.0%
-
0.5%
]
0.16%
34,2252.2%
[
0.0%
-
0.5%
]
0.19%
133,8010.36%
[
0.0%
-
0.5%
]
0.22%
126,7651.8%
[
0.0%
-
0.5%
]
0.24%
30,9731.1%
[
0.0%
-
0.5%
]
0.25%
121,9611.3%
[
0.0%
-
0.5%
]
0.26%
14,8830.36%
[
0.0%
-
0.5%
]
0.27%
58,0470.43%
[
0.0%
-
0.5%
]
0.30%
27,8453.6%
[
0.0%
-
0.5%
]
0.33%
40,1600.55%
[
0.0%
-
0.5%
]
0.42%
60,6000.74%
[
0.0%
-
0.5%
]
0.44%
69,0902.4%
[
0.0%
-
0.5%
]
0.49%
44,8321.1%
[
0.5%
-
1.0%
]
0.52%
2,1116.1%
[
0.5%
-
1.0%
]
0.56%
58,4760.59%
[
0.5%
-
1.0%
]
0.58%
89,9760.086%
[
0.5%
-
1.0%
]
0.64%
27,8080.83%
[
0.5%
-
1.0%
]
0.89%
15,0012.2%
[
0.5%
-
1.0%
]
0.94%
62,3730.80%
[
1.0%
-
1.5%
]
1.28%
100,0820.65%
[
1.5%
-
2.0%
]
1.76%
78,5060.89%
[
2.0%
-
2.5%
]
2.47%
1,7824.9%