Serbian Disability Age Under 5

COMPARE

Serbian
Race
Ancestry
AfghanAfricanAlaska NativeAlaskan AthabascanAlbanianAleutAlsatianAmericanApacheArabArapahoArgentineanArmenianAssyrian/Chaldean/SyriacAustralianAustrianBahamianBangladeshiBarbadianBasqueBelgianBelizeanBermudanBhutaneseBlackfeetBolivianBrazilianBritishBritish West IndianBulgarianBurmeseCajunCambodianCanadianCape VerdeanCarpatho RusynCelticCentral AmericanCentral American IndianCherokeeCheyenneChickasawChileanChineseChippewaChoctawColombianColvilleComancheCosta RicanCreeCreekCroatianCrowCubanCypriotCzechCzechoslovakianDanishDelawareDominicanDutchDutch West IndianEastern EuropeanEcuadorianEgyptianEnglishEstonianEthiopianEuropeanFijianFilipinoFinnishFrenchFrench American IndianFrench CanadianGermanGerman RussianGhanaianGreekGuamanian/ChamorroGuatemalanGuyaneseHaitianHmongHonduranHopiHoumaHungarianIcelanderIndian (Asian)IndonesianInupiatIranianIraqiIrishIroquoisIsraeliItalianJamaicanJapaneseJordanianKenyanKiowaKoreanLaotianLatvianLebaneseLiberianLithuanianLumbeeLuxembourgerMacedonianMalaysianMalteseMarshalleseMenomineeMexicanMexican American IndianMongolianMoroccanNative HawaiianNavajoNepaleseNew ZealanderNicaraguanNigerianNorthern EuropeanNorwegianOkinawanOsageOttawaPaiutePakistaniPalestinianPanamanianParaguayanPennsylvania GermanPeruvianPimaPolishPortuguesePotawatomiPuebloPuerto RicanPuget Sound SalishRomanianRussianSalvadoranSamoanScandinavianScotch-IrishScottishSeminoleSenegaleseSerbianShoshoneSierra LeoneanSiouxSlavicSlovakSloveneSomaliSouth AfricanSouth AmericanSouth American IndianSoviet UnionSpaniardSpanishSpanish AmericanSpanish American IndianSri LankanSubsaharan AfricanSudaneseSwedishSwissSyrianTaiwaneseThaiTlingit-HaidaTohono O'OdhamTonganTrinidadian and TobagonianTsimshianTurkishU.S. Virgin IslanderUgandanUkrainianUruguayanUteVenezuelanVietnameseWelshWest IndianYakamaYaquiYugoslavianYumanYup'ikZimbabwean
Immigration
NonimmigrantsImmigrantsAfghanistanAfricaAlbaniaArgentinaArmeniaAsiaAustraliaAustriaBahamasBangladeshBarbadosBelarusBelgiumBelizeBoliviaBosnia and HerzegovinaBrazilBulgariaBurma/MyanmarCabo VerdeCambodiaCameroonCanadaCaribbeanCentral AmericaChileChinaColombiaCongoCosta RicaCroatiaCubaCzechoslovakiaDenmarkDominicaDominican RepublicEastern AfricaEastern AsiaEastern EuropeEcuadorEgyptEl SalvadorEnglandEritreaEthiopiaEuropeFijiFranceGermanyGhanaGreeceGrenadaGuatemalaGuyanaHaitiHondurasHong KongHungaryIndiaIndonesiaIranIraqIrelandIsraelItalyJamaicaJapanJordanKazakhstanKenyaKoreaKuwaitLaosLatin AmericaLatviaLebanonLiberiaLithuaniaMalaysiaMexicoMicronesiaMiddle AfricaMoldovaMoroccoNepalNetherlandsNicaraguaNigeriaNorth AmericaNorth MacedoniaNorthern AfricaNorthern EuropeNorwayOceaniaPakistanPanamaPeruPhilippinesPolandPortugalRomaniaRussiaSaudi ArabiaScotlandSenegalSerbiaSierra LeoneSingaporeSomaliaSouth AfricaSouth AmericaSouth Central AsiaSouth Eastern AsiaSouthern EuropeSpainSri LankaSt. Vincent and the GrenadinesSudanSwedenSwitzerlandSyriaTaiwanThailandTrinidad and TobagoTurkeyUgandaUkraineUruguayUzbekistanVenezuelaVietnamWest IndiesWestern AfricaWestern AsiaWestern EuropeYemenZaireZimbabweAzores
Select to Compare
Race
Ancestry
AfghanAfricanAlaska NativeAlaskan AthabascanAlbanianAleutAlsatianAmericanApacheArabArapahoArgentineanArmenianAssyrian/Chaldean/SyriacAustralianAustrianBahamianBangladeshiBarbadianBasqueBelgianBelizeanBermudanBhutaneseBlackfeetBolivianBrazilianBritishBritish West IndianBulgarianBurmeseCajunCambodianCanadianCape VerdeanCarpatho RusynCelticCentral AmericanCentral American IndianCherokeeCheyenneChickasawChileanChineseChippewaChoctawColombianColvilleComancheCosta RicanCreeCreekCroatianCrowCubanCypriotCzechCzechoslovakianDanishDelawareDominicanDutchDutch West IndianEastern EuropeanEcuadorianEgyptianEnglishEstonianEthiopianEuropeanFijianFilipinoFinnishFrenchFrench American IndianFrench CanadianGermanGerman RussianGhanaianGreekGuamanian/ChamorroGuatemalanGuyaneseHaitianHmongHonduranHopiHoumaHungarianIcelanderIndian (Asian)IndonesianInupiatIranianIraqiIrishIroquoisIsraeliItalianJamaicanJapaneseJordanianKenyanKiowaKoreanLaotianLatvianLebaneseLiberianLithuanianLumbeeLuxembourgerMacedonianMalaysianMalteseMarshalleseMenomineeMexicanMexican American IndianMongolianMoroccanNative HawaiianNavajoNepaleseNew ZealanderNicaraguanNigerianNorthern EuropeanNorwegianOkinawanOsageOttawaPaiutePakistaniPalestinianPanamanianParaguayanPennsylvania GermanPeruvianPimaPolishPortuguesePotawatomiPuebloPuerto RicanPuget Sound SalishRomanianRussianSalvadoranSamoanScandinavianScotch-IrishScottishSeminoleSenegaleseShoshoneSierra LeoneanSiouxSlavicSlovakSloveneSomaliSouth AfricanSouth AmericanSouth American IndianSoviet UnionSpaniardSpanishSpanish AmericanSpanish American IndianSri LankanSubsaharan AfricanSudaneseSwedishSwissSyrianTaiwaneseThaiTlingit-HaidaTohono O'OdhamTonganTrinidadian and TobagonianTsimshianTurkishU.S. Virgin IslanderUgandanUkrainianUruguayanUteVenezuelanVietnameseWelshWest IndianYakamaYaquiYugoslavianYumanYup'ikZimbabwean
Immigration
NonimmigrantsImmigrantsAfghanistanAfricaAlbaniaArgentinaArmeniaAsiaAustraliaAustriaBahamasBangladeshBarbadosBelarusBelgiumBelizeBoliviaBosnia and HerzegovinaBrazilBulgariaBurma/MyanmarCabo VerdeCambodiaCameroonCanadaCaribbeanCentral AmericaChileChinaColombiaCongoCosta RicaCroatiaCubaCzechoslovakiaDenmarkDominicaDominican RepublicEastern AfricaEastern AsiaEastern EuropeEcuadorEgyptEl SalvadorEnglandEritreaEthiopiaEuropeFijiFranceGermanyGhanaGreeceGrenadaGuatemalaGuyanaHaitiHondurasHong KongHungaryIndiaIndonesiaIranIraqIrelandIsraelItalyJamaicaJapanJordanKazakhstanKenyaKoreaKuwaitLaosLatin AmericaLatviaLebanonLiberiaLithuaniaMalaysiaMexicoMicronesiaMiddle AfricaMoldovaMoroccoNepalNetherlandsNicaraguaNigeriaNorth AmericaNorth MacedoniaNorthern AfricaNorthern EuropeNorwayOceaniaPakistanPanamaPeruPhilippinesPolandPortugalRomaniaRussiaSaudi ArabiaScotlandSenegalSerbiaSierra LeoneSingaporeSomaliaSouth AfricaSouth AmericaSouth Central AsiaSouth Eastern AsiaSouthern EuropeSpainSri LankaSt. Vincent and the GrenadinesSudanSwedenSwitzerlandSyriaTaiwanThailandTrinidad and TobagoTurkeyUgandaUkraineUruguayUzbekistanVenezuelaVietnamWest IndiesWestern AfricaWestern AsiaWestern EuropeYemenZaireZimbabweAzores
Disability Age Under 5
Income
Poverty
Unemployment
Labor Participation
Family Structure
Vehicle Availability
Education Level
Disability

Serbian Disability Age Under 5
Tragic

1.3%
DISABILITY | AGE UNDER 5
9.6/ 100
METRIC RATING
220th/ 347
METRIC RANK

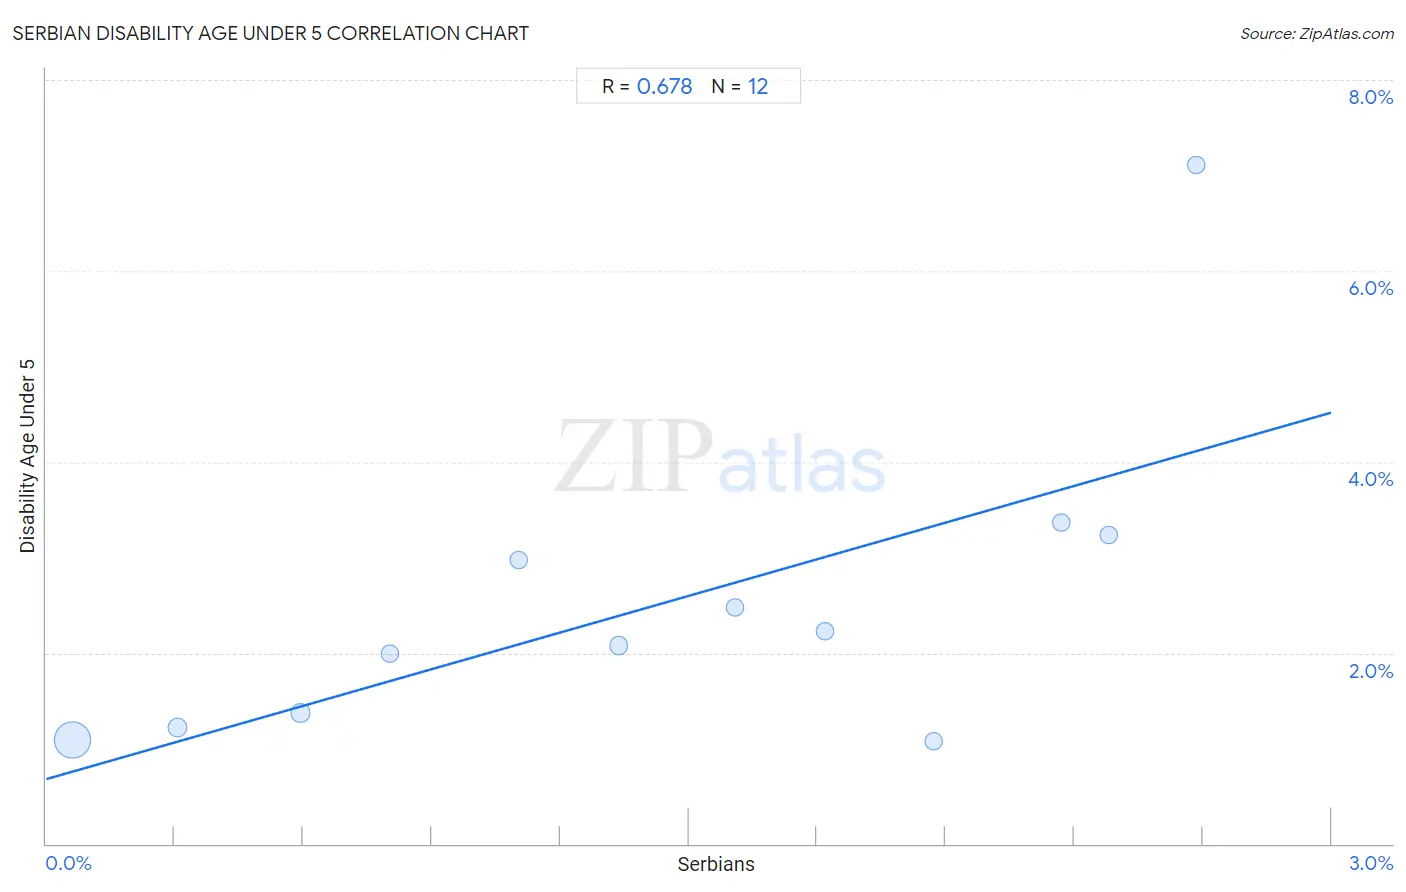
Serbian Disability Age Under 5 Correlation Chart

The statistical analysis conducted on geographies consisting of 160,287,389 people shows a significant positive correlation between the proportion of Serbians and percentage of population with a disability under the age of 5 in the United States with a correlation coefficient (R) of 0.678 and weighted average of 1.3%. On average, for every 1% (one percent) increase in Serbians within a typical geography, there is an increase of 1.3% in percentage of population with a disability under the age of 5.
Serbian Disability Age Under 5
It is essential to understand that the correlation between the percentage of Serbians and percentage of population with a disability under the age of 5 does not imply a direct cause-and-effect relationship. It remains uncertain whether the presence of Serbians influences an upward or downward trend in the level of percentage of population with a disability under the age of 5 within an area, or if Serbians simply ended up residing in those areas with higher or lower levels of percentage of population with a disability under the age of 5 due to other factors.

Demographics Similar to Serbians by Disability Age Under 5

In terms of disability age under 5, the demographic groups most similar to Serbians are Subsaharan African (1.3%, a difference of 0.34%), Ukrainian (1.3%, a difference of 0.34%), Immigrants from Croatia (1.3%, a difference of 0.37%), Hispanic or Latino (1.3%, a difference of 0.53%), and Latvian (1.3%, a difference of 0.69%).
DemographicsRating | RankDisability Age Under 5
Immigrants from Sudan
18.7
/100
|
#213
Poor
1.3%
Immigrants from Chile
17.2
/100
|
#214
Poor
1.3%
Syrians
16.1
/100
|
#215
Poor
1.3%
Bangladeshis
15.5
/100
|
#216
Poor
1.3%
Cypriots
14.9
/100
|
#217
Poor
1.3%
Malaysians
13.2
/100
|
#218
Poor
1.3%
Immigrants from Croatia
11.2
/100
|
#219
Poor
1.3%
Serbians
9.6
/100
|
#220
Tragic
1.3%
Sub-Saharan Africans
8.3
/100
|
#221
Tragic
1.3%
Ukrainians
8.3
/100
|
#222
Tragic
1.3%
Hispanics or Latinos
7.7
/100
|
#223
Tragic
1.3%
Latvians
7.1
/100
|
#224
Tragic
1.3%
Panamanians
7.1
/100
|
#225
Tragic
1.3%
Bahamians
7.1
/100
|
#226
Tragic
1.3%
Taiwanese
6.1
/100
|
#227
Tragic
1.3%

Serbian Disability Age Under 5 Correlation Summary

MeasurementSerbian DataDisability Age Under 5 Data
Minimum0.061%1.1%
Maximum2.7%7.1%
Range2.6%6.0%
Mean1.4%2.5%
Median1.5%2.1%
Interquartile 25% (IQ1)0.70%1.3%
Interquartile 75% (IQ3)2.2%3.1%
Interquartile Range (IQR)1.5%1.8%
Standard Deviation (Sample)0.88%1.7%
Standard Deviation (Population)0.84%1.6%

Correlation Details

Serbian PercentileSample SizeDisability Age Under 5
[
0.0%
-
0.5%
]
0.061%
146,114,3561.1%
[
0.0%
-
0.5%
]
0.31%
10,331,3911.2%
[
0.5%
-
1.0%
]
0.59%
2,122,1741.4%
[
0.5%
-
1.0%
]
0.80%
696,2112.0%
[
1.0%
-
1.5%
]
1.10%
484,7493.0%
[
1.0%
-
1.5%
]
1.34%
163,5402.1%
[
1.5%
-
2.0%
]
1.61%
65,5522.5%
[
1.5%
-
2.0%
]
1.82%
203,1552.2%
[
2.0%
-
2.5%
]
2.07%
60,1351.1%
[
2.0%
-
2.5%
]
2.37%
3,5013.4%
[
2.0%
-
2.5%
]
2.48%
38,7153.2%
[
2.5%
-
3.0%
]
2.69%
3,9107.1%