Honduran Disability Age Under 5

COMPARE

Honduran
Race
Ancestry
AfghanAfricanAlaska NativeAlaskan AthabascanAlbanianAleutAlsatianAmericanApacheArabArapahoArgentineanArmenianAssyrian/Chaldean/SyriacAustralianAustrianBahamianBangladeshiBarbadianBasqueBelgianBelizeanBermudanBhutaneseBlackfeetBolivianBrazilianBritishBritish West IndianBulgarianBurmeseCajunCambodianCanadianCape VerdeanCarpatho RusynCelticCentral AmericanCentral American IndianCherokeeCheyenneChickasawChileanChineseChippewaChoctawColombianColvilleComancheCosta RicanCreeCreekCroatianCrowCubanCypriotCzechCzechoslovakianDanishDelawareDominicanDutchDutch West IndianEastern EuropeanEcuadorianEgyptianEnglishEstonianEthiopianEuropeanFijianFilipinoFinnishFrenchFrench American IndianFrench CanadianGermanGerman RussianGhanaianGreekGuamanian/ChamorroGuatemalanGuyaneseHaitianHmongHonduranHopiHoumaHungarianIcelanderIndian (Asian)IndonesianInupiatIranianIraqiIrishIroquoisIsraeliItalianJamaicanJapaneseJordanianKenyanKiowaKoreanLaotianLatvianLebaneseLiberianLithuanianLumbeeLuxembourgerMacedonianMalaysianMalteseMarshalleseMenomineeMexicanMexican American IndianMongolianMoroccanNative HawaiianNavajoNepaleseNew ZealanderNicaraguanNigerianNorthern EuropeanNorwegianOkinawanOsageOttawaPaiutePakistaniPalestinianPanamanianParaguayanPennsylvania GermanPeruvianPimaPolishPortuguesePotawatomiPuebloPuerto RicanPuget Sound SalishRomanianRussianSalvadoranSamoanScandinavianScotch-IrishScottishSeminoleSenegaleseSerbianShoshoneSierra LeoneanSiouxSlavicSlovakSloveneSomaliSouth AfricanSouth AmericanSouth American IndianSoviet UnionSpaniardSpanishSpanish AmericanSpanish American IndianSri LankanSubsaharan AfricanSudaneseSwedishSwissSyrianTaiwaneseThaiTlingit-HaidaTohono O'OdhamTonganTrinidadian and TobagonianTsimshianTurkishU.S. Virgin IslanderUgandanUkrainianUruguayanUteVenezuelanVietnameseWelshWest IndianYakamaYaquiYugoslavianYumanYup'ikZimbabwean
Immigration
NonimmigrantsImmigrantsAfghanistanAfricaAlbaniaArgentinaArmeniaAsiaAustraliaAustriaBahamasBangladeshBarbadosBelarusBelgiumBelizeBoliviaBosnia and HerzegovinaBrazilBulgariaBurma/MyanmarCabo VerdeCambodiaCameroonCanadaCaribbeanCentral AmericaChileChinaColombiaCongoCosta RicaCroatiaCubaCzechoslovakiaDenmarkDominicaDominican RepublicEastern AfricaEastern AsiaEastern EuropeEcuadorEgyptEl SalvadorEnglandEritreaEthiopiaEuropeFijiFranceGermanyGhanaGreeceGrenadaGuatemalaGuyanaHaitiHondurasHong KongHungaryIndiaIndonesiaIranIraqIrelandIsraelItalyJamaicaJapanJordanKazakhstanKenyaKoreaKuwaitLaosLatin AmericaLatviaLebanonLiberiaLithuaniaMalaysiaMexicoMicronesiaMiddle AfricaMoldovaMoroccoNepalNetherlandsNicaraguaNigeriaNorth AmericaNorth MacedoniaNorthern AfricaNorthern EuropeNorwayOceaniaPakistanPanamaPeruPhilippinesPolandPortugalRomaniaRussiaSaudi ArabiaScotlandSenegalSerbiaSierra LeoneSingaporeSomaliaSouth AfricaSouth AmericaSouth Central AsiaSouth Eastern AsiaSouthern EuropeSpainSri LankaSt. Vincent and the GrenadinesSudanSwedenSwitzerlandSyriaTaiwanThailandTrinidad and TobagoTurkeyUgandaUkraineUruguayUzbekistanVenezuelaVietnamWest IndiesWestern AfricaWestern AsiaWestern EuropeYemenZaireZimbabweAzores
Select to Compare
Race
Ancestry
AfghanAfricanAlaska NativeAlaskan AthabascanAlbanianAleutAlsatianAmericanApacheArabArapahoArgentineanArmenianAssyrian/Chaldean/SyriacAustralianAustrianBahamianBangladeshiBarbadianBasqueBelgianBelizeanBermudanBhutaneseBlackfeetBolivianBrazilianBritishBritish West IndianBulgarianBurmeseCajunCambodianCanadianCape VerdeanCarpatho RusynCelticCentral AmericanCentral American IndianCherokeeCheyenneChickasawChileanChineseChippewaChoctawColombianColvilleComancheCosta RicanCreeCreekCroatianCrowCubanCypriotCzechCzechoslovakianDanishDelawareDominicanDutchDutch West IndianEastern EuropeanEcuadorianEgyptianEnglishEstonianEthiopianEuropeanFijianFilipinoFinnishFrenchFrench American IndianFrench CanadianGermanGerman RussianGhanaianGreekGuamanian/ChamorroGuatemalanGuyaneseHaitianHmongHopiHoumaHungarianIcelanderIndian (Asian)IndonesianInupiatIranianIraqiIrishIroquoisIsraeliItalianJamaicanJapaneseJordanianKenyanKiowaKoreanLaotianLatvianLebaneseLiberianLithuanianLumbeeLuxembourgerMacedonianMalaysianMalteseMarshalleseMenomineeMexicanMexican American IndianMongolianMoroccanNative HawaiianNavajoNepaleseNew ZealanderNicaraguanNigerianNorthern EuropeanNorwegianOkinawanOsageOttawaPaiutePakistaniPalestinianPanamanianParaguayanPennsylvania GermanPeruvianPimaPolishPortuguesePotawatomiPuebloPuerto RicanPuget Sound SalishRomanianRussianSalvadoranSamoanScandinavianScotch-IrishScottishSeminoleSenegaleseSerbianShoshoneSierra LeoneanSiouxSlavicSlovakSloveneSomaliSouth AfricanSouth AmericanSouth American IndianSoviet UnionSpaniardSpanishSpanish AmericanSpanish American IndianSri LankanSubsaharan AfricanSudaneseSwedishSwissSyrianTaiwaneseThaiTlingit-HaidaTohono O'OdhamTonganTrinidadian and TobagonianTsimshianTurkishU.S. Virgin IslanderUgandanUkrainianUruguayanUteVenezuelanVietnameseWelshWest IndianYakamaYaquiYugoslavianYumanYup'ikZimbabwean
Immigration
NonimmigrantsImmigrantsAfghanistanAfricaAlbaniaArgentinaArmeniaAsiaAustraliaAustriaBahamasBangladeshBarbadosBelarusBelgiumBelizeBoliviaBosnia and HerzegovinaBrazilBulgariaBurma/MyanmarCabo VerdeCambodiaCameroonCanadaCaribbeanCentral AmericaChileChinaColombiaCongoCosta RicaCroatiaCubaCzechoslovakiaDenmarkDominicaDominican RepublicEastern AfricaEastern AsiaEastern EuropeEcuadorEgyptEl SalvadorEnglandEritreaEthiopiaEuropeFijiFranceGermanyGhanaGreeceGrenadaGuatemalaGuyanaHaitiHondurasHong KongHungaryIndiaIndonesiaIranIraqIrelandIsraelItalyJamaicaJapanJordanKazakhstanKenyaKoreaKuwaitLaosLatin AmericaLatviaLebanonLiberiaLithuaniaMalaysiaMexicoMicronesiaMiddle AfricaMoldovaMoroccoNepalNetherlandsNicaraguaNigeriaNorth AmericaNorth MacedoniaNorthern AfricaNorthern EuropeNorwayOceaniaPakistanPanamaPeruPhilippinesPolandPortugalRomaniaRussiaSaudi ArabiaScotlandSenegalSerbiaSierra LeoneSingaporeSomaliaSouth AfricaSouth AmericaSouth Central AsiaSouth Eastern AsiaSouthern EuropeSpainSri LankaSt. Vincent and the GrenadinesSudanSwedenSwitzerlandSyriaTaiwanThailandTrinidad and TobagoTurkeyUgandaUkraineUruguayUzbekistanVenezuelaVietnamWest IndiesWestern AfricaWestern AsiaWestern EuropeYemenZaireZimbabweAzores
Disability Age Under 5
Income
Poverty
Unemployment
Labor Participation
Family Structure
Vehicle Availability
Education Level
Disability

Honduran Disability Age Under 5
Good

1.2%
DISABILITY | AGE UNDER 5
72.5/ 100
METRIC RATING
152nd/ 347
METRIC RANK

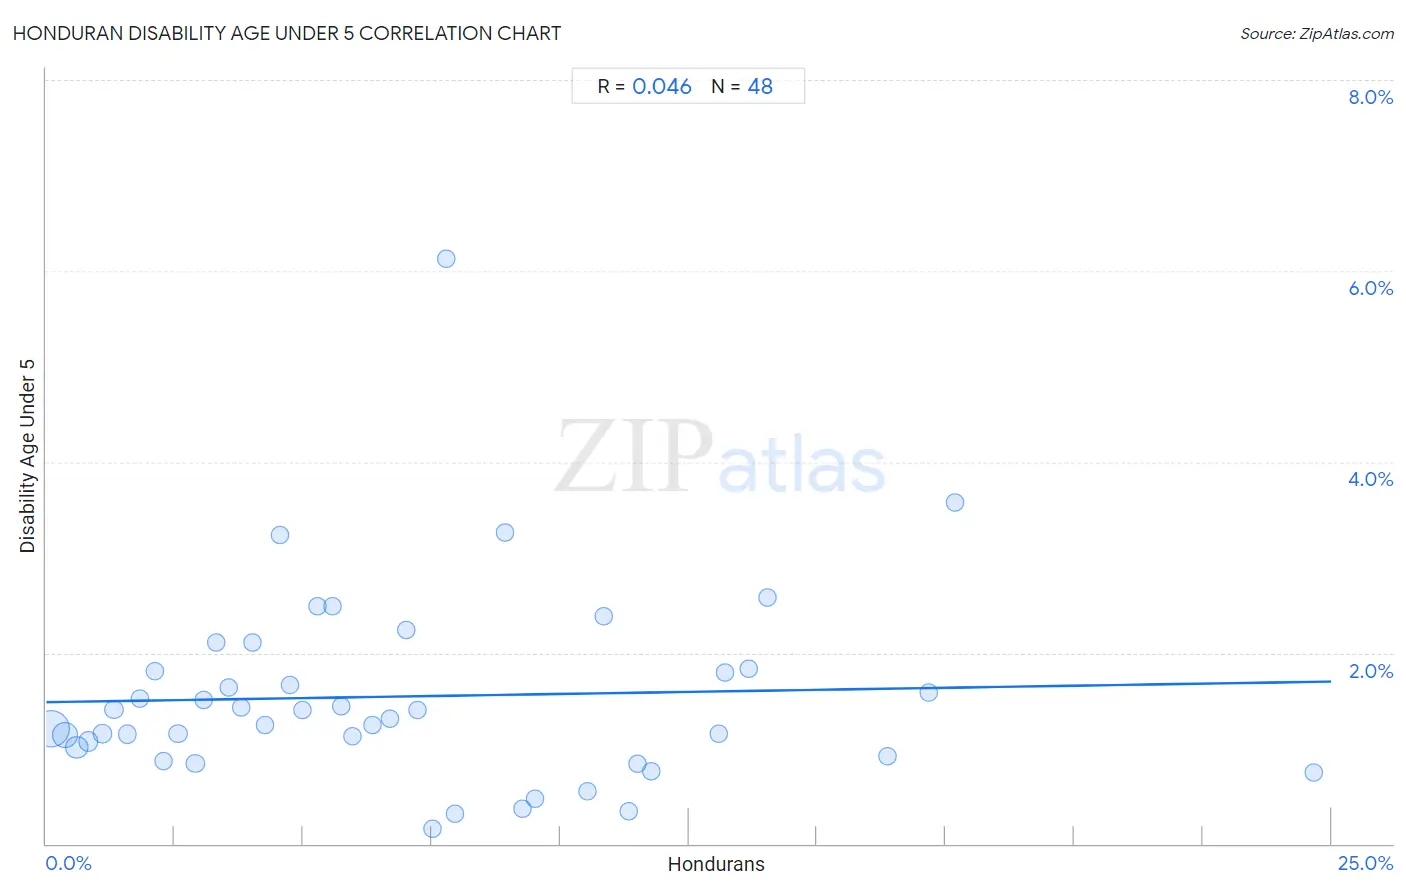
Honduran Disability Age Under 5 Correlation Chart

The statistical analysis conducted on geographies consisting of 207,586,632 people shows no correlation between the proportion of Hondurans and percentage of population with a disability under the age of 5 in the United States with a correlation coefficient (R) of 0.046 and weighted average of 1.2%. On average, for every 1% (one percent) increase in Hondurans within a typical geography, there is an increase of 0.0087% in percentage of population with a disability under the age of 5.
Honduran Disability Age Under 5
It is essential to understand that the correlation between the percentage of Hondurans and percentage of population with a disability under the age of 5 does not imply a direct cause-and-effect relationship. It remains uncertain whether the presence of Hondurans influences an upward or downward trend in the level of percentage of population with a disability under the age of 5 within an area, or if Hondurans simply ended up residing in those areas with higher or lower levels of percentage of population with a disability under the age of 5 due to other factors.

Demographics Similar to Hondurans by Disability Age Under 5

In terms of disability age under 5, the demographic groups most similar to Hondurans are Yaqui (1.2%, a difference of 0.28%), Immigrants from Thailand (1.2%, a difference of 0.34%), South American (1.2%, a difference of 0.38%), Uruguayan (1.2%, a difference of 0.41%), and Kenyan (1.2%, a difference of 0.42%).
DemographicsRating | RankDisability Age Under 5
Immigrants from Zimbabwe
77.9
/100
|
#145
Good
1.2%
Samoans
77.7
/100
|
#146
Good
1.2%
Icelanders
76.3
/100
|
#147
Good
1.2%
Ghanaians
76.3
/100
|
#148
Good
1.2%
Kenyans
75.9
/100
|
#149
Good
1.2%
South Americans
75.6
/100
|
#150
Good
1.2%
Yaqui
74.8
/100
|
#151
Good
1.2%
Hondurans
72.5
/100
|
#152
Good
1.2%
Immigrants from Thailand
69.4
/100
|
#153
Good
1.2%
Uruguayans
68.8
/100
|
#154
Good
1.2%
Immigrants from Ghana
68.7
/100
|
#155
Good
1.2%
Hawaiians
68.5
/100
|
#156
Good
1.2%
Immigrants from South America
67.0
/100
|
#157
Good
1.2%
Arabs
66.4
/100
|
#158
Good
1.2%
Colombians
65.8
/100
|
#159
Good
1.2%

Honduran Disability Age Under 5 Correlation Summary

MeasurementHonduran DataDisability Age Under 5 Data
Minimum0.10%0.16%
Maximum24.7%6.1%
Range24.6%6.0%
Mean7.1%1.5%
Median5.8%1.4%
Interquartile 25% (IQ1)3.0%0.96%
Interquartile 75% (IQ3)10.7%1.8%
Interquartile Range (IQR)7.7%0.86%
Standard Deviation (Sample)5.4%1.0%
Standard Deviation (Population)5.3%1.0%

Correlation Details

Honduran PercentileSample SizeDisability Age Under 5
[
0.0%
-
0.5%
]
0.10%
104,524,8611.2%
[
0.0%
-
0.5%
]
0.36%
41,426,8421.1%
[
0.5%
-
1.0%
]
0.59%
22,256,0771.0%
[
0.5%
-
1.0%
]
0.82%
11,601,6441.1%
[
1.0%
-
1.5%
]
1.10%
7,634,7501.2%
[
1.0%
-
1.5%
]
1.32%
4,360,6811.4%
[
1.5%
-
2.0%
]
1.58%
2,022,1761.1%
[
1.5%
-
2.0%
]
1.82%
1,734,9721.5%
[
2.0%
-
2.5%
]
2.11%
1,212,3711.8%
[
2.0%
-
2.5%
]
2.29%
2,138,9360.86%
[
2.5%
-
3.0%
]
2.56%
1,027,5691.2%
[
2.5%
-
3.0%
]
2.90%
3,221,7170.84%
[
3.0%
-
3.5%
]
3.06%
636,0161.5%
[
3.0%
-
3.5%
]
3.32%
222,0432.1%
[
3.5%
-
4.0%
]
3.56%
389,3411.6%
[
3.5%
-
4.0%
]
3.79%
348,6631.4%
[
4.0%
-
4.5%
]
4.00%
317,2302.1%
[
4.0%
-
4.5%
]
4.26%
238,3191.2%
[
4.5%
-
5.0%
]
4.56%
175,4893.2%
[
4.5%
-
5.0%
]
4.75%
150,7051.7%
[
4.5%
-
5.0%
]
4.98%
215,8891.4%
[
5.0%
-
5.5%
]
5.27%
173,5982.5%
[
5.5%
-
6.0%
]
5.58%
11,1562.5%
[
5.5%
-
6.0%
]
5.74%
94,1291.4%
[
5.5%
-
6.0%
]
5.96%
156,1391.1%
[
6.0%
-
6.5%
]
6.34%
46,8831.2%
[
6.5%
-
7.0%
]
6.68%
568,9261.3%
[
7.0%
-
7.5%
]
7.01%
35,5112.2%
[
7.0%
-
7.5%
]
7.23%
39,7641.4%
[
7.5%
-
8.0%
]
7.52%
46,8110.16%
[
7.5%
-
8.0%
]
7.77%
10,3696.1%
[
7.5%
-
8.0%
]
7.95%
26,5480.32%
[
8.5%
-
9.0%
]
8.93%
15,3793.3%
[
9.0%
-
9.5%
]
9.26%
79,7650.36%
[
9.5%
-
10.0%
]
9.51%
65,7850.47%
[
10.5%
-
11.0%
]
10.53%
18,4260.54%
[
10.5%
-
11.0%
]
10.86%
59,1362.4%
[
11.0%
-
11.5%
]
11.33%
52,3600.34%
[
11.5%
-
12.0%
]
11.51%
48,1080.84%
[
11.5%
-
12.0%
]
11.76%
8,7500.77%
[
13.0%
-
13.5%
]
13.09%
31,7561.2%
[
13.0%
-
13.5%
]
13.21%
17,6401.8%
[
13.5%
-
14.0%
]
13.67%
16,7431.8%
[
14.0%
-
14.5%
]
14.04%
59,1212.6%
[
16.0%
-
16.5%
]
16.36%
26,1050.91%
[
17.0%
-
17.5%
]
17.16%
16,9301.6%
[
17.5%
-
18.0%
]
17.69%
9443.6%
[
24.5%
-
25.0%
]
24.67%
3,5590.74%