Maltese Disability Age Under 5
COMPARE
Maltese
Select to Compare
Disability Age Under 5
Maltese Disability Age Under 5
1.3%
DISABILITY | AGE UNDER 5
2.2/ 100
METRIC RATING
241st/ 347
METRIC RANK
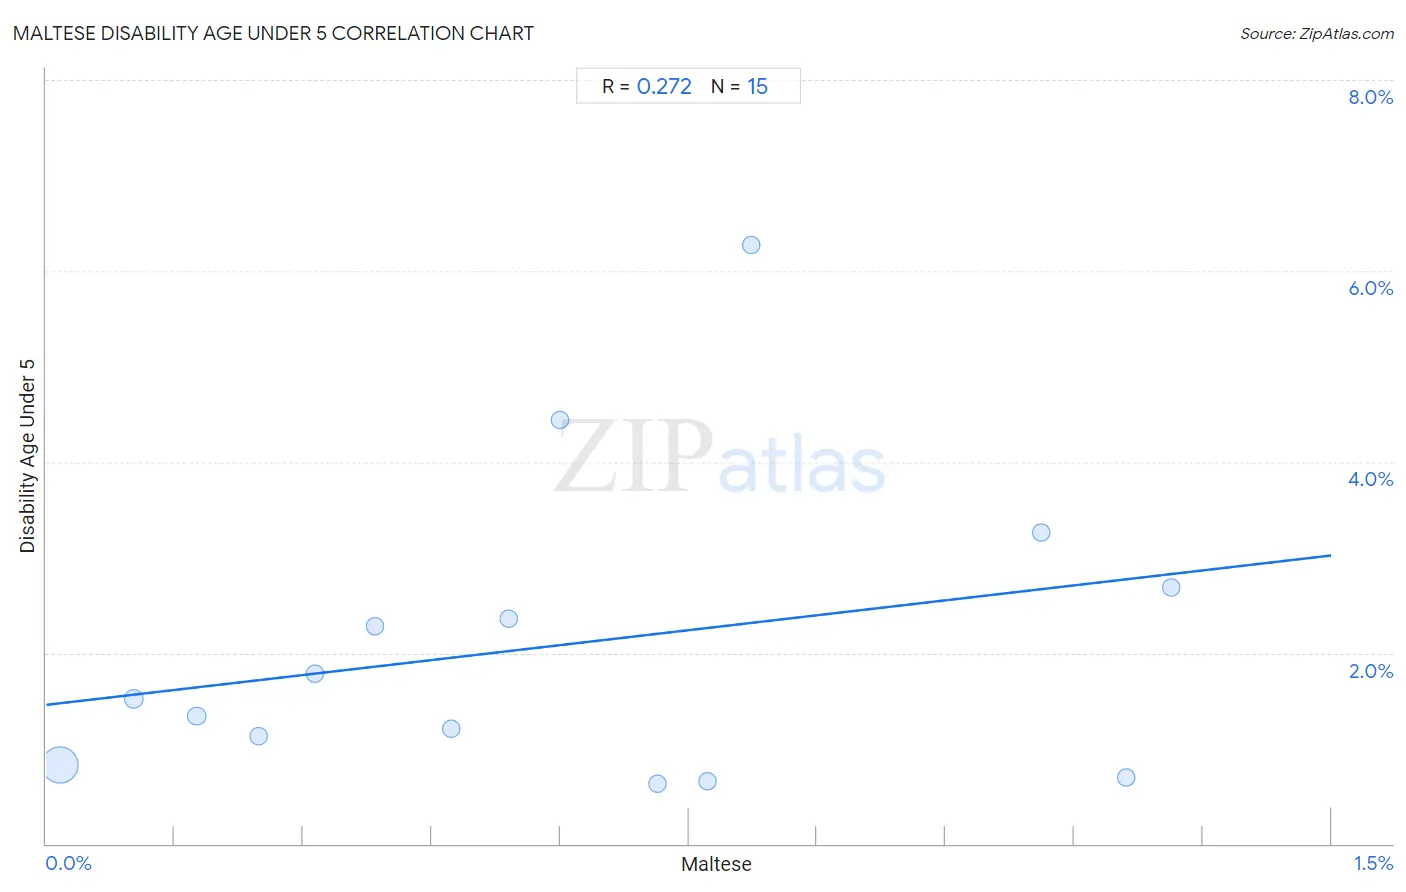
Maltese Disability Age Under 5 Correlation Chart
The statistical analysis conducted on geographies consisting of 87,586,086 people shows a weak positive correlation between the proportion of Maltese and percentage of population with a disability under the age of 5 in the United States with a correlation coefficient (R) of 0.272 and weighted average of 1.3%. On average, for every 1% (one percent) increase in Maltese within a typical geography, there is an increase of 1.0% in percentage of population with a disability under the age of 5.
It is essential to understand that the correlation between the percentage of Maltese and percentage of population with a disability under the age of 5 does not imply a direct cause-and-effect relationship. It remains uncertain whether the presence of Maltese influences an upward or downward trend in the level of percentage of population with a disability under the age of 5 within an area, or if Maltese simply ended up residing in those areas with higher or lower levels of percentage of population with a disability under the age of 5 due to other factors.
Demographics Similar to Maltese by Disability Age Under 5
In terms of disability age under 5, the demographic groups most similar to Maltese are Native Hawaiian (1.3%, a difference of 0.070%), Lumbee (1.3%, a difference of 0.080%), Immigrants from Austria (1.3%, a difference of 0.090%), Spanish American Indian (1.3%, a difference of 0.25%), and Immigrants from Cameroon (1.4%, a difference of 0.46%).
| Demographics | Rating | Rank | Disability Age Under 5 |
| Pueblo | 3.8 /100 | #234 | Tragic 1.3% |
| Central American Indians | 3.6 /100 | #235 | Tragic 1.3% |
| South American Indians | 3.3 /100 | #236 | Tragic 1.3% |
| Basques | 3.0 /100 | #237 | Tragic 1.3% |
| Spanish American Indians | 2.4 /100 | #238 | Tragic 1.3% |
| Immigrants from Austria | 2.3 /100 | #239 | Tragic 1.3% |
| Native Hawaiians | 2.2 /100 | #240 | Tragic 1.3% |
| Maltese | 2.2 /100 | #241 | Tragic 1.3% |
| Lumbee | 2.1 /100 | #242 | Tragic 1.3% |
| Immigrants from Cameroon | 1.7 /100 | #243 | Tragic 1.4% |
| Spaniards | 1.4 /100 | #244 | Tragic 1.4% |
| Potawatomi | 1.1 /100 | #245 | Tragic 1.4% |
| Russians | 1.0 /100 | #246 | Tragic 1.4% |
| Immigrants from England | 1.0 /100 | #247 | Tragic 1.4% |
| Eastern Europeans | 1.0 /100 | #248 | Tragic 1.4% |
Maltese Disability Age Under 5 Correlation Summary
| Measurement | Maltese Data | Disability Age Under 5 Data |
| Minimum | 0.017% | 0.63% |
| Maximum | 1.3% | 6.3% |
| Range | 1.3% | 5.6% |
| Mean | 0.59% | 2.1% |
| Median | 0.54% | 1.5% |
| Interquartile 25% (IQ1) | 0.25% | 0.83% |
| Interquartile 75% (IQ3) | 0.82% | 2.7% |
| Interquartile Range (IQR) | 0.58% | 1.9% |
| Standard Deviation (Sample) | 0.41% | 1.6% |
| Standard Deviation (Population) | 0.40% | 1.5% |
Correlation Details
| Maltese Percentile | Sample Size | Disability Age Under 5 |
[ 0.0% - 0.5% ] 0.017% | 79,469,358 | 0.83% |
[ 0.0% - 0.5% ] 0.10% | 4,650,126 | 1.5% |
[ 0.0% - 0.5% ] 0.18% | 1,268,205 | 1.3% |
[ 0.0% - 0.5% ] 0.25% | 601,922 | 1.1% |
[ 0.0% - 0.5% ] 0.31% | 461,964 | 1.8% |
[ 0.0% - 0.5% ] 0.38% | 136,743 | 2.3% |
[ 0.0% - 0.5% ] 0.47% | 211,764 | 1.2% |
[ 0.5% - 1.0% ] 0.54% | 384,281 | 2.4% |
[ 0.5% - 1.0% ] 0.60% | 142,356 | 4.4% |
[ 0.5% - 1.0% ] 0.71% | 94,928 | 0.63% |
[ 0.5% - 1.0% ] 0.77% | 40,675 | 0.66% |
[ 0.5% - 1.0% ] 0.82% | 2,915 | 6.3% |
[ 1.0% - 1.5% ] 1.16% | 16,786 | 3.3% |
[ 1.0% - 1.5% ] 1.26% | 37,267 | 0.69% |
[ 1.0% - 1.5% ] 1.31% | 66,796 | 2.7% |