Immigrants from Malaysia Disability Age Under 5

COMPARE

Immigrants from Malaysia
Race
Ancestry
AfghanAfricanAlaska NativeAlaskan AthabascanAlbanianAleutAlsatianAmericanApacheArabArapahoArgentineanArmenianAssyrian/Chaldean/SyriacAustralianAustrianBahamianBangladeshiBarbadianBasqueBelgianBelizeanBermudanBhutaneseBlackfeetBolivianBrazilianBritishBritish West IndianBulgarianBurmeseCajunCambodianCanadianCape VerdeanCarpatho RusynCelticCentral AmericanCentral American IndianCherokeeCheyenneChickasawChileanChineseChippewaChoctawColombianColvilleComancheCosta RicanCreeCreekCroatianCrowCubanCypriotCzechCzechoslovakianDanishDelawareDominicanDutchDutch West IndianEastern EuropeanEcuadorianEgyptianEnglishEstonianEthiopianEuropeanFijianFilipinoFinnishFrenchFrench American IndianFrench CanadianGermanGerman RussianGhanaianGreekGuamanian/ChamorroGuatemalanGuyaneseHaitianHmongHonduranHopiHoumaHungarianIcelanderIndian (Asian)IndonesianInupiatIranianIraqiIrishIroquoisIsraeliItalianJamaicanJapaneseJordanianKenyanKiowaKoreanLaotianLatvianLebaneseLiberianLithuanianLumbeeLuxembourgerMacedonianMalaysianMalteseMarshalleseMenomineeMexicanMexican American IndianMongolianMoroccanNative HawaiianNavajoNepaleseNew ZealanderNicaraguanNigerianNorthern EuropeanNorwegianOkinawanOsageOttawaPaiutePakistaniPalestinianPanamanianParaguayanPennsylvania GermanPeruvianPimaPolishPortuguesePotawatomiPuebloPuerto RicanPuget Sound SalishRomanianRussianSalvadoranSamoanScandinavianScotch-IrishScottishSeminoleSenegaleseSerbianShoshoneSierra LeoneanSiouxSlavicSlovakSloveneSomaliSouth AfricanSouth AmericanSouth American IndianSoviet UnionSpaniardSpanishSpanish AmericanSpanish American IndianSri LankanSubsaharan AfricanSudaneseSwedishSwissSyrianTaiwaneseThaiTlingit-HaidaTohono O'OdhamTonganTrinidadian and TobagonianTsimshianTurkishU.S. Virgin IslanderUgandanUkrainianUruguayanUteVenezuelanVietnameseWelshWest IndianYakamaYaquiYugoslavianYumanYup'ikZimbabwean
Immigration
NonimmigrantsImmigrantsAfghanistanAfricaAlbaniaArgentinaArmeniaAsiaAustraliaAustriaBahamasBangladeshBarbadosBelarusBelgiumBelizeBoliviaBosnia and HerzegovinaBrazilBulgariaBurma/MyanmarCabo VerdeCambodiaCameroonCanadaCaribbeanCentral AmericaChileChinaColombiaCongoCosta RicaCroatiaCubaCzechoslovakiaDenmarkDominicaDominican RepublicEastern AfricaEastern AsiaEastern EuropeEcuadorEgyptEl SalvadorEnglandEritreaEthiopiaEuropeFijiFranceGermanyGhanaGreeceGrenadaGuatemalaGuyanaHaitiHondurasHong KongHungaryIndiaIndonesiaIranIraqIrelandIsraelItalyJamaicaJapanJordanKazakhstanKenyaKoreaKuwaitLaosLatin AmericaLatviaLebanonLiberiaLithuaniaMalaysiaMexicoMicronesiaMiddle AfricaMoldovaMoroccoNepalNetherlandsNicaraguaNigeriaNorth AmericaNorth MacedoniaNorthern AfricaNorthern EuropeNorwayOceaniaPakistanPanamaPeruPhilippinesPolandPortugalRomaniaRussiaSaudi ArabiaScotlandSenegalSerbiaSierra LeoneSingaporeSomaliaSouth AfricaSouth AmericaSouth Central AsiaSouth Eastern AsiaSouthern EuropeSpainSri LankaSt. Vincent and the GrenadinesSudanSwedenSwitzerlandSyriaTaiwanThailandTrinidad and TobagoTurkeyUgandaUkraineUruguayUzbekistanVenezuelaVietnamWest IndiesWestern AfricaWestern AsiaWestern EuropeYemenZaireZimbabweAzores
Select to Compare
Race
Ancestry
AfghanAfricanAlaska NativeAlaskan AthabascanAlbanianAleutAlsatianAmericanApacheArabArapahoArgentineanArmenianAssyrian/Chaldean/SyriacAustralianAustrianBahamianBangladeshiBarbadianBasqueBelgianBelizeanBermudanBhutaneseBlackfeetBolivianBrazilianBritishBritish West IndianBulgarianBurmeseCajunCambodianCanadianCape VerdeanCarpatho RusynCelticCentral AmericanCentral American IndianCherokeeCheyenneChickasawChileanChineseChippewaChoctawColombianColvilleComancheCosta RicanCreeCreekCroatianCrowCubanCypriotCzechCzechoslovakianDanishDelawareDominicanDutchDutch West IndianEastern EuropeanEcuadorianEgyptianEnglishEstonianEthiopianEuropeanFijianFilipinoFinnishFrenchFrench American IndianFrench CanadianGermanGerman RussianGhanaianGreekGuamanian/ChamorroGuatemalanGuyaneseHaitianHmongHonduranHopiHoumaHungarianIcelanderIndian (Asian)IndonesianInupiatIranianIraqiIrishIroquoisIsraeliItalianJamaicanJapaneseJordanianKenyanKiowaKoreanLaotianLatvianLebaneseLiberianLithuanianLumbeeLuxembourgerMacedonianMalaysianMalteseMarshalleseMenomineeMexicanMexican American IndianMongolianMoroccanNative HawaiianNavajoNepaleseNew ZealanderNicaraguanNigerianNorthern EuropeanNorwegianOkinawanOsageOttawaPaiutePakistaniPalestinianPanamanianParaguayanPennsylvania GermanPeruvianPimaPolishPortuguesePotawatomiPuebloPuerto RicanPuget Sound SalishRomanianRussianSalvadoranSamoanScandinavianScotch-IrishScottishSeminoleSenegaleseSerbianShoshoneSierra LeoneanSiouxSlavicSlovakSloveneSomaliSouth AfricanSouth AmericanSouth American IndianSoviet UnionSpaniardSpanishSpanish AmericanSpanish American IndianSri LankanSubsaharan AfricanSudaneseSwedishSwissSyrianTaiwaneseThaiTlingit-HaidaTohono O'OdhamTonganTrinidadian and TobagonianTsimshianTurkishU.S. Virgin IslanderUgandanUkrainianUruguayanUteVenezuelanVietnameseWelshWest IndianYakamaYaquiYugoslavianYumanYup'ikZimbabwean
Immigration
NonimmigrantsImmigrantsAfghanistanAfricaAlbaniaArgentinaArmeniaAsiaAustraliaAustriaBahamasBangladeshBarbadosBelarusBelgiumBelizeBoliviaBosnia and HerzegovinaBrazilBulgariaBurma/MyanmarCabo VerdeCambodiaCameroonCanadaCaribbeanCentral AmericaChileChinaColombiaCongoCosta RicaCroatiaCubaCzechoslovakiaDenmarkDominicaDominican RepublicEastern AfricaEastern AsiaEastern EuropeEcuadorEgyptEl SalvadorEnglandEritreaEthiopiaEuropeFijiFranceGermanyGhanaGreeceGrenadaGuatemalaGuyanaHaitiHondurasHong KongHungaryIndiaIndonesiaIranIraqIrelandIsraelItalyJamaicaJapanJordanKazakhstanKenyaKoreaKuwaitLaosLatin AmericaLatviaLebanonLiberiaLithuaniaMexicoMicronesiaMiddle AfricaMoldovaMoroccoNepalNetherlandsNicaraguaNigeriaNorth AmericaNorth MacedoniaNorthern AfricaNorthern EuropeNorwayOceaniaPakistanPanamaPeruPhilippinesPolandPortugalRomaniaRussiaSaudi ArabiaScotlandSenegalSerbiaSierra LeoneSingaporeSomaliaSouth AfricaSouth AmericaSouth Central AsiaSouth Eastern AsiaSouthern EuropeSpainSri LankaSt. Vincent and the GrenadinesSudanSwedenSwitzerlandSyriaTaiwanThailandTrinidad and TobagoTurkeyUgandaUkraineUruguayUzbekistanVenezuelaVietnamWest IndiesWestern AfricaWestern AsiaWestern EuropeYemenZaireZimbabweAzores
Disability Age Under 5
Income
Poverty
Unemployment
Labor Participation
Family Structure
Vehicle Availability
Education Level
Disability

Immigrants from Malaysia Disability Age Under 5
Exceptional

1.1%
DISABILITY | AGE UNDER 5
99.4/ 100
METRIC RATING
59th/ 347
METRIC RANK

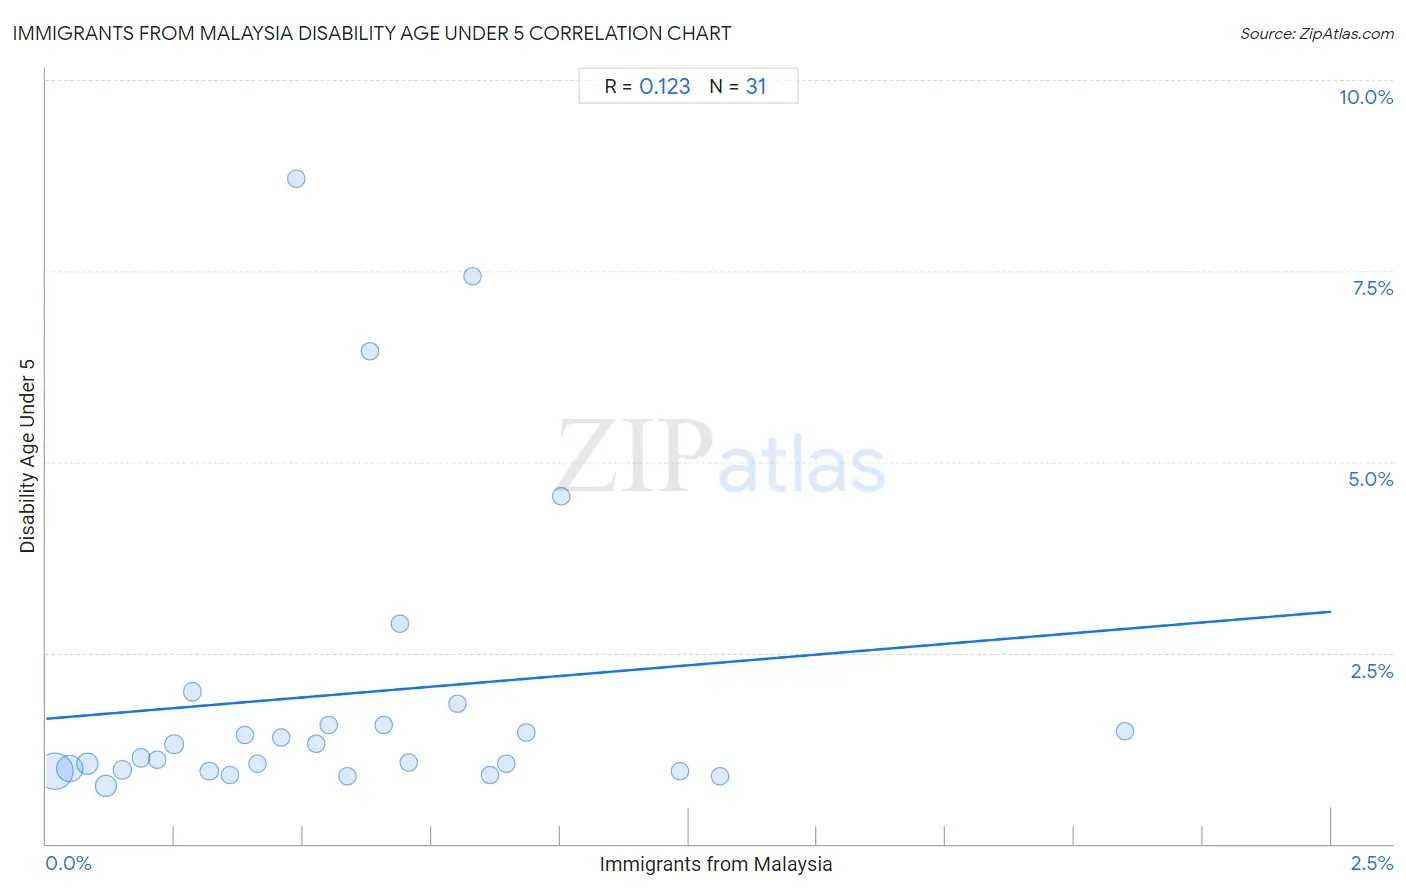
Immigrants from Malaysia Disability Age Under 5 Correlation Chart

The statistical analysis conducted on geographies consisting of 132,664,021 people shows a poor positive correlation between the proportion of Immigrants from Malaysia and percentage of population with a disability under the age of 5 in the United States with a correlation coefficient (R) of 0.123 and weighted average of 1.1%. On average, for every 1% (one percent) increase in Immigrants from Malaysia within a typical geography, there is an increase of 0.56% in percentage of population with a disability under the age of 5.
Immigrants from Malaysia Disability Age Under 5
It is essential to understand that the correlation between the percentage of Immigrants from Malaysia and percentage of population with a disability under the age of 5 does not imply a direct cause-and-effect relationship. It remains uncertain whether the presence of Immigrants from Malaysia influences an upward or downward trend in the level of percentage of population with a disability under the age of 5 within an area, or if Immigrants from Malaysia simply ended up residing in those areas with higher or lower levels of percentage of population with a disability under the age of 5 due to other factors.

Demographics Similar to Immigrants from Malaysia by Disability Age Under 5

In terms of disability age under 5, the demographic groups most similar to Immigrants from Malaysia are Immigrants from Egypt (1.1%, a difference of 0.12%), Assyrian/Chaldean/Syriac (1.1%, a difference of 0.30%), Ecuadorian (1.1%, a difference of 0.33%), Salvadoran (1.1%, a difference of 0.73%), and Immigrants from Western Asia (1.1%, a difference of 0.76%).
DemographicsRating | RankDisability Age Under 5
Immigrants from Bolivia
99.6
/100
|
#52
Exceptional
1.1%
Asians
99.6
/100
|
#53
Exceptional
1.1%
Immigrants from El Salvador
99.6
/100
|
#54
Exceptional
1.1%
Salvadorans
99.5
/100
|
#55
Exceptional
1.1%
Ecuadorians
99.5
/100
|
#56
Exceptional
1.1%
Assyrians/Chaldeans/Syriacs
99.5
/100
|
#57
Exceptional
1.1%
Immigrants from Egypt
99.4
/100
|
#58
Exceptional
1.1%
Immigrants from Malaysia
99.4
/100
|
#59
Exceptional
1.1%
Immigrants from Western Asia
99.2
/100
|
#60
Exceptional
1.1%
Immigrants from Ethiopia
99.2
/100
|
#61
Exceptional
1.1%
Immigrants from Switzerland
99.2
/100
|
#62
Exceptional
1.1%
Immigrants from Vietnam
99.1
/100
|
#63
Exceptional
1.1%
Egyptians
98.9
/100
|
#64
Exceptional
1.1%
Immigrants from Korea
98.8
/100
|
#65
Exceptional
1.1%
Immigrants from Indonesia
98.7
/100
|
#66
Exceptional
1.1%

Immigrants from Malaysia Disability Age Under 5 Correlation Summary

MeasurementImmigrants from Malaysia DataDisability Age Under 5 Data
Minimum0.018%0.76%
Maximum2.1%8.7%
Range2.1%7.9%
Mean0.58%2.0%
Median0.52%1.1%
Interquartile 25% (IQ1)0.25%0.95%
Interquartile 75% (IQ3)0.83%1.6%
Interquartile Range (IQR)0.58%0.61%
Standard Deviation (Sample)0.44%2.0%
Standard Deviation (Population)0.43%2.0%

Correlation Details

Immigrants from Malaysia PercentileSample SizeDisability Age Under 5
[
0.0%
-
0.5%
]
0.018%
61,141,4460.95%
[
0.0%
-
0.5%
]
0.046%
30,091,9330.99%
[
0.0%
-
0.5%
]
0.081%
12,861,3951.0%
[
0.0%
-
0.5%
]
0.12%
14,539,4180.76%
[
0.0%
-
0.5%
]
0.15%
5,141,1180.97%
[
0.0%
-
0.5%
]
0.18%
1,873,9891.1%
[
0.0%
-
0.5%
]
0.22%
2,141,6721.1%
[
0.0%
-
0.5%
]
0.25%
1,159,1191.3%
[
0.0%
-
0.5%
]
0.28%
788,0752.0%
[
0.0%
-
0.5%
]
0.32%
535,5350.95%
[
0.0%
-
0.5%
]
0.36%
359,2040.91%
[
0.0%
-
0.5%
]
0.39%
470,2111.4%
[
0.0%
-
0.5%
]
0.41%
161,7561.0%
[
0.0%
-
0.5%
]
0.46%
195,1651.4%
[
0.0%
-
0.5%
]
0.49%
49,2448.7%
[
0.5%
-
1.0%
]
0.52%
124,9711.3%
[
0.5%
-
1.0%
]
0.55%
129,8211.6%
[
0.5%
-
1.0%
]
0.59%
115,3690.88%
[
0.5%
-
1.0%
]
0.63%
28,6236.5%
[
0.5%
-
1.0%
]
0.66%
68,5501.6%
[
0.5%
-
1.0%
]
0.69%
212,6122.9%
[
0.5%
-
1.0%
]
0.70%
86,8591.1%
[
0.5%
-
1.0%
]
0.80%
38,1241.8%
[
0.5%
-
1.0%
]
0.83%
20,7417.4%
[
0.5%
-
1.0%
]
0.86%
89,8930.90%
[
0.5%
-
1.0%
]
0.90%
32,0501.1%
[
0.5%
-
1.0%
]
0.93%
37,9251.5%
[
1.0%
-
1.5%
]
1.00%
2,8914.5%
[
1.0%
-
1.5%
]
1.23%
79,4950.94%
[
1.0%
-
1.5%
]
1.31%
44,1960.88%
[
2.0%
-
2.5%
]
2.10%
42,6211.5%