Guamanian/Chamorro Disability Age Under 5
COMPARE
Guamanian/Chamorro
Select to Compare
Disability Age Under 5
Guamanian/Chamorro Disability Age Under 5
1.2%
DISABILITY | AGE UNDER 5
57.8/ 100
METRIC RATING
171st/ 347
METRIC RANK
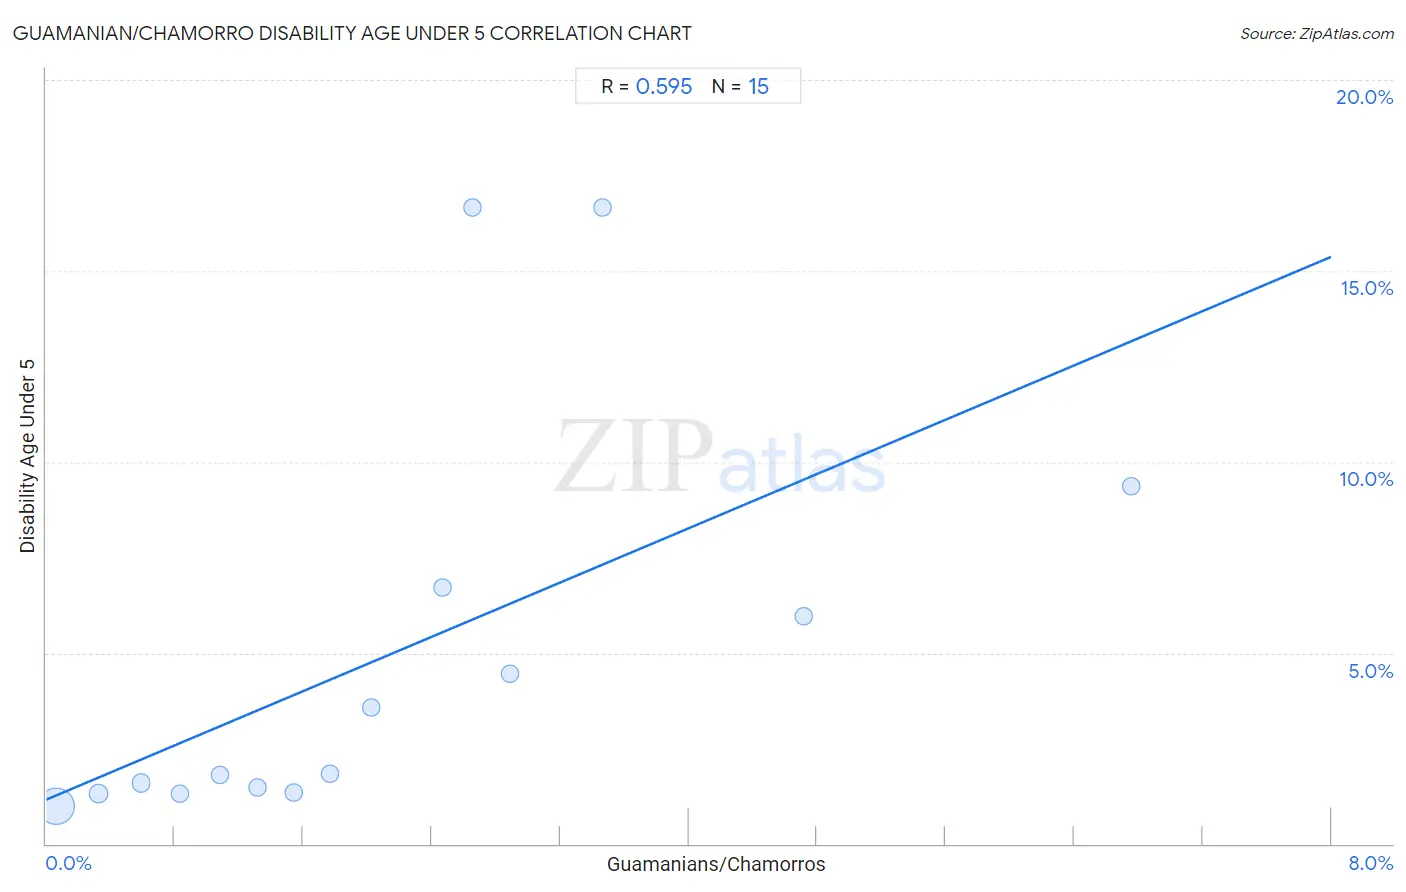
Guamanian/Chamorro Disability Age Under 5 Correlation Chart
The statistical analysis conducted on geographies consisting of 149,028,768 people shows a substantial positive correlation between the proportion of Guamanians/Chamorros and percentage of population with a disability under the age of 5 in the United States with a correlation coefficient (R) of 0.595 and weighted average of 1.2%. On average, for every 1% (one percent) increase in Guamanians/Chamorros within a typical geography, there is an increase of 1.8% in percentage of population with a disability under the age of 5.
It is essential to understand that the correlation between the percentage of Guamanians/Chamorros and percentage of population with a disability under the age of 5 does not imply a direct cause-and-effect relationship. It remains uncertain whether the presence of Guamanians/Chamorros influences an upward or downward trend in the level of percentage of population with a disability under the age of 5 within an area, or if Guamanians/Chamorros simply ended up residing in those areas with higher or lower levels of percentage of population with a disability under the age of 5 due to other factors.
Demographics Similar to Guamanians/Chamorros by Disability Age Under 5
In terms of disability age under 5, the demographic groups most similar to Guamanians/Chamorros are Immigrants from Jamaica (1.2%, a difference of 0.090%), Immigrants from Uruguay (1.2%, a difference of 0.11%), Sierra Leonean (1.2%, a difference of 0.12%), Immigrants from Argentina (1.2%, a difference of 0.23%), and Immigrants from Central America (1.2%, a difference of 0.34%).
| Demographics | Rating | Rank | Disability Age Under 5 |
| Laotians | 62.8 /100 | #164 | Good 1.2% |
| Immigrants from Kuwait | 62.6 /100 | #165 | Good 1.2% |
| Immigrants from Central America | 61.4 /100 | #166 | Good 1.2% |
| Immigrants from Argentina | 60.2 /100 | #167 | Good 1.2% |
| Sierra Leoneans | 59.1 /100 | #168 | Average 1.2% |
| Immigrants from Uruguay | 59.0 /100 | #169 | Average 1.2% |
| Immigrants from Jamaica | 58.8 /100 | #170 | Average 1.2% |
| Guamanians/Chamorros | 57.8 /100 | #171 | Average 1.2% |
| Crow | 51.0 /100 | #172 | Average 1.2% |
| Immigrants from Ireland | 50.3 /100 | #173 | Average 1.2% |
| Immigrants from Latvia | 50.0 /100 | #174 | Average 1.2% |
| Immigrants from Nigeria | 50.0 /100 | #175 | Average 1.2% |
| Immigrants from Kenya | 48.6 /100 | #176 | Average 1.2% |
| Comanche | 47.5 /100 | #177 | Average 1.2% |
| Venezuelans | 47.1 /100 | #178 | Average 1.2% |
Guamanian/Chamorro Disability Age Under 5 Correlation Summary
| Measurement | Guamanian/Chamorro Data | Disability Age Under 5 Data |
| Minimum | 0.061% | 0.97% |
| Maximum | 6.8% | 16.7% |
| Range | 6.7% | 15.7% |
| Mean | 2.2% | 5.0% |
| Median | 1.8% | 1.8% |
| Interquartile 25% (IQ1) | 0.83% | 1.4% |
| Interquartile 75% (IQ3) | 2.9% | 6.7% |
| Interquartile Range (IQR) | 2.1% | 5.3% |
| Standard Deviation (Sample) | 1.8% | 5.3% |
| Standard Deviation (Population) | 1.7% | 5.2% |
Correlation Details
| Guamanian/Chamorro Percentile | Sample Size | Disability Age Under 5 |
[ 0.0% - 0.5% ] 0.061% | 133,385,476 | 0.97% |
[ 0.0% - 0.5% ] 0.33% | 11,059,783 | 1.3% |
[ 0.5% - 1.0% ] 0.59% | 2,312,662 | 1.6% |
[ 0.5% - 1.0% ] 0.83% | 1,091,028 | 1.3% |
[ 1.0% - 1.5% ] 1.08% | 626,840 | 1.8% |
[ 1.0% - 1.5% ] 1.31% | 224,735 | 1.5% |
[ 1.5% - 2.0% ] 1.54% | 143,651 | 1.4% |
[ 1.5% - 2.0% ] 1.77% | 77,620 | 1.8% |
[ 2.0% - 2.5% ] 2.02% | 93,687 | 3.6% |
[ 2.0% - 2.5% ] 2.47% | 2,874 | 6.7% |
[ 2.5% - 3.0% ] 2.65% | 490 | 16.7% |
[ 2.5% - 3.0% ] 2.88% | 2,219 | 4.5% |
[ 3.0% - 3.5% ] 3.47% | 375 | 16.7% |
[ 4.5% - 5.0% ] 4.71% | 6,469 | 6.0% |
[ 6.5% - 7.0% ] 6.75% | 859 | 9.4% |