Immigrants from Guatemala Disability Age Under 5
COMPARE
Immigrants from Guatemala
Select to Compare
Disability Age Under 5
Immigrants from Guatemala Disability Age Under 5
1.2%
DISABILITY | AGE UNDER 5
63.2/ 100
METRIC RATING
163rd/ 347
METRIC RANK
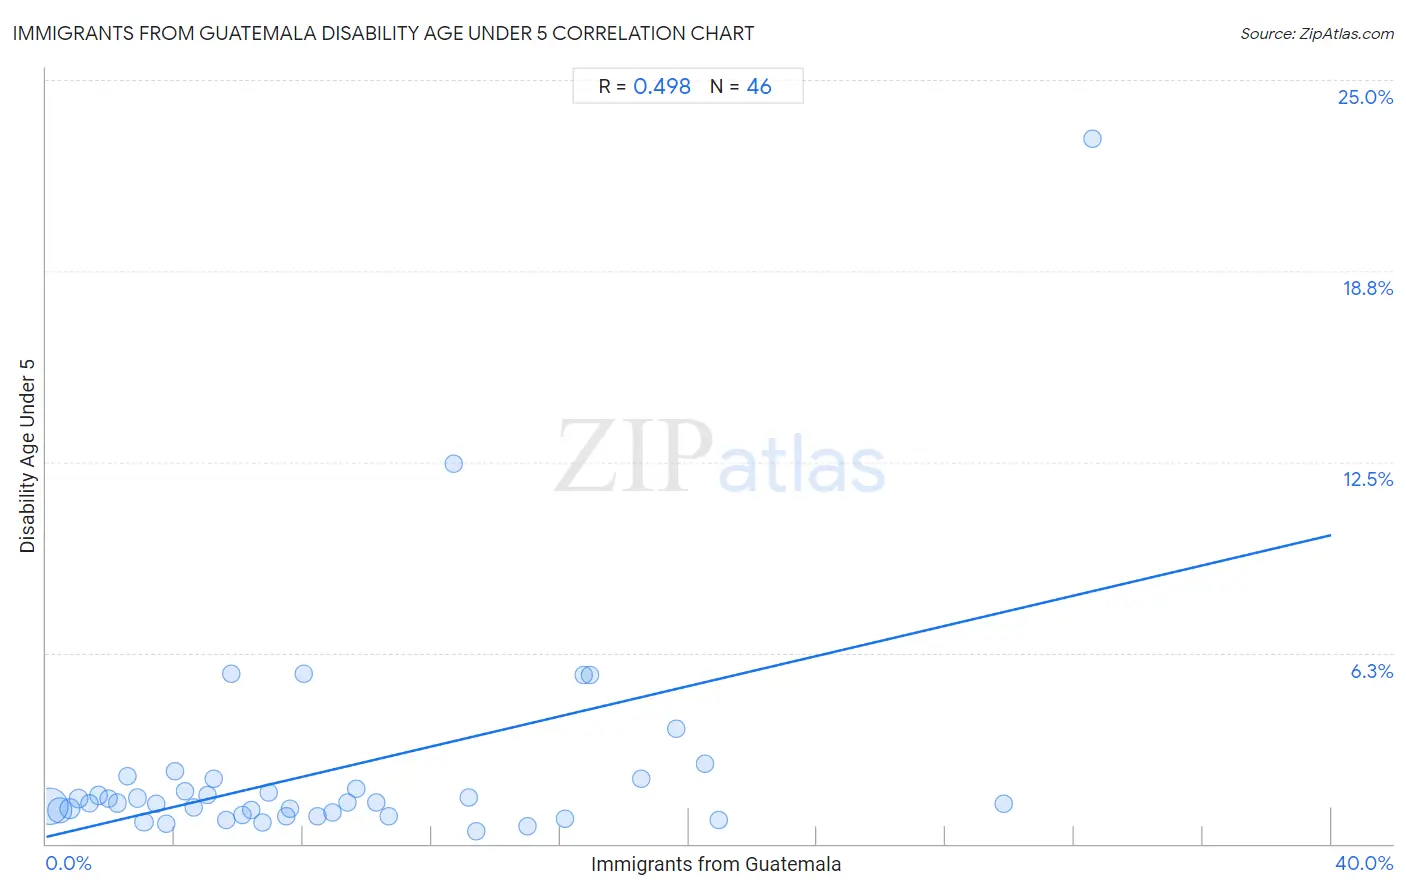
Immigrants from Guatemala Disability Age Under 5 Correlation Chart
The statistical analysis conducted on geographies consisting of 214,173,088 people shows a moderate positive correlation between the proportion of Immigrants from Guatemala and percentage of population with a disability under the age of 5 in the United States with a correlation coefficient (R) of 0.498 and weighted average of 1.2%. On average, for every 1% (one percent) increase in Immigrants from Guatemala within a typical geography, there is an increase of 0.25% in percentage of population with a disability under the age of 5.
It is essential to understand that the correlation between the percentage of Immigrants from Guatemala and percentage of population with a disability under the age of 5 does not imply a direct cause-and-effect relationship. It remains uncertain whether the presence of Immigrants from Guatemala influences an upward or downward trend in the level of percentage of population with a disability under the age of 5 within an area, or if Immigrants from Guatemala simply ended up residing in those areas with higher or lower levels of percentage of population with a disability under the age of 5 due to other factors.
Demographics Similar to Immigrants from Guatemala by Disability Age Under 5
In terms of disability age under 5, the demographic groups most similar to Immigrants from Guatemala are Guatemalan (1.2%, a difference of 0.030%), Laotian (1.2%, a difference of 0.050%), Immigrants from Kuwait (1.2%, a difference of 0.070%), Immigrants from Central America (1.2%, a difference of 0.18%), and Immigrants from Africa (1.2%, a difference of 0.19%).
| Demographics | Rating | Rank | Disability Age Under 5 |
| Hawaiians | 68.5 /100 | #156 | Good 1.2% |
| Immigrants from South America | 67.0 /100 | #157 | Good 1.2% |
| Arabs | 66.4 /100 | #158 | Good 1.2% |
| Colombians | 65.8 /100 | #159 | Good 1.2% |
| Immigrants from Latin America | 65.8 /100 | #160 | Good 1.2% |
| Immigrants from Africa | 65.1 /100 | #161 | Good 1.2% |
| Guatemalans | 63.6 /100 | #162 | Good 1.2% |
| Immigrants from Guatemala | 63.2 /100 | #163 | Good 1.2% |
| Laotians | 62.8 /100 | #164 | Good 1.2% |
| Immigrants from Kuwait | 62.6 /100 | #165 | Good 1.2% |
| Immigrants from Central America | 61.4 /100 | #166 | Good 1.2% |
| Immigrants from Argentina | 60.2 /100 | #167 | Good 1.2% |
| Sierra Leoneans | 59.1 /100 | #168 | Average 1.2% |
| Immigrants from Uruguay | 59.0 /100 | #169 | Average 1.2% |
| Immigrants from Jamaica | 58.8 /100 | #170 | Average 1.2% |
Immigrants from Guatemala Disability Age Under 5 Correlation Summary
| Measurement | Immigrants from Guatemala Data | Disability Age Under 5 Data |
| Minimum | 0.12% | 0.42% |
| Maximum | 32.6% | 23.1% |
| Range | 32.4% | 22.7% |
| Mean | 9.0% | 2.4% |
| Median | 6.8% | 1.3% |
| Interquartile 25% (IQ1) | 3.4% | 0.93% |
| Interquartile 75% (IQ3) | 13.1% | 2.1% |
| Interquartile Range (IQR) | 9.7% | 1.2% |
| Standard Deviation (Sample) | 7.5% | 3.7% |
| Standard Deviation (Population) | 7.4% | 3.7% |
Correlation Details
| Immigrants from Guatemala Percentile | Sample Size | Disability Age Under 5 |
[ 0.0% - 0.5% ] 0.12% | 121,019,004 | 1.2% |
[ 0.0% - 0.5% ] 0.42% | 44,035,032 | 1.1% |
[ 0.5% - 1.0% ] 0.72% | 17,535,009 | 1.2% |
[ 1.0% - 1.5% ] 1.02% | 9,998,000 | 1.5% |
[ 1.0% - 1.5% ] 1.34% | 6,106,823 | 1.3% |
[ 1.5% - 2.0% ] 1.64% | 2,491,423 | 1.6% |
[ 1.5% - 2.0% ] 1.95% | 2,122,237 | 1.5% |
[ 2.0% - 2.5% ] 2.23% | 1,366,779 | 1.3% |
[ 2.5% - 3.0% ] 2.52% | 534,787 | 2.2% |
[ 2.5% - 3.0% ] 2.84% | 937,348 | 1.5% |
[ 3.0% - 3.5% ] 3.05% | 4,241,652 | 0.70% |
[ 3.0% - 3.5% ] 3.44% | 261,234 | 1.3% |
[ 3.5% - 4.0% ] 3.73% | 377,571 | 0.65% |
[ 3.5% - 4.0% ] 3.99% | 172,736 | 2.4% |
[ 4.0% - 4.5% ] 4.34% | 89,134 | 1.7% |
[ 4.5% - 5.0% ] 4.57% | 509,767 | 1.2% |
[ 5.0% - 5.5% ] 5.01% | 193,690 | 1.6% |
[ 5.0% - 5.5% ] 5.22% | 135,550 | 2.1% |
[ 5.5% - 6.0% ] 5.60% | 312,985 | 0.77% |
[ 5.5% - 6.0% ] 5.77% | 13,313 | 5.5% |
[ 6.0% - 6.5% ] 6.11% | 387,651 | 0.93% |
[ 6.0% - 6.5% ] 6.38% | 224,019 | 1.1% |
[ 6.5% - 7.0% ] 6.71% | 225,194 | 0.68% |
[ 6.5% - 7.0% ] 6.94% | 37,754 | 1.7% |
[ 7.0% - 7.5% ] 7.46% | 61,498 | 0.88% |
[ 7.5% - 8.0% ] 7.60% | 331,862 | 1.1% |
[ 8.0% - 8.5% ] 8.00% | 225 | 5.6% |
[ 8.0% - 8.5% ] 8.45% | 25,183 | 0.88% |
[ 8.5% - 9.0% ] 8.93% | 40,927 | 1.0% |
[ 9.0% - 9.5% ] 9.38% | 9,531 | 1.3% |
[ 9.5% - 10.0% ] 9.65% | 83,112 | 1.8% |
[ 10.0% - 10.5% ] 10.27% | 42,629 | 1.4% |
[ 10.5% - 11.0% ] 10.66% | 45,023 | 0.90% |
[ 12.5% - 13.0% ] 12.69% | 5,627 | 12.4% |
[ 13.0% - 13.5% ] 13.15% | 6,624 | 1.5% |
[ 13.0% - 13.5% ] 13.40% | 19,513 | 0.42% |
[ 14.5% - 15.0% ] 14.97% | 36,405 | 0.56% |
[ 16.0% - 16.5% ] 16.16% | 50,387 | 0.81% |
[ 16.5% - 17.0% ] 16.73% | 3,055 | 5.5% |
[ 16.5% - 17.0% ] 16.93% | 3,019 | 5.5% |
[ 18.5% - 19.0% ] 18.51% | 1,275 | 2.1% |
[ 19.5% - 20.0% ] 19.59% | 47,142 | 3.7% |
[ 20.0% - 20.5% ] 20.50% | 2,205 | 2.6% |
[ 20.5% - 21.0% ] 20.92% | 7,247 | 0.79% |
[ 29.5% - 30.0% ] 29.81% | 21,778 | 1.3% |
[ 32.5% - 33.0% ] 32.56% | 129 | 23.1% |