Bhutanese Disability Age Under 5
COMPARE
Bhutanese
Select to Compare
Disability Age Under 5
Bhutanese Disability Age Under 5
1.2%
DISABILITY | AGE UNDER 5
92.5/ 100
METRIC RATING
119th/ 347
METRIC RANK
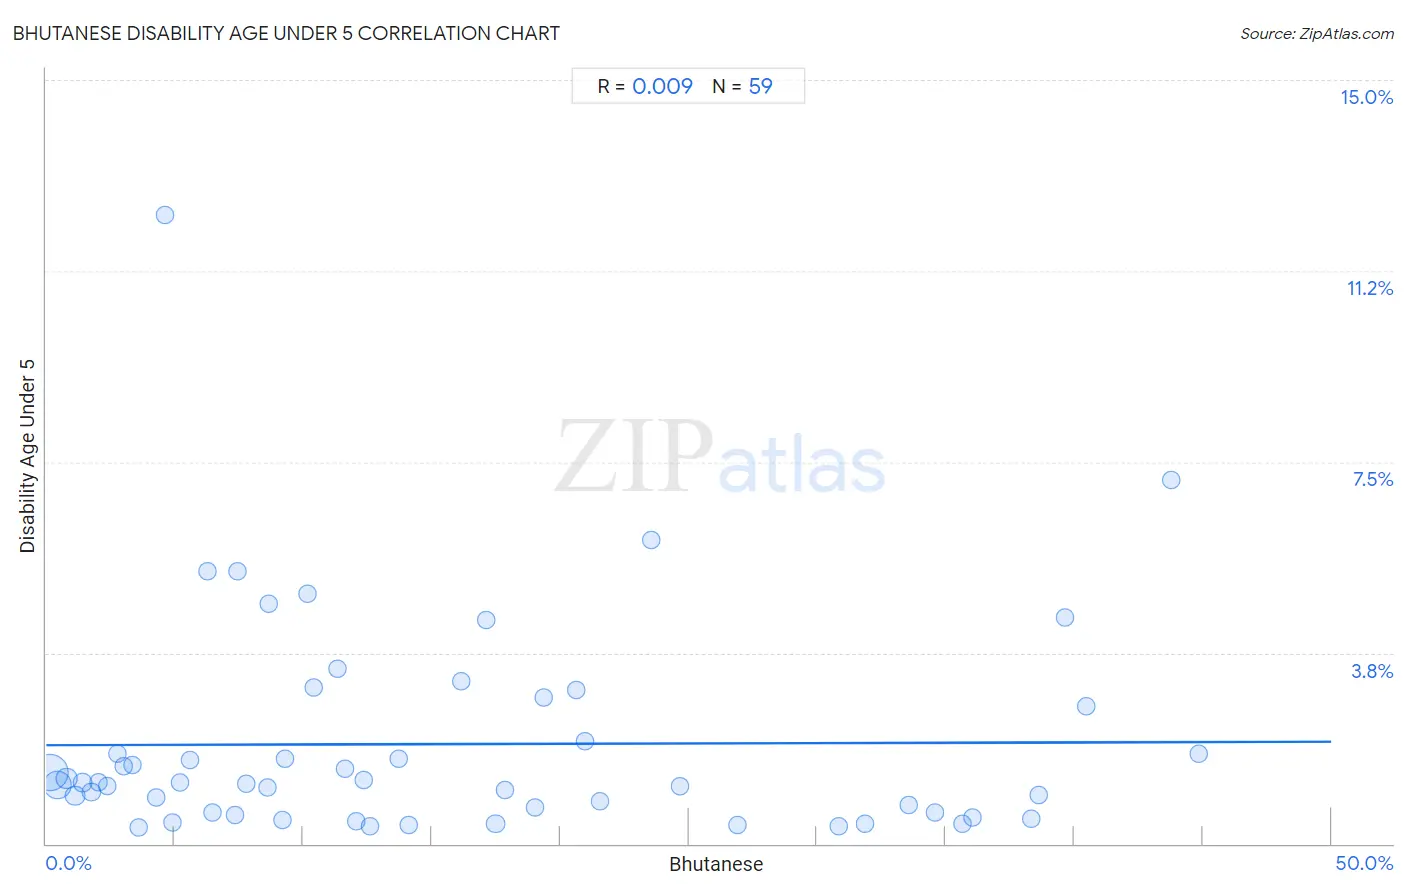
Bhutanese Disability Age Under 5 Correlation Chart
The statistical analysis conducted on geographies consisting of 235,474,976 people shows no correlation between the proportion of Bhutanese and percentage of population with a disability under the age of 5 in the United States with a correlation coefficient (R) of 0.009 and weighted average of 1.2%. On average, for every 1% (one percent) increase in Bhutanese within a typical geography, there is an increase of 0.0014% in percentage of population with a disability under the age of 5.
It is essential to understand that the correlation between the percentage of Bhutanese and percentage of population with a disability under the age of 5 does not imply a direct cause-and-effect relationship. It remains uncertain whether the presence of Bhutanese influences an upward or downward trend in the level of percentage of population with a disability under the age of 5 within an area, or if Bhutanese simply ended up residing in those areas with higher or lower levels of percentage of population with a disability under the age of 5 due to other factors.
Demographics Similar to Bhutanese by Disability Age Under 5
In terms of disability age under 5, the demographic groups most similar to Bhutanese are Immigrants from Eritrea (1.2%, a difference of 0.070%), Immigrants from Venezuela (1.2%, a difference of 0.34%), Immigrants from Senegal (1.2%, a difference of 0.35%), Immigrants from Philippines (1.2%, a difference of 0.37%), and Immigrants from Northern Africa (1.2%, a difference of 0.50%).
| Demographics | Rating | Rank | Disability Age Under 5 |
| Immigrants from Australia | 94.4 /100 | #112 | Exceptional 1.2% |
| Immigrants from Oceania | 94.2 /100 | #113 | Exceptional 1.2% |
| Belizeans | 93.9 /100 | #114 | Exceptional 1.2% |
| Immigrants from Caribbean | 93.8 /100 | #115 | Exceptional 1.2% |
| Immigrants from Northern Africa | 93.8 /100 | #116 | Exceptional 1.2% |
| Immigrants from Philippines | 93.5 /100 | #117 | Exceptional 1.2% |
| Immigrants from Venezuela | 93.4 /100 | #118 | Exceptional 1.2% |
| Bhutanese | 92.5 /100 | #119 | Exceptional 1.2% |
| Immigrants from Eritrea | 92.3 /100 | #120 | Exceptional 1.2% |
| Immigrants from Senegal | 91.4 /100 | #121 | Exceptional 1.2% |
| Aleuts | 90.7 /100 | #122 | Exceptional 1.2% |
| Zimbabweans | 90.6 /100 | #123 | Exceptional 1.2% |
| Immigrants from Cambodia | 90.5 /100 | #124 | Exceptional 1.2% |
| Japanese | 90.3 /100 | #125 | Exceptional 1.2% |
| Central Americans | 89.7 /100 | #126 | Excellent 1.2% |
Bhutanese Disability Age Under 5 Correlation Summary
| Measurement | Bhutanese Data | Disability Age Under 5 Data |
| Minimum | 0.15% | 0.32% |
| Maximum | 44.8% | 12.3% |
| Range | 44.7% | 12.0% |
| Mean | 15.6% | 2.0% |
| Median | 11.6% | 1.2% |
| Interquartile 25% (IQ1) | 4.9% | 0.60% |
| Interquartile 75% (IQ3) | 23.5% | 2.7% |
| Interquartile Range (IQR) | 18.6% | 2.1% |
| Standard Deviation (Sample) | 13.0% | 2.1% |
| Standard Deviation (Population) | 12.9% | 2.1% |
Correlation Details
| Bhutanese Percentile | Sample Size | Disability Age Under 5 |
[ 0.0% - 0.5% ] 0.15% | 116,332,015 | 1.4% |
[ 0.0% - 0.5% ] 0.45% | 62,520,383 | 1.2% |
[ 0.5% - 1.0% ] 0.79% | 18,846,919 | 1.3% |
[ 1.0% - 1.5% ] 1.12% | 14,618,579 | 0.94% |
[ 1.0% - 1.5% ] 1.43% | 6,549,507 | 1.2% |
[ 1.5% - 2.0% ] 1.75% | 5,716,764 | 1.0% |
[ 2.0% - 2.5% ] 2.04% | 3,231,611 | 1.2% |
[ 2.0% - 2.5% ] 2.36% | 2,730,894 | 1.1% |
[ 2.5% - 3.0% ] 2.75% | 929,842 | 1.8% |
[ 3.0% - 3.5% ] 3.04% | 534,830 | 1.5% |
[ 3.0% - 3.5% ] 3.33% | 526,676 | 1.5% |
[ 3.5% - 4.0% ] 3.61% | 539,332 | 0.32% |
[ 4.0% - 4.5% ] 4.28% | 163,590 | 0.91% |
[ 4.5% - 5.0% ] 4.61% | 4,728 | 12.3% |
[ 4.5% - 5.0% ] 4.90% | 136,490 | 0.42% |
[ 5.0% - 5.5% ] 5.20% | 45,329 | 1.2% |
[ 5.5% - 6.0% ] 5.57% | 44,597 | 1.6% |
[ 6.0% - 6.5% ] 6.27% | 36,246 | 5.4% |
[ 6.0% - 6.5% ] 6.45% | 60,386 | 0.62% |
[ 7.0% - 7.5% ] 7.32% | 15,613 | 0.57% |
[ 7.0% - 7.5% ] 7.43% | 3,593 | 5.3% |
[ 7.5% - 8.0% ] 7.78% | 35,116 | 1.2% |
[ 8.5% - 9.0% ] 8.59% | 44,450 | 1.1% |
[ 8.5% - 9.0% ] 8.65% | 4,555 | 4.7% |
[ 9.0% - 9.5% ] 9.18% | 52,578 | 0.47% |
[ 9.0% - 9.5% ] 9.31% | 19,083 | 1.7% |
[ 10.0% - 10.5% ] 10.16% | 6,499 | 4.9% |
[ 10.0% - 10.5% ] 10.41% | 92,253 | 3.1% |
[ 11.0% - 11.5% ] 11.33% | 13,749 | 3.4% |
[ 11.5% - 12.0% ] 11.60% | 5,921 | 1.5% |
[ 12.0% - 12.5% ] 12.08% | 44,280 | 0.45% |
[ 12.0% - 12.5% ] 12.37% | 42,778 | 1.3% |
[ 12.5% - 13.0% ] 12.58% | 39,873 | 0.35% |
[ 13.5% - 14.0% ] 13.74% | 157,185 | 1.7% |
[ 14.0% - 14.5% ] 14.13% | 52,328 | 0.37% |
[ 16.0% - 16.5% ] 16.12% | 69,391 | 3.2% |
[ 17.0% - 17.5% ] 17.13% | 13,919 | 4.4% |
[ 17.0% - 17.5% ] 17.48% | 134,470 | 0.39% |
[ 17.5% - 18.0% ] 17.85% | 49,623 | 1.1% |
[ 19.0% - 19.5% ] 19.02% | 105,570 | 0.72% |
[ 19.0% - 19.5% ] 19.37% | 27,233 | 2.9% |
[ 20.5% - 21.0% ] 20.64% | 25,902 | 3.0% |
[ 20.5% - 21.0% ] 20.99% | 22,701 | 2.0% |
[ 21.5% - 22.0% ] 21.53% | 17,604 | 0.83% |
[ 23.5% - 24.0% ] 23.54% | 6,469 | 6.0% |
[ 24.5% - 25.0% ] 24.64% | 2,902 | 1.1% |
[ 26.5% - 27.0% ] 26.89% | 348,547 | 0.36% |
[ 30.5% - 31.0% ] 30.85% | 50,453 | 0.35% |
[ 31.5% - 32.0% ] 31.87% | 47,627 | 0.38% |
[ 33.5% - 34.0% ] 33.55% | 25,957 | 0.75% |
[ 34.5% - 35.0% ] 34.58% | 38,674 | 0.60% |
[ 35.5% - 36.0% ] 35.67% | 45,038 | 0.38% |
[ 36.0% - 36.5% ] 36.04% | 55,888 | 0.52% |
[ 38.0% - 38.5% ] 38.32% | 46,812 | 0.49% |
[ 38.5% - 39.0% ] 38.62% | 35,493 | 0.95% |
[ 39.5% - 40.0% ] 39.65% | 29,490 | 4.5% |
[ 40.0% - 40.5% ] 40.46% | 54,362 | 2.7% |
[ 43.5% - 44.0% ] 43.79% | 733 | 7.1% |
[ 44.5% - 45.0% ] 44.83% | 21,546 | 1.8% |