Chickasaw Married-couple Households
COMPARE
Chickasaw
Select to Compare
Married-couple Households
Chickasaw Married-couple Households
45.9%
MARRIED-COUPLE HOUSEHOLDS
22.7/ 100
METRIC RATING
195th/ 347
METRIC RANK
Chickasaw Married-couple Households Correlation Chart
The statistical analysis conducted on geographies consisting of 147,672,630 people shows a poor negative correlation between the proportion of Chickasaw and percentage of married-couple family households in the United States with a correlation coefficient (R) of -0.197 and weighted average of 45.9%. On average, for every 1% (one percent) increase in Chickasaw within a typical geography, there is a decrease of 0.28% in percentage of married-couple family households.
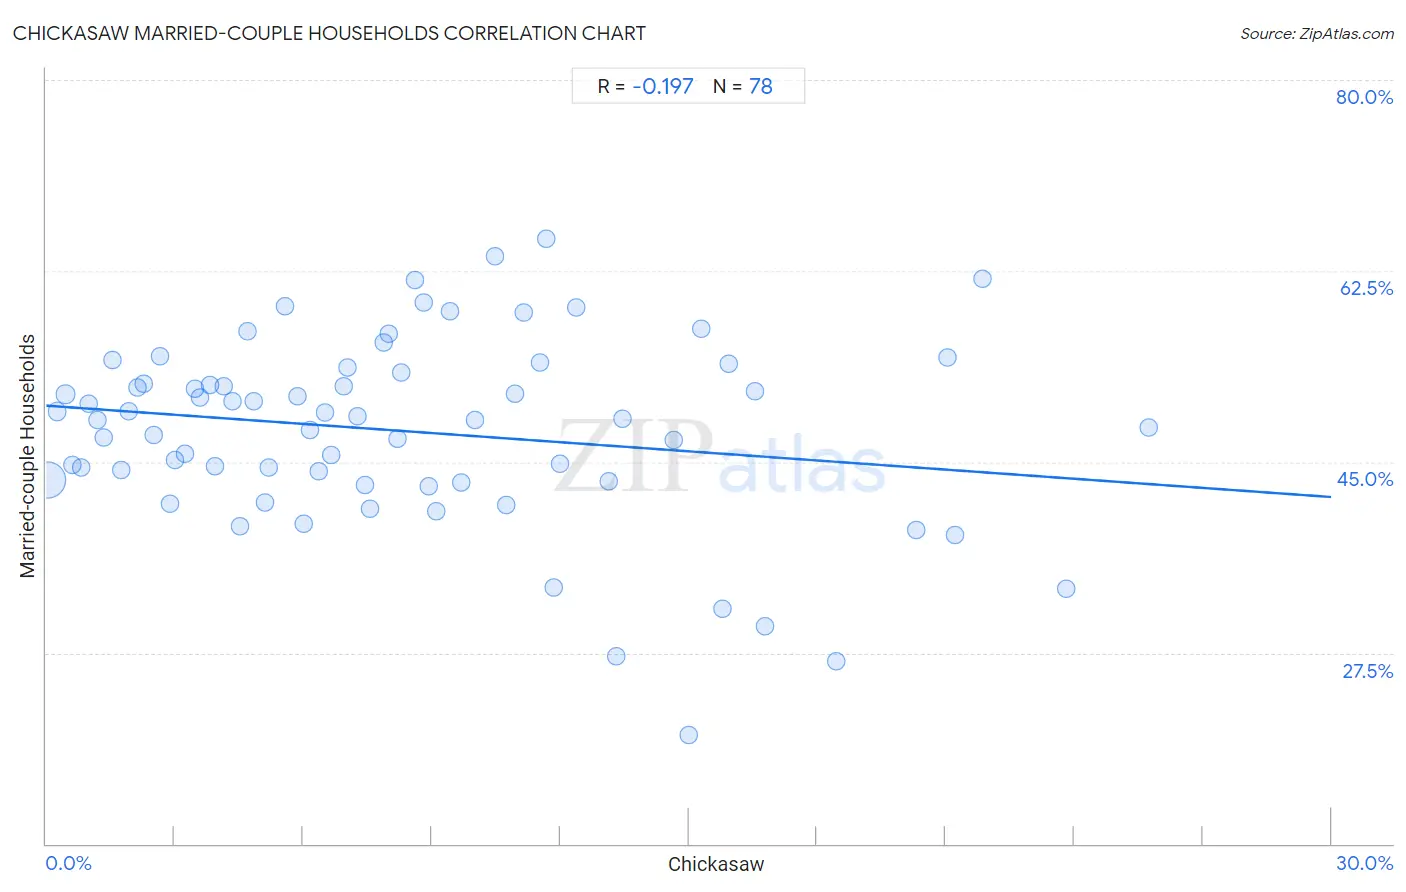
It is essential to understand that the correlation between the percentage of Chickasaw and percentage of married-couple family households does not imply a direct cause-and-effect relationship. It remains uncertain whether the presence of Chickasaw influences an upward or downward trend in the level of percentage of married-couple family households within an area, or if Chickasaw simply ended up residing in those areas with higher or lower levels of percentage of married-couple family households due to other factors.
Demographics Similar to Chickasaw by Married-couple Households
In terms of married-couple households, the demographic groups most similar to Chickasaw are Mexican American Indian (45.9%, a difference of 0.030%), Immigrants from South America (45.9%, a difference of 0.030%), Taiwanese (45.9%, a difference of 0.040%), Cambodian (45.9%, a difference of 0.080%), and Immigrants from Northern Africa (46.0%, a difference of 0.10%).
| Demographics | Rating | Rank | Married-couple Households |
| South American Indians | 28.4 /100 | #188 | Fair 46.0% |
| Immigrants from Latvia | 26.9 /100 | #189 | Fair 46.0% |
| Immigrants from Kuwait | 25.6 /100 | #190 | Fair 46.0% |
| Choctaw | 24.9 /100 | #191 | Fair 46.0% |
| Immigrants from Northern Africa | 24.6 /100 | #192 | Fair 46.0% |
| Taiwanese | 23.4 /100 | #193 | Fair 45.9% |
| Mexican American Indians | 23.3 /100 | #194 | Fair 45.9% |
| Chickasaw | 22.7 /100 | #195 | Fair 45.9% |
| Immigrants from South America | 22.2 /100 | #196 | Fair 45.9% |
| Cambodians | 21.3 /100 | #197 | Fair 45.9% |
| Ottawa | 19.4 /100 | #198 | Poor 45.8% |
| Carpatho Rusyns | 15.7 /100 | #199 | Poor 45.7% |
| Potawatomi | 15.6 /100 | #200 | Poor 45.7% |
| Immigrants from Serbia | 15.2 /100 | #201 | Poor 45.7% |
| Immigrants from Central America | 14.2 /100 | #202 | Poor 45.7% |
Chickasaw Married-couple Households Correlation Summary
| Measurement | Chickasaw Data | Married-couple Households Data |
| Minimum | 0.032% | 20.0% |
| Maximum | 25.7% | 65.4% |
| Range | 25.7% | 45.4% |
| Mean | 8.4% | 47.8% |
| Median | 7.4% | 48.9% |
| Interquartile 25% (IQ1) | 3.6% | 43.2% |
| Interquartile 75% (IQ3) | 11.9% | 53.2% |
| Interquartile Range (IQR) | 8.3% | 10.0% |
| Standard Deviation (Sample) | 6.1% | 8.7% |
| Standard Deviation (Population) | 6.1% | 8.6% |
Correlation Details
| Chickasaw Percentile | Sample Size | Married-couple Households |
[ 0.0% - 0.5% ] 0.032% | 136,647,910 | 43.4% |
[ 0.0% - 0.5% ] 0.25% | 5,292,005 | 49.6% |
[ 0.0% - 0.5% ] 0.45% | 1,603,236 | 51.2% |
[ 0.5% - 1.0% ] 0.60% | 1,611,719 | 44.7% |
[ 0.5% - 1.0% ] 0.83% | 822,648 | 44.5% |
[ 0.5% - 1.0% ] 0.99% | 474,840 | 50.4% |
[ 1.0% - 1.5% ] 1.19% | 233,583 | 48.8% |
[ 1.0% - 1.5% ] 1.35% | 249,739 | 47.2% |
[ 1.5% - 2.0% ] 1.54% | 89,231 | 54.4% |
[ 1.5% - 2.0% ] 1.74% | 88,765 | 44.2% |
[ 1.5% - 2.0% ] 1.93% | 53,323 | 49.7% |
[ 2.0% - 2.5% ] 2.13% | 48,029 | 51.9% |
[ 2.0% - 2.5% ] 2.28% | 55,156 | 52.2% |
[ 2.5% - 3.0% ] 2.51% | 15,979 | 47.5% |
[ 2.5% - 3.0% ] 2.66% | 16,025 | 54.7% |
[ 2.5% - 3.0% ] 2.88% | 67,875 | 41.2% |
[ 3.0% - 3.5% ] 3.00% | 18,539 | 45.2% |
[ 3.0% - 3.5% ] 3.24% | 16,118 | 45.8% |
[ 3.0% - 3.5% ] 3.46% | 7,995 | 51.7% |
[ 3.5% - 4.0% ] 3.58% | 7,909 | 51.0% |
[ 3.5% - 4.0% ] 3.83% | 1,750 | 52.1% |
[ 3.5% - 4.0% ] 3.93% | 2,773 | 44.6% |
[ 4.0% - 4.5% ] 4.14% | 4,957 | 52.0% |
[ 4.0% - 4.5% ] 4.35% | 20,308 | 50.5% |
[ 4.5% - 5.0% ] 4.53% | 26,620 | 39.1% |
[ 4.5% - 5.0% ] 4.70% | 4,529 | 56.9% |
[ 4.5% - 5.0% ] 4.86% | 2,552 | 50.6% |
[ 5.0% - 5.5% ] 5.10% | 4,663 | 41.3% |
[ 5.0% - 5.5% ] 5.18% | 40,906 | 44.5% |
[ 5.5% - 6.0% ] 5.57% | 4,596 | 59.3% |
[ 5.5% - 6.0% ] 5.86% | 290 | 51.1% |
[ 5.5% - 6.0% ] 6.00% | 4,318 | 39.3% |
[ 6.0% - 6.5% ] 6.17% | 665 | 47.9% |
[ 6.0% - 6.5% ] 6.36% | 6,967 | 44.2% |
[ 6.5% - 7.0% ] 6.51% | 215 | 49.5% |
[ 6.5% - 7.0% ] 6.65% | 1,234 | 45.6% |
[ 6.5% - 7.0% ] 6.95% | 4,633 | 51.9% |
[ 7.0% - 7.5% ] 7.04% | 1,108 | 53.7% |
[ 7.0% - 7.5% ] 7.28% | 8,632 | 49.2% |
[ 7.0% - 7.5% ] 7.45% | 2,925 | 42.9% |
[ 7.5% - 8.0% ] 7.56% | 6,148 | 40.7% |
[ 7.5% - 8.0% ] 7.88% | 2,449 | 55.9% |
[ 8.0% - 8.5% ] 8.00% | 350 | 56.8% |
[ 8.0% - 8.5% ] 8.21% | 633 | 47.2% |
[ 8.0% - 8.5% ] 8.29% | 4,329 | 53.2% |
[ 8.5% - 9.0% ] 8.60% | 651 | 61.6% |
[ 8.5% - 9.0% ] 8.81% | 919 | 59.6% |
[ 8.5% - 9.0% ] 8.93% | 1,803 | 42.8% |
[ 9.0% - 9.5% ] 9.11% | 966 | 40.4% |
[ 9.0% - 9.5% ] 9.44% | 4,841 | 58.8% |
[ 9.5% - 10.0% ] 9.69% | 351 | 43.2% |
[ 10.0% - 10.5% ] 10.00% | 7,518 | 48.9% |
[ 10.0% - 10.5% ] 10.49% | 286 | 63.8% |
[ 10.5% - 11.0% ] 10.75% | 930 | 41.1% |
[ 10.5% - 11.0% ] 10.95% | 5,491 | 51.2% |
[ 11.0% - 11.5% ] 11.15% | 1,283 | 58.7% |
[ 11.5% - 12.0% ] 11.54% | 208 | 54.1% |
[ 11.5% - 12.0% ] 11.68% | 1,516 | 65.4% |
[ 11.5% - 12.0% ] 11.85% | 16,629 | 33.4% |
[ 11.5% - 12.0% ] 11.98% | 31,368 | 44.8% |
[ 12.0% - 12.5% ] 12.37% | 897 | 59.2% |
[ 13.0% - 13.5% ] 13.13% | 8,460 | 43.2% |
[ 13.0% - 13.5% ] 13.31% | 3,110 | 27.2% |
[ 13.0% - 13.5% ] 13.45% | 119 | 48.9% |
[ 14.5% - 15.0% ] 14.64% | 560 | 47.0% |
[ 15.0% - 15.5% ] 15.00% | 40 | 20.0% |
[ 15.0% - 15.5% ] 15.30% | 791 | 57.2% |
[ 15.5% - 16.0% ] 15.79% | 190 | 31.5% |
[ 15.5% - 16.0% ] 15.93% | 841 | 53.9% |
[ 16.5% - 17.0% ] 16.55% | 145 | 51.4% |
[ 16.5% - 17.0% ] 16.79% | 262 | 29.9% |
[ 18.0% - 18.5% ] 18.46% | 428 | 26.7% |
[ 20.0% - 20.5% ] 20.31% | 64 | 38.7% |
[ 21.0% - 21.5% ] 21.05% | 114 | 54.5% |
[ 21.0% - 21.5% ] 21.23% | 212 | 38.3% |
[ 21.5% - 22.0% ] 21.86% | 988 | 61.7% |
[ 23.5% - 24.0% ] 23.81% | 189 | 33.3% |
[ 25.5% - 26.0% ] 25.74% | 1,286 | 48.2% |