Colombian Disability Age Under 5

COMPARE

Colombian
Race
Ancestry
AfghanAfricanAlaska NativeAlaskan AthabascanAlbanianAleutAlsatianAmericanApacheArabArapahoArgentineanArmenianAssyrian/Chaldean/SyriacAustralianAustrianBahamianBangladeshiBarbadianBasqueBelgianBelizeanBermudanBhutaneseBlackfeetBolivianBrazilianBritishBritish West IndianBulgarianBurmeseCajunCambodianCanadianCape VerdeanCarpatho RusynCelticCentral AmericanCentral American IndianCherokeeCheyenneChickasawChileanChineseChippewaChoctawColombianColvilleComancheCosta RicanCreeCreekCroatianCrowCubanCypriotCzechCzechoslovakianDanishDelawareDominicanDutchDutch West IndianEastern EuropeanEcuadorianEgyptianEnglishEstonianEthiopianEuropeanFijianFilipinoFinnishFrenchFrench American IndianFrench CanadianGermanGerman RussianGhanaianGreekGuamanian/ChamorroGuatemalanGuyaneseHaitianHmongHonduranHopiHoumaHungarianIcelanderIndian (Asian)IndonesianInupiatIranianIraqiIrishIroquoisIsraeliItalianJamaicanJapaneseJordanianKenyanKiowaKoreanLaotianLatvianLebaneseLiberianLithuanianLumbeeLuxembourgerMacedonianMalaysianMalteseMarshalleseMenomineeMexicanMexican American IndianMongolianMoroccanNative HawaiianNavajoNepaleseNew ZealanderNicaraguanNigerianNorthern EuropeanNorwegianOkinawanOsageOttawaPaiutePakistaniPalestinianPanamanianParaguayanPennsylvania GermanPeruvianPimaPolishPortuguesePotawatomiPuebloPuerto RicanPuget Sound SalishRomanianRussianSalvadoranSamoanScandinavianScotch-IrishScottishSeminoleSenegaleseSerbianShoshoneSierra LeoneanSiouxSlavicSlovakSloveneSomaliSouth AfricanSouth AmericanSouth American IndianSoviet UnionSpaniardSpanishSpanish AmericanSpanish American IndianSri LankanSubsaharan AfricanSudaneseSwedishSwissSyrianTaiwaneseThaiTlingit-HaidaTohono O'OdhamTonganTrinidadian and TobagonianTsimshianTurkishU.S. Virgin IslanderUgandanUkrainianUruguayanUteVenezuelanVietnameseWelshWest IndianYakamaYaquiYugoslavianYumanYup'ikZimbabwean
Immigration
NonimmigrantsImmigrantsAfghanistanAfricaAlbaniaArgentinaArmeniaAsiaAustraliaAustriaBahamasBangladeshBarbadosBelarusBelgiumBelizeBoliviaBosnia and HerzegovinaBrazilBulgariaBurma/MyanmarCabo VerdeCambodiaCameroonCanadaCaribbeanCentral AmericaChileChinaColombiaCongoCosta RicaCroatiaCubaCzechoslovakiaDenmarkDominicaDominican RepublicEastern AfricaEastern AsiaEastern EuropeEcuadorEgyptEl SalvadorEnglandEritreaEthiopiaEuropeFijiFranceGermanyGhanaGreeceGrenadaGuatemalaGuyanaHaitiHondurasHong KongHungaryIndiaIndonesiaIranIraqIrelandIsraelItalyJamaicaJapanJordanKazakhstanKenyaKoreaKuwaitLaosLatin AmericaLatviaLebanonLiberiaLithuaniaMalaysiaMexicoMicronesiaMiddle AfricaMoldovaMoroccoNepalNetherlandsNicaraguaNigeriaNorth AmericaNorth MacedoniaNorthern AfricaNorthern EuropeNorwayOceaniaPakistanPanamaPeruPhilippinesPolandPortugalRomaniaRussiaSaudi ArabiaScotlandSenegalSerbiaSierra LeoneSingaporeSomaliaSouth AfricaSouth AmericaSouth Central AsiaSouth Eastern AsiaSouthern EuropeSpainSri LankaSt. Vincent and the GrenadinesSudanSwedenSwitzerlandSyriaTaiwanThailandTrinidad and TobagoTurkeyUgandaUkraineUruguayUzbekistanVenezuelaVietnamWest IndiesWestern AfricaWestern AsiaWestern EuropeYemenZaireZimbabweAzores
Select to Compare
Race
Ancestry
AfghanAfricanAlaska NativeAlaskan AthabascanAlbanianAleutAlsatianAmericanApacheArabArapahoArgentineanArmenianAssyrian/Chaldean/SyriacAustralianAustrianBahamianBangladeshiBarbadianBasqueBelgianBelizeanBermudanBhutaneseBlackfeetBolivianBrazilianBritishBritish West IndianBulgarianBurmeseCajunCambodianCanadianCape VerdeanCarpatho RusynCelticCentral AmericanCentral American IndianCherokeeCheyenneChickasawChileanChineseChippewaChoctawColvilleComancheCosta RicanCreeCreekCroatianCrowCubanCypriotCzechCzechoslovakianDanishDelawareDominicanDutchDutch West IndianEastern EuropeanEcuadorianEgyptianEnglishEstonianEthiopianEuropeanFijianFilipinoFinnishFrenchFrench American IndianFrench CanadianGermanGerman RussianGhanaianGreekGuamanian/ChamorroGuatemalanGuyaneseHaitianHmongHonduranHopiHoumaHungarianIcelanderIndian (Asian)IndonesianInupiatIranianIraqiIrishIroquoisIsraeliItalianJamaicanJapaneseJordanianKenyanKiowaKoreanLaotianLatvianLebaneseLiberianLithuanianLumbeeLuxembourgerMacedonianMalaysianMalteseMarshalleseMenomineeMexicanMexican American IndianMongolianMoroccanNative HawaiianNavajoNepaleseNew ZealanderNicaraguanNigerianNorthern EuropeanNorwegianOkinawanOsageOttawaPaiutePakistaniPalestinianPanamanianParaguayanPennsylvania GermanPeruvianPimaPolishPortuguesePotawatomiPuebloPuerto RicanPuget Sound SalishRomanianRussianSalvadoranSamoanScandinavianScotch-IrishScottishSeminoleSenegaleseSerbianShoshoneSierra LeoneanSiouxSlavicSlovakSloveneSomaliSouth AfricanSouth AmericanSouth American IndianSoviet UnionSpaniardSpanishSpanish AmericanSpanish American IndianSri LankanSubsaharan AfricanSudaneseSwedishSwissSyrianTaiwaneseThaiTlingit-HaidaTohono O'OdhamTonganTrinidadian and TobagonianTsimshianTurkishU.S. Virgin IslanderUgandanUkrainianUruguayanUteVenezuelanVietnameseWelshWest IndianYakamaYaquiYugoslavianYumanYup'ikZimbabwean
Immigration
NonimmigrantsImmigrantsAfghanistanAfricaAlbaniaArgentinaArmeniaAsiaAustraliaAustriaBahamasBangladeshBarbadosBelarusBelgiumBelizeBoliviaBosnia and HerzegovinaBrazilBulgariaBurma/MyanmarCabo VerdeCambodiaCameroonCanadaCaribbeanCentral AmericaChileChinaColombiaCongoCosta RicaCroatiaCubaCzechoslovakiaDenmarkDominicaDominican RepublicEastern AfricaEastern AsiaEastern EuropeEcuadorEgyptEl SalvadorEnglandEritreaEthiopiaEuropeFijiFranceGermanyGhanaGreeceGrenadaGuatemalaGuyanaHaitiHondurasHong KongHungaryIndiaIndonesiaIranIraqIrelandIsraelItalyJamaicaJapanJordanKazakhstanKenyaKoreaKuwaitLaosLatin AmericaLatviaLebanonLiberiaLithuaniaMalaysiaMexicoMicronesiaMiddle AfricaMoldovaMoroccoNepalNetherlandsNicaraguaNigeriaNorth AmericaNorth MacedoniaNorthern AfricaNorthern EuropeNorwayOceaniaPakistanPanamaPeruPhilippinesPolandPortugalRomaniaRussiaSaudi ArabiaScotlandSenegalSerbiaSierra LeoneSingaporeSomaliaSouth AfricaSouth AmericaSouth Central AsiaSouth Eastern AsiaSouthern EuropeSpainSri LankaSt. Vincent and the GrenadinesSudanSwedenSwitzerlandSyriaTaiwanThailandTrinidad and TobagoTurkeyUgandaUkraineUruguayUzbekistanVenezuelaVietnamWest IndiesWestern AfricaWestern AsiaWestern EuropeYemenZaireZimbabweAzores
Disability Age Under 5
Income
Poverty
Unemployment
Labor Participation
Family Structure
Vehicle Availability
Education Level
Disability

Colombian Disability Age Under 5
Good

1.2%
DISABILITY | AGE UNDER 5
65.8/ 100
METRIC RATING
159th/ 347
METRIC RANK

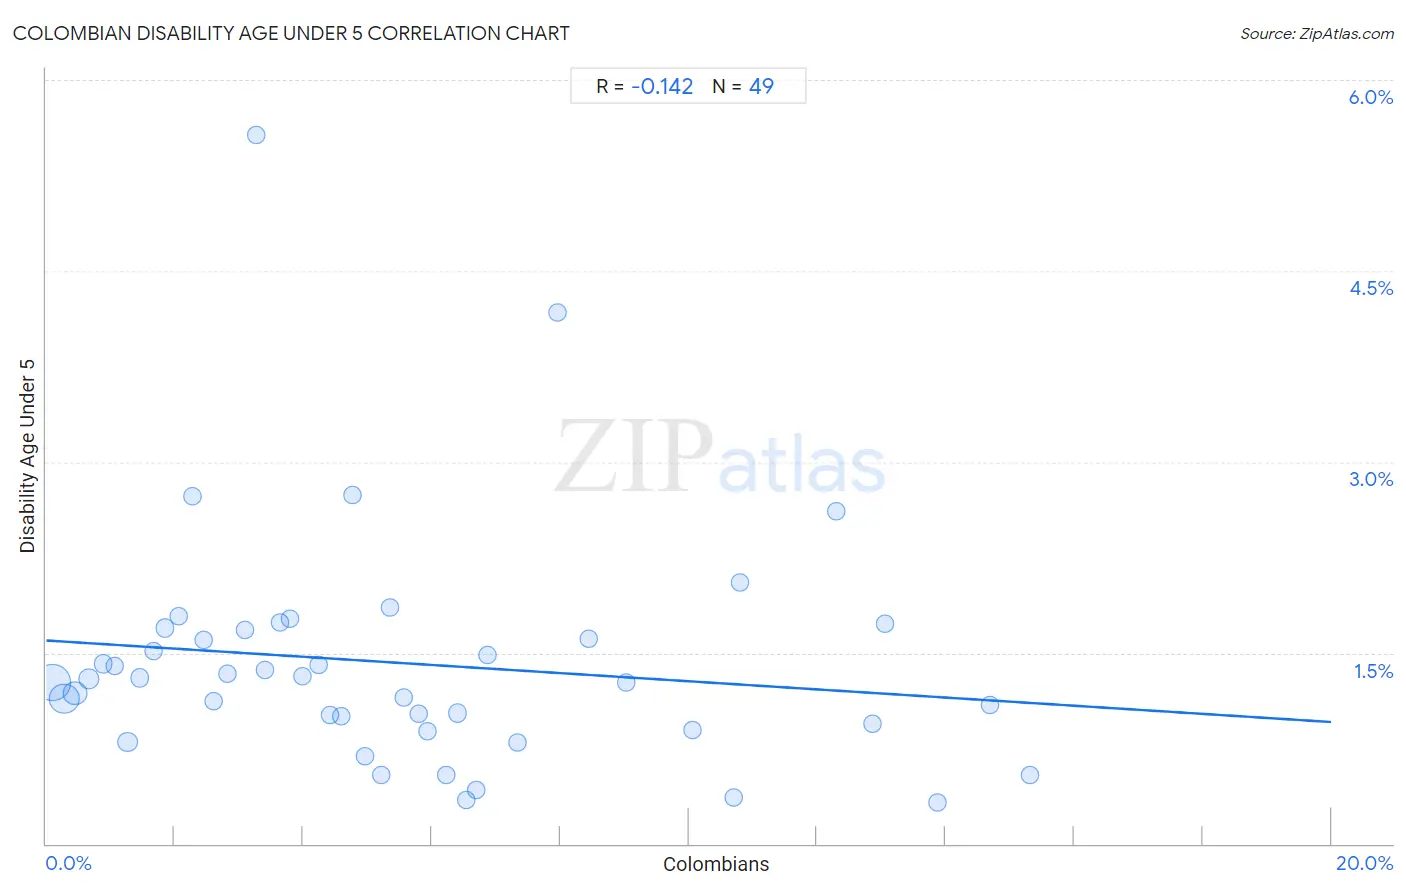
Colombian Disability Age Under 5 Correlation Chart

The statistical analysis conducted on geographies consisting of 225,886,034 people shows a poor negative correlation between the proportion of Colombians and percentage of population with a disability under the age of 5 in the United States with a correlation coefficient (R) of -0.142 and weighted average of 1.2%. On average, for every 1% (one percent) increase in Colombians within a typical geography, there is a decrease of 0.032% in percentage of population with a disability under the age of 5.
Colombian Disability Age Under 5
It is essential to understand that the correlation between the percentage of Colombians and percentage of population with a disability under the age of 5 does not imply a direct cause-and-effect relationship. It remains uncertain whether the presence of Colombians influences an upward or downward trend in the level of percentage of population with a disability under the age of 5 within an area, or if Colombians simply ended up residing in those areas with higher or lower levels of percentage of population with a disability under the age of 5 due to other factors.

Demographics Similar to Colombians by Disability Age Under 5

In terms of disability age under 5, the demographic groups most similar to Colombians are Immigrants from Latin America (1.2%, a difference of 0.0%), Arab (1.2%, a difference of 0.060%), Immigrants from Africa (1.2%, a difference of 0.070%), Immigrants from South America (1.2%, a difference of 0.12%), and Guatemalan (1.2%, a difference of 0.22%).
DemographicsRating | RankDisability Age Under 5
Hondurans
72.5
/100
|
#152
Good
1.2%
Immigrants from Thailand
69.4
/100
|
#153
Good
1.2%
Uruguayans
68.8
/100
|
#154
Good
1.2%
Immigrants from Ghana
68.7
/100
|
#155
Good
1.2%
Hawaiians
68.5
/100
|
#156
Good
1.2%
Immigrants from South America
67.0
/100
|
#157
Good
1.2%
Arabs
66.4
/100
|
#158
Good
1.2%
Colombians
65.8
/100
|
#159
Good
1.2%
Immigrants from Latin America
65.8
/100
|
#160
Good
1.2%
Immigrants from Africa
65.1
/100
|
#161
Good
1.2%
Guatemalans
63.6
/100
|
#162
Good
1.2%
Immigrants from Guatemala
63.2
/100
|
#163
Good
1.2%
Laotians
62.8
/100
|
#164
Good
1.2%
Immigrants from Kuwait
62.6
/100
|
#165
Good
1.2%
Immigrants from Central America
61.4
/100
|
#166
Good
1.2%

Colombian Disability Age Under 5 Correlation Summary

MeasurementColombian DataDisability Age Under 5 Data
Minimum0.096%0.32%
Maximum15.3%5.6%
Range15.2%5.2%
Mean5.6%1.4%
Median4.8%1.3%
Interquartile 25% (IQ1)2.4%0.92%
Interquartile 75% (IQ3)7.6%1.7%
Interquartile Range (IQR)5.3%0.77%
Standard Deviation (Sample)4.1%0.92%
Standard Deviation (Population)4.1%0.91%

Correlation Details

Colombian PercentileSample SizeDisability Age Under 5
[
0.0%
-
0.5%
]
0.096%
93,723,4931.3%
[
0.0%
-
0.5%
]
0.28%
57,236,2781.1%
[
0.0%
-
0.5%
]
0.45%
30,559,9111.2%
[
0.5%
-
1.0%
]
0.67%
11,490,3551.3%
[
0.5%
-
1.0%
]
0.89%
5,326,3581.4%
[
1.0%
-
1.5%
]
1.07%
3,033,0871.4%
[
1.0%
-
1.5%
]
1.27%
11,395,1120.80%
[
1.0%
-
1.5%
]
1.45%
2,573,1251.3%
[
1.5%
-
2.0%
]
1.68%
1,866,8621.5%
[
1.5%
-
2.0%
]
1.84%
730,9131.7%
[
2.0%
-
2.5%
]
2.07%
620,9841.8%
[
2.0%
-
2.5%
]
2.27%
401,1452.7%
[
2.0%
-
2.5%
]
2.44%
736,9471.6%
[
2.5%
-
3.0%
]
2.61%
821,1581.1%
[
2.5%
-
3.0%
]
2.81%
327,8471.3%
[
3.0%
-
3.5%
]
3.10%
486,9341.7%
[
3.0%
-
3.5%
]
3.27%
124,1025.6%
[
3.0%
-
3.5%
]
3.40%
466,4671.4%
[
3.5%
-
4.0%
]
3.63%
210,5211.7%
[
3.5%
-
4.0%
]
3.80%
235,8581.8%
[
3.5%
-
4.0%
]
3.99%
264,0641.3%
[
4.0%
-
4.5%
]
4.24%
683,7381.4%
[
4.0%
-
4.5%
]
4.41%
212,8161.0%
[
4.5%
-
5.0%
]
4.59%
285,1661.0%
[
4.5%
-
5.0%
]
4.77%
44,1152.7%
[
4.5%
-
5.0%
]
4.96%
174,4840.68%
[
5.0%
-
5.5%
]
5.21%
230,3700.54%
[
5.0%
-
5.5%
]
5.35%
123,7491.9%
[
5.5%
-
6.0%
]
5.56%
111,0531.1%
[
5.5%
-
6.0%
]
5.79%
138,3561.0%
[
5.5%
-
6.0%
]
5.94%
24,5970.88%
[
6.0%
-
6.5%
]
6.23%
177,7020.54%
[
6.0%
-
6.5%
]
6.40%
251,3411.0%
[
6.5%
-
7.0%
]
6.53%
64,2030.35%
[
6.5%
-
7.0%
]
6.70%
41,6610.42%
[
6.5%
-
7.0%
]
6.87%
35,0821.5%
[
7.0%
-
7.5%
]
7.33%
96,5100.79%
[
7.5%
-
8.0%
]
7.95%
16,4184.2%
[
8.0%
-
8.5%
]
8.44%
25,2831.6%
[
9.0%
-
9.5%
]
9.02%
57,0661.3%
[
10.0%
-
10.5%
]
10.05%
63,9860.89%
[
10.5%
-
11.0%
]
10.70%
121,1690.37%
[
10.5%
-
11.0%
]
10.81%
67,0012.0%
[
12.0%
-
12.5%
]
12.30%
45,3572.6%
[
12.5%
-
13.0%
]
12.86%
56,4840.94%
[
13.0%
-
13.5%
]
13.05%
19,6251.7%
[
13.5%
-
14.0%
]
13.88%
26,5480.32%
[
14.5%
-
15.0%
]
14.68%
42,2071.1%
[
15.0%
-
15.5%
]
15.30%
18,4260.54%