Lexington city, VA Map & Demographics
Lexington city Map
Lexington city Overview
$29,117
PER CAPITA INCOME
$103,359
AVG FAMILY INCOME
$93,651
AVG HOUSEHOLD INCOME
29.7%
WAGE / INCOME GAP [ % ]
70.3¢/ $1
WAGE / INCOME GAP [ $ ]
0.41
INEQUALITY / GINI INDEX
7,346
TOTAL POPULATION
4,285
MALE POPULATION
3,061
FEMALE POPULATION
139.99
MALES / 100 FEMALES
71.44
FEMALES / 100 MALES
22.7
MEDIAN AGE
2.8
AVG FAMILY SIZE
2.1
AVG HOUSEHOLD SIZE
2,893
LABOR FORCE [ PEOPLE ]
41.8%
PERCENT IN LABOR FORCE
2.5%
UNEMPLOYMENT RATE
Income in Lexington city
Income Overview in Lexington city
Per Capita Income in Lexington city is $29,117, while median incomes of families and households are $103,359 and $93,651 respectively.
| Characteristic | Number | Measure |
| Per Capita Income | 7,346 | $29,117 |
| Median Family Income | 911 | $103,359 |
| Mean Family Income | 911 | $128,473 |
| Median Household Income | 1,991 | $93,651 |
| Mean Household Income | 1,991 | $90,644 |
| Income Deficit | 911 | $0 |
| Wage / Income Gap (%) | 7,346 | 29.67% |
| Wage / Income Gap ($) | 7,346 | 70.33¢ per $1 |
| Gini / Inequality Index | 7,346 | 0.41 |
Earnings by Sex in Lexington city
Average Earnings in Lexington city are $12,070, $9,720 for men and $13,820 for women, a difference of 29.7%.
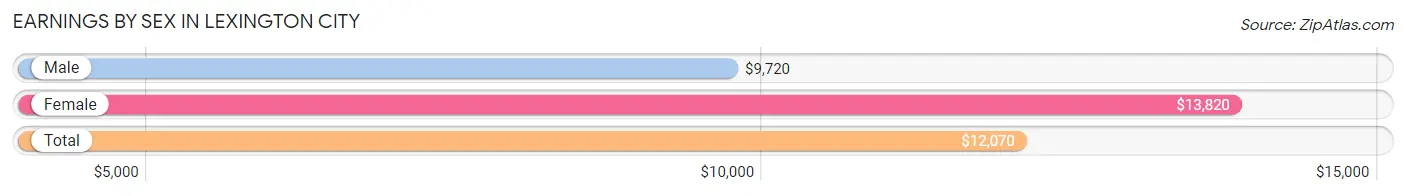
| Sex | Number | Average Earnings |
| Male | 2,718 (58.8%) | $9,720 |
| Female | 1,902 (41.2%) | $13,820 |
| Total | 4,620 (100.0%) | $12,070 |
Earnings by Sex by Income Bracket in Lexington city
The most common earnings brackets in Lexington city are $2,499 or less for men (616 | 22.7%) and $2,499 or less for women (477 | 25.1%).
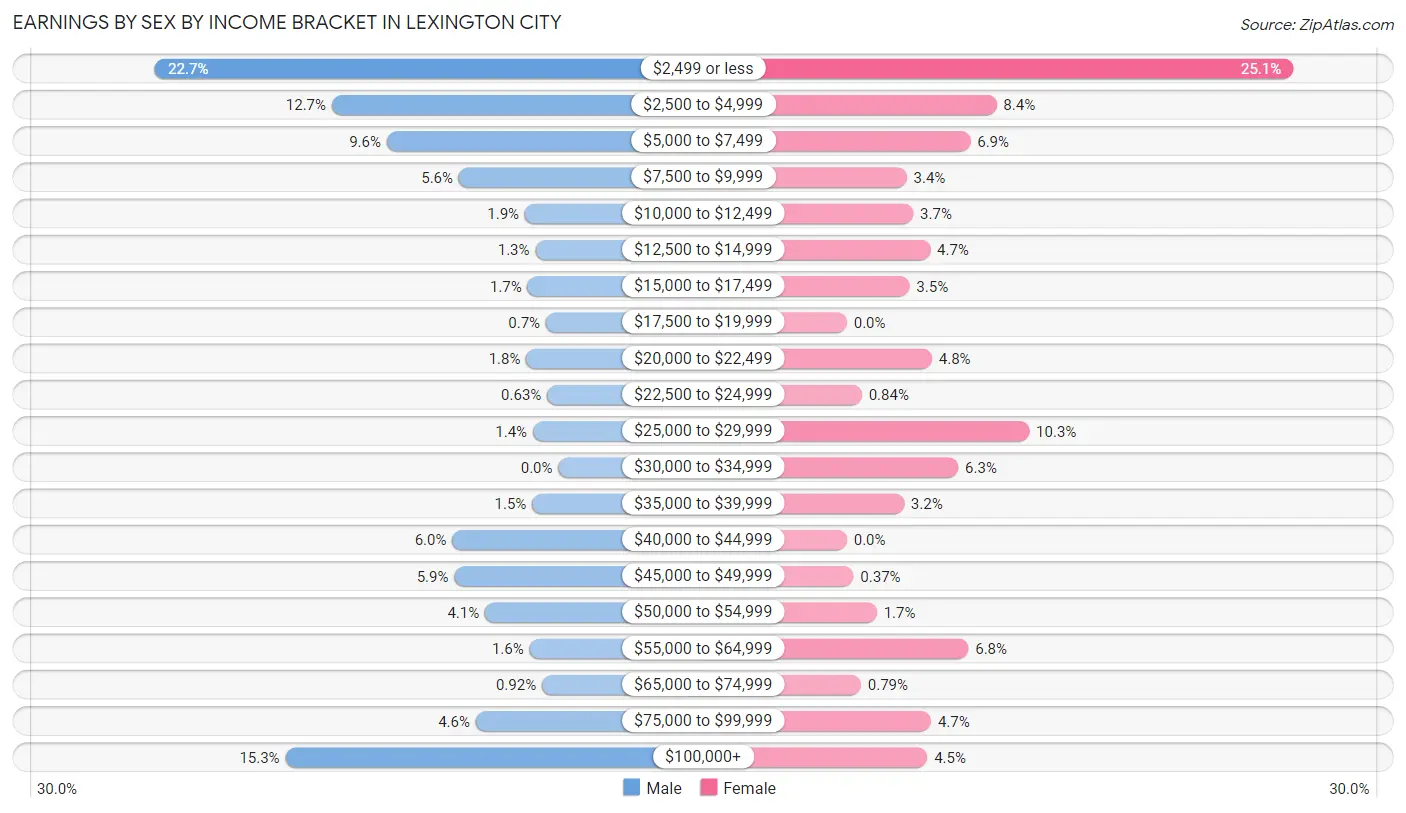
| Income | Male | Female |
| $2,499 or less | 616 (22.7%) | 477 (25.1%) |
| $2,500 to $4,999 | 346 (12.7%) | 160 (8.4%) |
| $5,000 to $7,499 | 262 (9.6%) | 132 (6.9%) |
| $7,500 to $9,999 | 152 (5.6%) | 64 (3.4%) |
| $10,000 to $12,499 | 51 (1.9%) | 71 (3.7%) |
| $12,500 to $14,999 | 35 (1.3%) | 89 (4.7%) |
| $15,000 to $17,499 | 47 (1.7%) | 67 (3.5%) |
| $17,500 to $19,999 | 19 (0.7%) | 0 (0.0%) |
| $20,000 to $22,499 | 49 (1.8%) | 91 (4.8%) |
| $22,500 to $24,999 | 17 (0.6%) | 16 (0.8%) |
| $25,000 to $29,999 | 39 (1.4%) | 195 (10.2%) |
| $30,000 to $34,999 | 0 (0.0%) | 119 (6.3%) |
| $35,000 to $39,999 | 40 (1.5%) | 61 (3.2%) |
| $40,000 to $44,999 | 162 (6.0%) | 0 (0.0%) |
| $45,000 to $49,999 | 159 (5.9%) | 7 (0.4%) |
| $50,000 to $54,999 | 112 (4.1%) | 32 (1.7%) |
| $55,000 to $64,999 | 44 (1.6%) | 130 (6.8%) |
| $65,000 to $74,999 | 25 (0.9%) | 15 (0.8%) |
| $75,000 to $99,999 | 126 (4.6%) | 90 (4.7%) |
| $100,000+ | 417 (15.3%) | 86 (4.5%) |
| Total | 2,718 (100.0%) | 1,902 (100.0%) |
Earnings by Sex by Educational Attainment in Lexington city
Average earnings in Lexington city are $55,179 for men and $32,885 for women, a difference of 40.4%. Men with an educational attainment of graduate degree enjoy the highest average annual earnings of $101,366, while those with high school diploma education earn the least with $45,323. Women with an educational attainment of bachelor's degree earn the most with the average annual earnings of $54,191, while those with high school diploma education have the smallest earnings of $25,917.
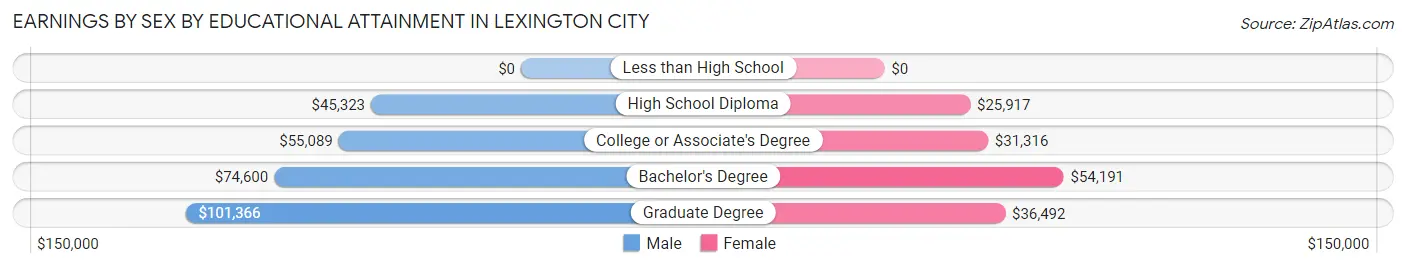
| Educational Attainment | Male Income | Female Income |
| Less than High School | - | - |
| High School Diploma | $45,323 | $25,917 |
| College or Associate's Degree | $55,089 | $31,316 |
| Bachelor's Degree | $74,600 | $54,191 |
| Graduate Degree | $101,366 | $36,492 |
| Total | $55,179 | $32,885 |
Family Income in Lexington city
Family Income Brackets in Lexington city
According to the Lexington city family income data, there are 326 families falling into the $100,000 to $149,999 income range, which is the most common income bracket and makes up 35.8% of all families.
| Income Bracket | # Families | % Families |
| Less than $10,000 | 0 | 0.0% |
| $10,000 to $14,999 | 0 | 0.0% |
| $15,000 to $24,999 | 38 | 4.2% |
| $25,000 to $34,999 | 17 | 1.9% |
| $35,000 to $49,999 | 0 | 0.0% |
| $50,000 to $74,999 | 113 | 12.4% |
| $75,000 to $99,999 | 282 | 31.0% |
| $100,000 to $149,999 | 326 | 35.8% |
| $150,000 to $199,999 | 63 | 6.9% |
| $200,000+ | 72 | 7.9% |
Family Income by Famaliy Size in Lexington city
3-person families (207 | 22.7%) account for the highest median family income in Lexington city with $146,301 per family, while 3-person families (207 | 22.7%) have the highest median income of $48,767 per family member.
| Income Bracket | # Families | Median Income |
| 2-Person Families | 519 (57.0%) | $96,210 |
| 3-Person Families | 207 (22.7%) | $146,301 |
| 4-Person Families | 108 (11.9%) | $136,143 |
| 5-Person Families | 77 (8.5%) | $130,560 |
| 6-Person Families | 0 (0.0%) | $0 |
| 7+ Person Families | 0 (0.0%) | $0 |
| Total | 911 (100.0%) | $103,359 |
Family Income by Number of Earners in Lexington city
The median family income in Lexington city is $103,359, with families comprising 2 earners (362) having the highest median family income of $134,063, while families with no earners (130) have the lowest median family income of $81,731, accounting for 39.7% and 14.3% of families, respectively.
| Number of Earners | # Families | Median Income |
| No Earners | 130 (14.3%) | $81,731 |
| 1 Earner | 292 (32.1%) | $95,507 |
| 2 Earners | 362 (39.7%) | $134,063 |
| 3+ Earners | 127 (13.9%) | $131,509 |
| Total | 911 (100.0%) | $103,359 |
Household Income in Lexington city
Household Income Brackets in Lexington city
With 603 households falling in the category, the $100,000 to $149,999 income range is the most frequent in Lexington city, accounting for 30.3% of all households. In contrast, only 72 households (3.6%) fall into the $200,000+ income bracket, making it the least populous group.
| Income Bracket | # Households | % Households |
| Less than $10,000 | 129 | 6.5% |
| $10,000 to $14,999 | 123 | 6.2% |
| $15,000 to $24,999 | 137 | 6.9% |
| $25,000 to $34,999 | 135 | 6.8% |
| $35,000 to $49,999 | 88 | 4.4% |
| $50,000 to $74,999 | 259 | 13.0% |
| $75,000 to $99,999 | 364 | 18.3% |
| $100,000 to $149,999 | 603 | 30.3% |
| $150,000 to $199,999 | 80 | 4.0% |
| $200,000+ | 72 | 3.6% |
Household Income by Householder Age in Lexington city
The median household income in Lexington city is $93,651, with the highest median household income of $98,639 found in the 45 to 64 years age bracket for the primary householder. A total of 541 households (27.2%) fall into this category. Meanwhile, the 15 to 24 years age bracket for the primary householder has the lowest median household income of $16,897, with 224 households (11.3%) in this group.
| Income Bracket | # Households | Median Income |
| 15 to 24 Years | 224 (11.3%) | $16,897 |
| 25 to 44 Years | 463 (23.3%) | $95,063 |
| 45 to 64 Years | 541 (27.2%) | $98,639 |
| 65+ Years | 763 (38.3%) | $96,130 |
| Total | 1,991 (100.0%) | $93,651 |
Poverty in Lexington city
Income Below Poverty by Sex and Age in Lexington city
With 18.8% poverty level for males and 14.4% for females among the residents of Lexington city, 18 to 24 year old males and 18 to 24 year old females are the most vulnerable to poverty, with 63 males (55.7%) and 151 females (58.8%) in their respective age groups living below the poverty level.
| Age Bracket | Male | Female |
| Under 5 Years | 41 (36.6%) | 0 (0.0%) |
| 5 Years | 0 (0.0%) | 0 (0.0%) |
| 6 to 11 Years | 0 (0.0%) | 0 (0.0%) |
| 12 to 14 Years | 0 (0.0%) | 0 (0.0%) |
| 15 Years | 0 (0.0%) | 0 (0.0%) |
| 16 and 17 Years | 0 (0.0%) | 0 (0.0%) |
| 18 to 24 Years | 63 (55.7%) | 151 (58.8%) |
| 25 to 34 Years | 293 (53.5%) | 0 (0.0%) |
| 35 to 44 Years | 0 (0.0%) | 0 (0.0%) |
| 45 to 54 Years | 0 (0.0%) | 16 (5.0%) |
| 55 to 64 Years | 0 (0.0%) | 82 (30.5%) |
| 65 to 74 Years | 0 (0.0%) | 21 (6.1%) |
| 75 Years and over | 0 (0.0%) | 29 (14.0%) |
| Total | 397 (18.8%) | 299 (14.4%) |
Income Above Poverty by Sex and Age in Lexington city
According to the poverty statistics in Lexington city, males aged 6 to 11 years and females aged under 5 years are the age groups that are most secure financially, with 100.0% of males and 100.0% of females in these age groups living above the poverty line.
| Age Bracket | Male | Female |
| Under 5 Years | 71 (63.4%) | 96 (100.0%) |
| 5 Years | 0 (0.0%) | 0 (0.0%) |
| 6 to 11 Years | 82 (100.0%) | 44 (100.0%) |
| 12 to 14 Years | 0 (0.0%) | 50 (100.0%) |
| 15 Years | 28 (100.0%) | 14 (100.0%) |
| 16 and 17 Years | 39 (100.0%) | 46 (100.0%) |
| 18 to 24 Years | 50 (44.3%) | 106 (41.2%) |
| 25 to 34 Years | 255 (46.5%) | 229 (100.0%) |
| 35 to 44 Years | 224 (100.0%) | 204 (100.0%) |
| 45 to 54 Years | 265 (100.0%) | 302 (95.0%) |
| 55 to 64 Years | 222 (100.0%) | 187 (69.5%) |
| 65 to 74 Years | 342 (100.0%) | 323 (93.9%) |
| 75 Years and over | 132 (100.0%) | 178 (86.0%) |
| Total | 1,710 (81.2%) | 1,779 (85.6%) |
Income Below Poverty Among Married-Couple Families in Lexington city
| Children | Above Poverty | Below Poverty |
| No Children | 497 (100.0%) | 0 (0.0%) |
| 1 or 2 Children | 198 (100.0%) | 0 (0.0%) |
| 3 or 4 Children | 77 (100.0%) | 0 (0.0%) |
| 5 or more Children | 0 (0.0%) | 0 (0.0%) |
| Total | 772 (100.0%) | 0 (0.0%) |
Income Below Poverty Among Single-Parent Households in Lexington city
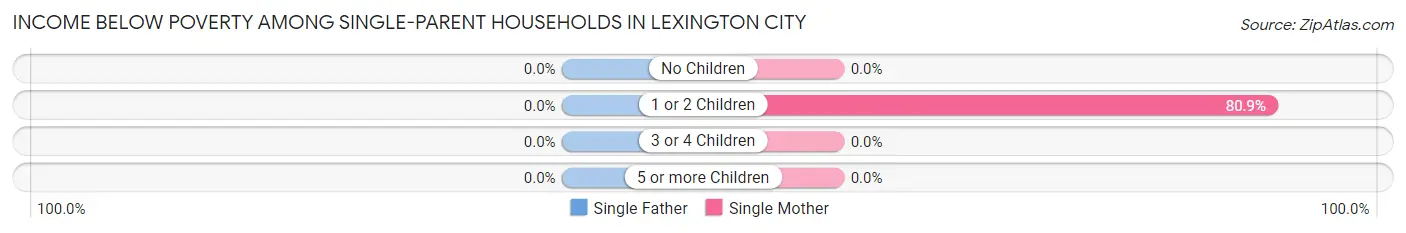
| Children | Single Father | Single Mother |
| No Children | 0 (0.0%) | 0 (0.0%) |
| 1 or 2 Children | 0 (0.0%) | 38 (80.8%) |
| 3 or 4 Children | 0 (0.0%) | 0 (0.0%) |
| 5 or more Children | 0 (0.0%) | 0 (0.0%) |
| Total | 0 (0.0%) | 38 (43.2%) |
Income Below Poverty Among Married-Couple vs Single-Parent Households in Lexington city
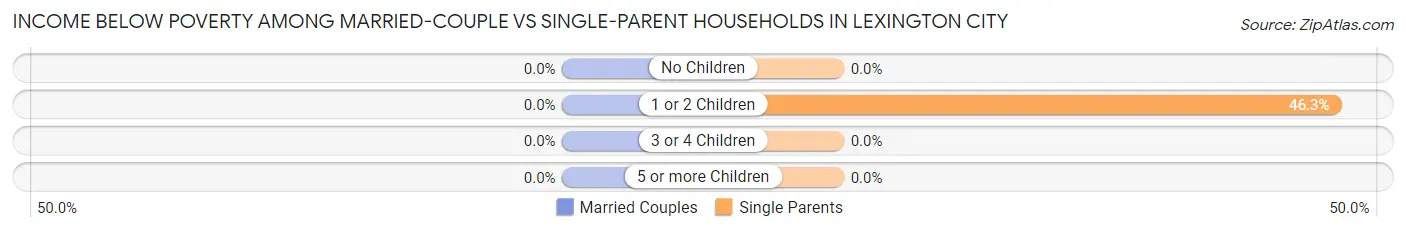
| Children | Married-Couple Families | Single-Parent Households |
| No Children | 0 (0.0%) | 0 (0.0%) |
| 1 or 2 Children | 0 (0.0%) | 38 (46.3%) |
| 3 or 4 Children | 0 (0.0%) | 0 (0.0%) |
| 5 or more Children | 0 (0.0%) | 0 (0.0%) |
| Total | 0 (0.0%) | 38 (27.3%) |
Race in Lexington city
The most populous races in Lexington city are White / Caucasian (6,136 | 83.5%), Two or more Races (443 | 6.0%), and Black / African American (380 | 5.2%).
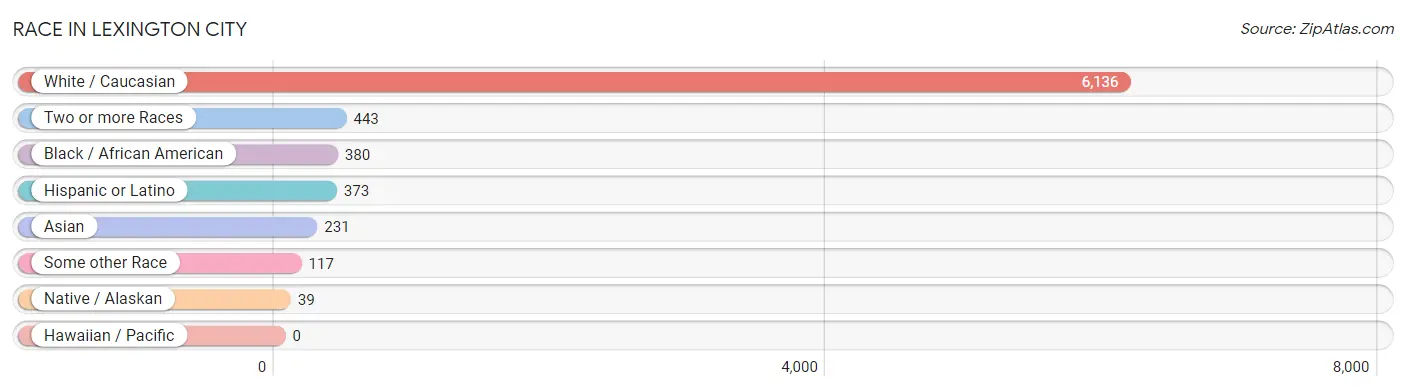
| Race | # Population | % Population |
| Asian | 231 | 3.1% |
| Black / African American | 380 | 5.2% |
| Hawaiian / Pacific | 0 | 0.0% |
| Hispanic or Latino | 373 | 5.1% |
| Native / Alaskan | 39 | 0.5% |
| White / Caucasian | 6,136 | 83.5% |
| Two or more Races | 443 | 6.0% |
| Some other Race | 117 | 1.6% |
| Total | 7,346 | 100.0% |
Ancestry in Lexington city
The most populous ancestries reported in Lexington city are American (1,324 | 18.0%), Irish (1,315 | 17.9%), German (1,162 | 15.8%), English (799 | 10.9%), and Italian (317 | 4.3%), together accounting for 66.9% of all Lexington city residents.
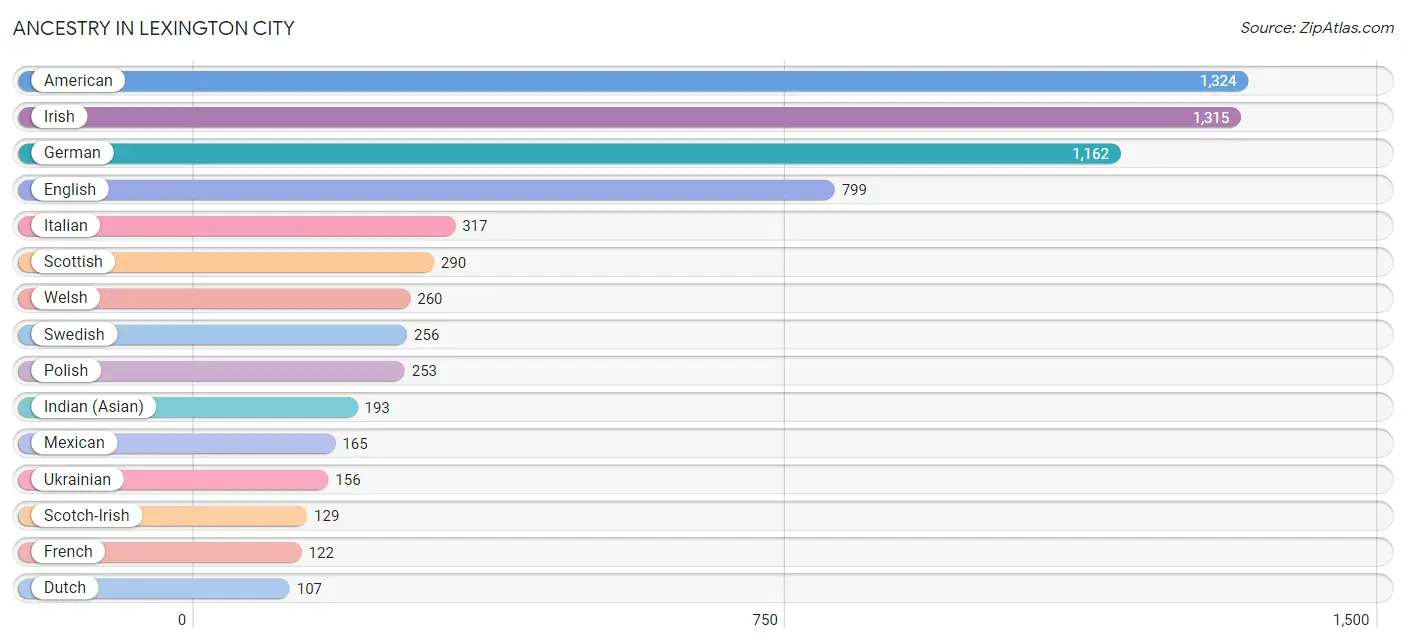
| Ancestry | # Population | % Population |
| American | 1,324 | 18.0% |
| Arab | 2 | 0.0% |
| Australian | 15 | 0.2% |
| Austrian | 5 | 0.1% |
| Bhutanese | 75 | 1.0% |
| British | 106 | 1.4% |
| Burmese | 30 | 0.4% |
| Canadian | 11 | 0.2% |
| Central American | 18 | 0.3% |
| Cherokee | 64 | 0.9% |
| Chinese | 4 | 0.1% |
| Choctaw | 15 | 0.2% |
| Colombian | 25 | 0.3% |
| Croatian | 15 | 0.2% |
| Cuban | 15 | 0.2% |
| Dutch | 107 | 1.5% |
| Eastern European | 4 | 0.1% |
| English | 799 | 10.9% |
| European | 86 | 1.2% |
| Filipino | 16 | 0.2% |
| French | 122 | 1.7% |
| French Canadian | 26 | 0.4% |
| German | 1,162 | 15.8% |
| Greek | 27 | 0.4% |
| Guatemalan | 18 | 0.3% |
| Haitian | 7 | 0.1% |
| Indian (Asian) | 193 | 2.6% |
| Iranian | 35 | 0.5% |
| Irish | 1,315 | 17.9% |
| Italian | 317 | 4.3% |
| Korean | 36 | 0.5% |
| Lithuanian | 4 | 0.1% |
| Mexican | 165 | 2.2% |
| Northern European | 15 | 0.2% |
| Norwegian | 18 | 0.3% |
| Peruvian | 37 | 0.5% |
| Polish | 253 | 3.4% |
| Portuguese | 6 | 0.1% |
| Puerto Rican | 52 | 0.7% |
| Russian | 20 | 0.3% |
| Scotch-Irish | 129 | 1.8% |
| Scottish | 290 | 4.0% |
| South American | 62 | 0.8% |
| South American Indian | 6 | 0.1% |
| Spaniard | 16 | 0.2% |
| Spanish | 15 | 0.2% |
| Subsaharan African | 15 | 0.2% |
| Swedish | 256 | 3.5% |
| Swiss | 15 | 0.2% |
| Syrian | 2 | 0.0% |
| Thai | 21 | 0.3% |
| Ukrainian | 156 | 2.1% |
| Welsh | 260 | 3.5% |
| Zimbabwean | 15 | 0.2% | View All 54 Rows |
Immigrants in Lexington city
The most numerous immigrant groups reported in Lexington city came from Asia (206 | 2.8%), Eastern Asia (186 | 2.5%), Europe (111 | 1.5%), Japan (99 | 1.3%), and China (87 | 1.2%), together accounting for 9.4% of all Lexington city residents.
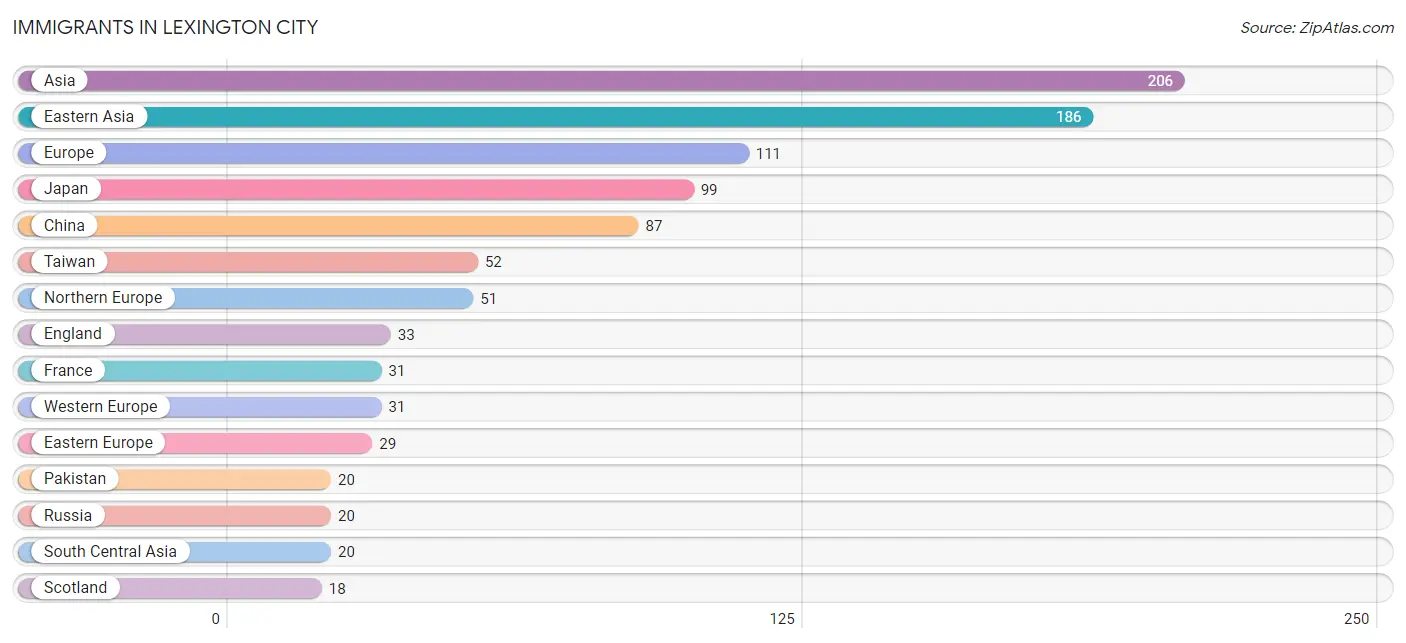
| Immigration Origin | # Population | % Population |
| Asia | 206 | 2.8% |
| Australia | 15 | 0.2% |
| Belarus | 9 | 0.1% |
| China | 87 | 1.2% |
| Eastern Asia | 186 | 2.5% |
| Eastern Europe | 29 | 0.4% |
| England | 33 | 0.4% |
| Europe | 111 | 1.5% |
| France | 31 | 0.4% |
| Japan | 99 | 1.3% |
| Latin America | 6 | 0.1% |
| Northern Europe | 51 | 0.7% |
| Oceania | 15 | 0.2% |
| Pakistan | 20 | 0.3% |
| Peru | 6 | 0.1% |
| Russia | 20 | 0.3% |
| Scotland | 18 | 0.3% |
| South America | 6 | 0.1% |
| South Central Asia | 20 | 0.3% |
| Taiwan | 52 | 0.7% |
| Western Europe | 31 | 0.4% | View All 21 Rows |
Sex and Age in Lexington city
Sex and Age in Lexington city
The most populous age groups in Lexington city are 15 to 19 Years (1,194 | 27.9%) for men and 15 to 19 Years (793 | 25.9%) for women.
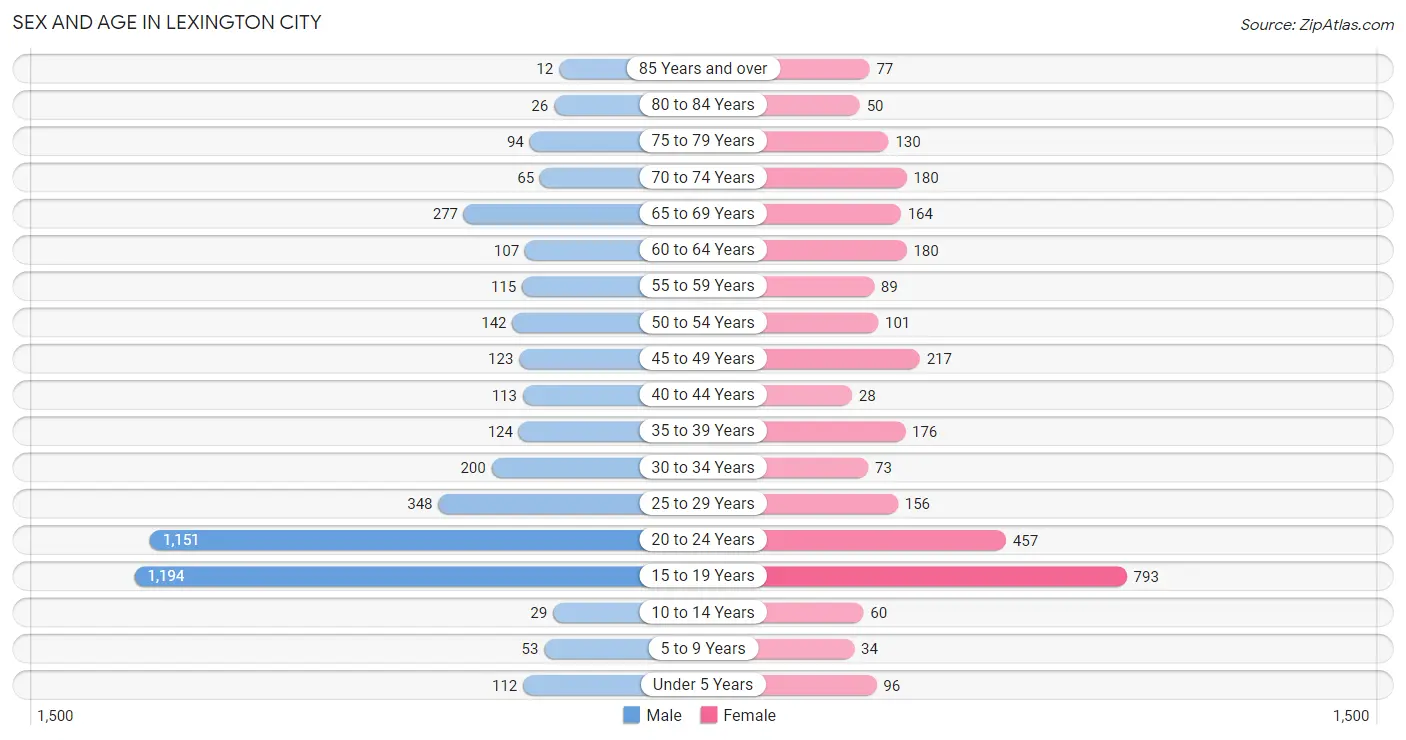
| Age Bracket | Male | Female |
| Under 5 Years | 112 (2.6%) | 96 (3.1%) |
| 5 to 9 Years | 53 (1.2%) | 34 (1.1%) |
| 10 to 14 Years | 29 (0.7%) | 60 (2.0%) |
| 15 to 19 Years | 1,194 (27.9%) | 793 (25.9%) |
| 20 to 24 Years | 1,151 (26.9%) | 457 (14.9%) |
| 25 to 29 Years | 348 (8.1%) | 156 (5.1%) |
| 30 to 34 Years | 200 (4.7%) | 73 (2.4%) |
| 35 to 39 Years | 124 (2.9%) | 176 (5.8%) |
| 40 to 44 Years | 113 (2.6%) | 28 (0.9%) |
| 45 to 49 Years | 123 (2.9%) | 217 (7.1%) |
| 50 to 54 Years | 142 (3.3%) | 101 (3.3%) |
| 55 to 59 Years | 115 (2.7%) | 89 (2.9%) |
| 60 to 64 Years | 107 (2.5%) | 180 (5.9%) |
| 65 to 69 Years | 277 (6.5%) | 164 (5.4%) |
| 70 to 74 Years | 65 (1.5%) | 180 (5.9%) |
| 75 to 79 Years | 94 (2.2%) | 130 (4.3%) |
| 80 to 84 Years | 26 (0.6%) | 50 (1.6%) |
| 85 Years and over | 12 (0.3%) | 77 (2.5%) |
| Total | 4,285 (100.0%) | 3,061 (100.0%) |
Families and Households in Lexington city
Median Family Size in Lexington city
The median family size in Lexington city is 2.78 persons per family, with single male/father families (51 | 5.6%) accounting for the largest median family size of 3.59 persons per family. On the other hand, single female/mother families (88 | 9.7%) represent the smallest median family size with 2.16 persons per family.
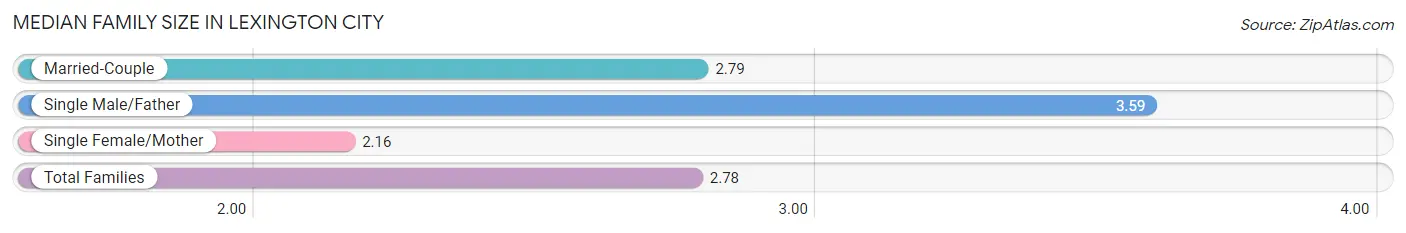
| Family Type | # Families | Family Size |
| Married-Couple | 772 (84.7%) | 2.79 |
| Single Male/Father | 51 (5.6%) | 3.59 |
| Single Female/Mother | 88 (9.7%) | 2.16 |
| Total Families | 911 (100.0%) | 2.78 |
Median Household Size in Lexington city
The median household size in Lexington city is 2.10 persons per household, with single male/father households (51 | 2.6%) accounting for the largest median household size of 3.59 persons per household. non-family households (1,080 | 54.2%) represent the smallest median household size with 1.53 persons per household.

| Household Type | # Households | Household Size |
| Married-Couple | 772 (38.8%) | 2.80 |
| Single Male/Father | 51 (2.6%) | 3.59 |
| Single Female/Mother | 88 (4.4%) | 2.16 |
| Non-family | 1,080 (54.2%) | 1.53 |
| Total Households | 1,991 (100.0%) | 2.10 |
Household Size by Marriage Status in Lexington city
Out of a total of 1,991 households in Lexington city, 911 (45.8%) are family households, while 1,080 (54.2%) are nonfamily households. The most numerous type of family households are 2-person households, comprising 513, and the most common type of nonfamily households are 1-person households, comprising 792.
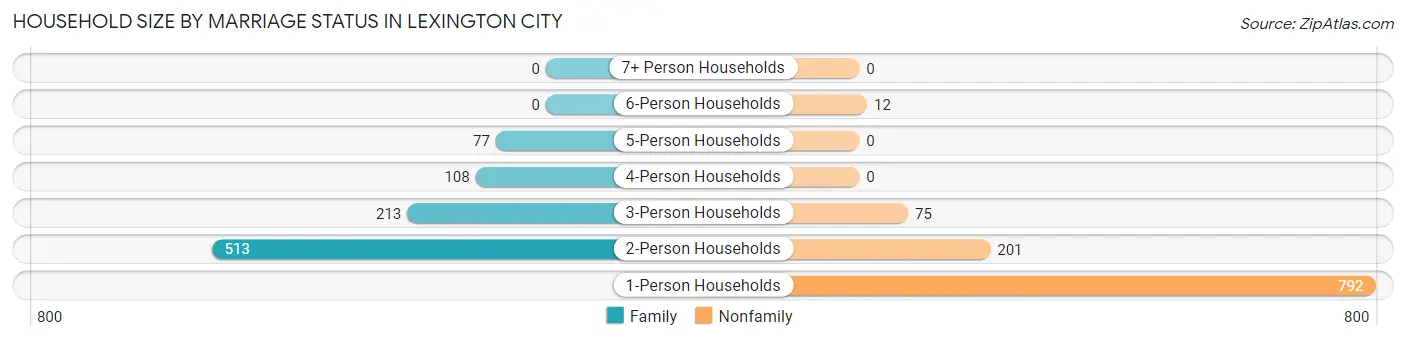
| Household Size | Family Households | Nonfamily Households |
| 1-Person Households | - | 792 (39.8%) |
| 2-Person Households | 513 (25.8%) | 201 (10.1%) |
| 3-Person Households | 213 (10.7%) | 75 (3.8%) |
| 4-Person Households | 108 (5.4%) | 0 (0.0%) |
| 5-Person Households | 77 (3.9%) | 0 (0.0%) |
| 6-Person Households | 0 (0.0%) | 12 (0.6%) |
| 7+ Person Households | 0 (0.0%) | 0 (0.0%) |
| Total | 911 (45.8%) | 1,080 (54.2%) |
Female Fertility in Lexington city
Fertility by Age in Lexington city
Average fertility rate in Lexington city is 45.0 births per 1,000 women. Women in the age bracket of 20 to 34 years have the highest fertility rate with 125.0 births per 1,000 women. Women in the age bracket of 20 to 34 years acount for 100.0% of all women with births.
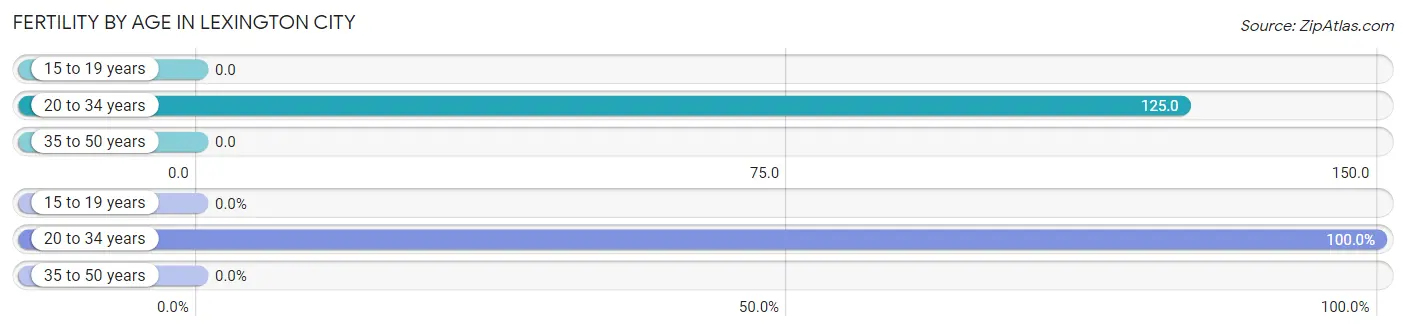
| Age Bracket | Women with Births | Births / 1,000 Women |
| 15 to 19 years | 0 (0.0%) | 0.0 |
| 20 to 34 years | 86 (100.0%) | 125.0 |
| 35 to 50 years | 0 (0.0%) | 0.0 |
| Total | 86 (100.0%) | 45.0 |
Fertility by Age by Marriage Status in Lexington city
55.8% of women with births (86) in Lexington city are married. The highest percentage of unmarried women with births falls into 20 to 34 years age bracket with 44.2% of them unmarried at the time of birth, while the lowest percentage of unmarried women with births belong to 20 to 34 years age bracket with 44.2% of them unmarried.
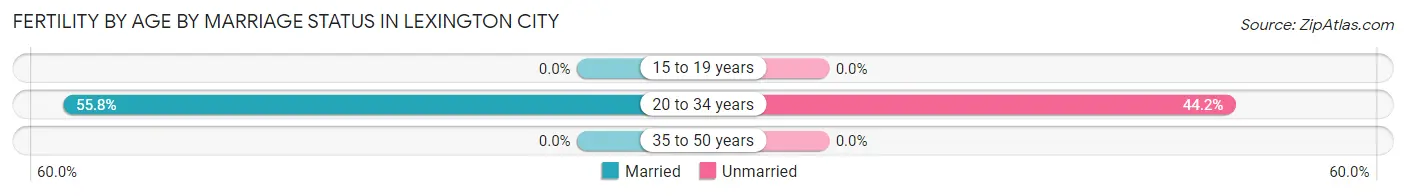
| Age Bracket | Married | Unmarried |
| 15 to 19 years | 0 (0.0%) | 0 (0.0%) |
| 20 to 34 years | 48 (55.8%) | 38 (44.2%) |
| 35 to 50 years | 0 (0.0%) | 0 (0.0%) |
| Total | 48 (55.8%) | 38 (44.2%) |
Fertility by Education in Lexington city
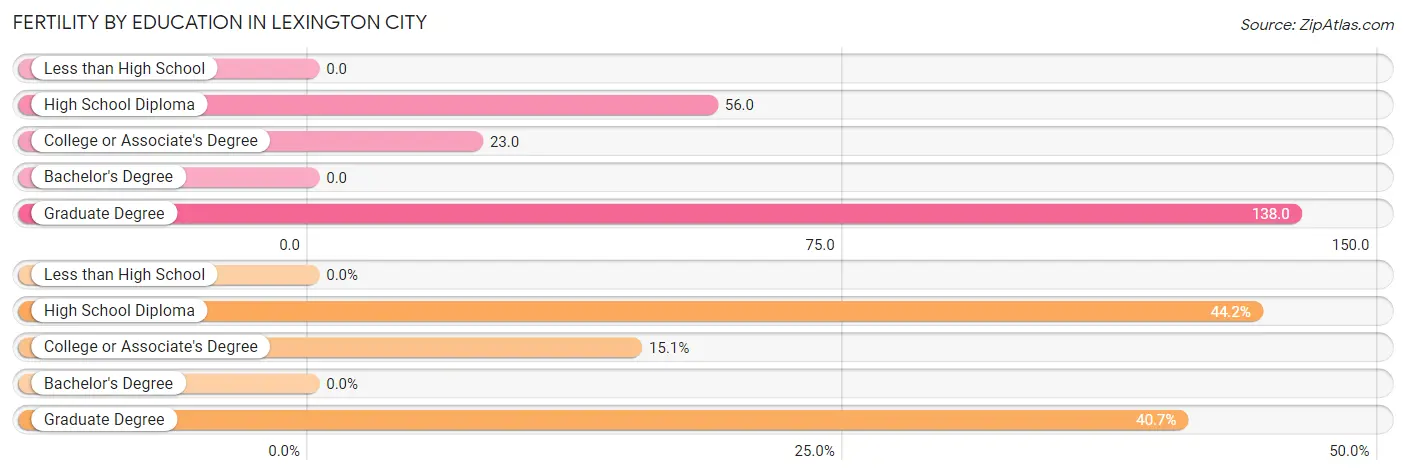
| Educational Attainment | Women with Births | Births / 1,000 Women |
| Less than High School | 0 (0.0%) | 0.0 |
| High School Diploma | 38 (44.2%) | 56.0 |
| College or Associate's Degree | 13 (15.1%) | 23.0 |
| Bachelor's Degree | 0 (0.0%) | 0.0 |
| Graduate Degree | 35 (40.7%) | 138.0 |
| Total | 86 (100.0%) | 45.0 |
Fertility by Education by Marriage Status in Lexington city
44.2% of women with births in Lexington city are unmarried. Women with the educational attainment of college or associate's degree are most likely to be married with 100.0% of them married at childbirth, while women with the educational attainment of high school diploma are least likely to be married with 100.0% of them unmarried at childbirth.
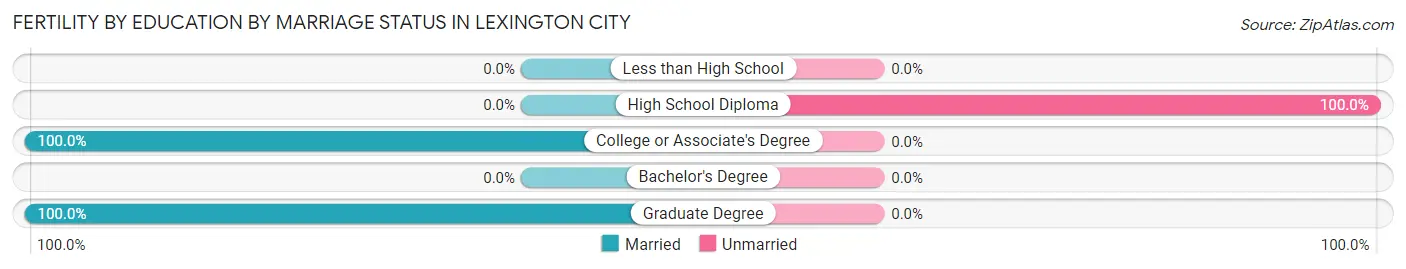
| Educational Attainment | Married | Unmarried |
| Less than High School | 0 (0.0%) | 0 (0.0%) |
| High School Diploma | 0 (0.0%) | 38 (100.0%) |
| College or Associate's Degree | 13 (100.0%) | 0 (0.0%) |
| Bachelor's Degree | 0 (0.0%) | 0 (0.0%) |
| Graduate Degree | 35 (100.0%) | 0 (0.0%) |
| Total | 48 (55.8%) | 38 (44.2%) |
Employment Characteristics in Lexington city
Employment by Class of Employer in Lexington city
Among the 2,721 employed individuals in Lexington city, private company employees (1,259 | 46.3%), not-for-profit organizations (808 | 29.7%), and local government employees (244 | 9.0%) make up the most common classes of employment.
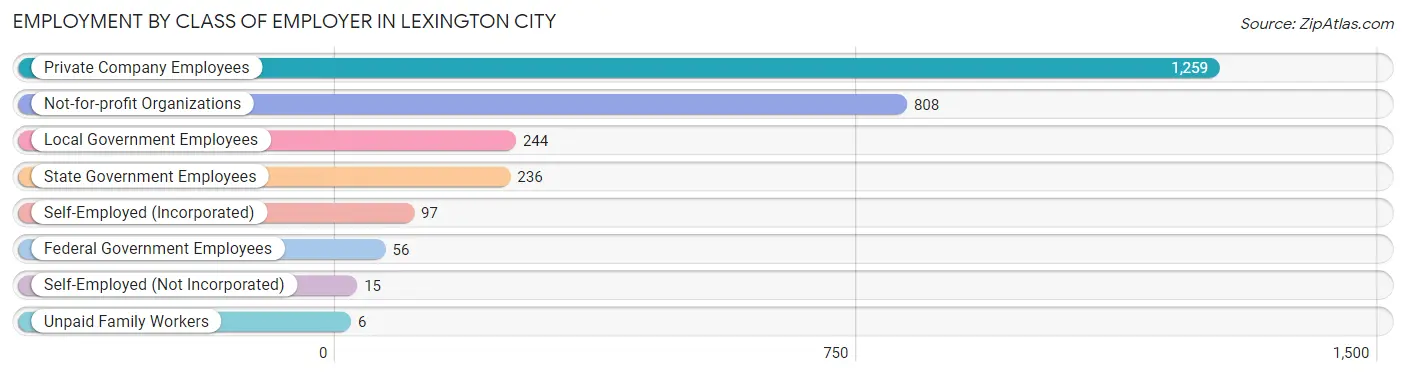
| Employer Class | # Employees | % Employees |
| Private Company Employees | 1,259 | 46.3% |
| Self-Employed (Incorporated) | 97 | 3.6% |
| Self-Employed (Not Incorporated) | 15 | 0.5% |
| Not-for-profit Organizations | 808 | 29.7% |
| Local Government Employees | 244 | 9.0% |
| State Government Employees | 236 | 8.7% |
| Federal Government Employees | 56 | 2.1% |
| Unpaid Family Workers | 6 | 0.2% |
| Total | 2,721 | 100.0% |
Employment Status by Age in Lexington city
According to the labor force statistics for Lexington city, out of the total population over 16 years of age (6,920), 41.8% or 2,893 individuals are in the labor force, with 2.5% or 72 of them unemployed. The age group with the highest labor force participation rate is 35 to 44 years, with 97.1% or 428 individuals in the labor force. Within the labor force, the 45 to 54 years age range has the highest percentage of unemployed individuals, with 12.3% or 65 of them being unemployed.
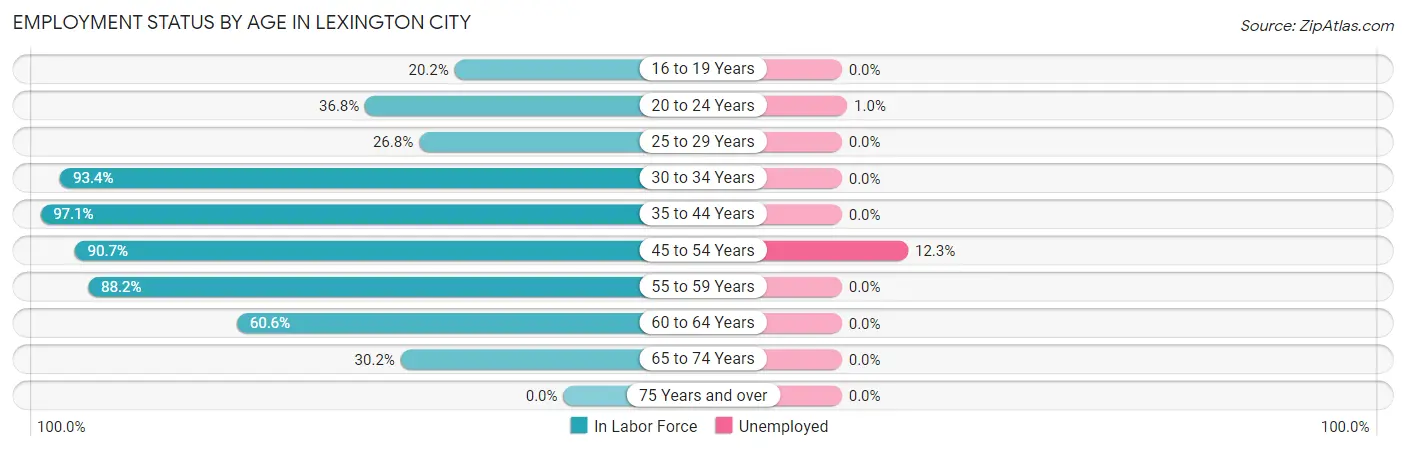
| Age Bracket | In Labor Force | Unemployed |
| 16 to 19 Years | 393 (20.2%) | 0 (0.0%) |
| 20 to 24 Years | 592 (36.8%) | 6 (1.0%) |
| 25 to 29 Years | 135 (26.8%) | 0 (0.0%) |
| 30 to 34 Years | 255 (93.4%) | 0 (0.0%) |
| 35 to 44 Years | 428 (97.1%) | 0 (0.0%) |
| 45 to 54 Years | 529 (90.7%) | 65 (12.3%) |
| 55 to 59 Years | 180 (88.2%) | 0 (0.0%) |
| 60 to 64 Years | 174 (60.6%) | 0 (0.0%) |
| 65 to 74 Years | 207 (30.2%) | 0 (0.0%) |
| 75 Years and over | 0 (0.0%) | 0 (0.0%) |
| Total | 2,893 (41.8%) | 72 (2.5%) |
Employment Status by Educational Attainment in Lexington city
According to labor force statistics for Lexington city, 74.2% of individuals (1,701) out of the total population between 25 and 64 years of age (2,292) are in the labor force, with 3.9% or 66 of them being unemployed. The group with the highest labor force participation rate are those with the educational attainment of less than high school, with 100.0% or 47 individuals in the labor force. Within the labor force, individuals with less than high school education have the highest percentage of unemployment, with 34.0% or 16 of them being unemployed.
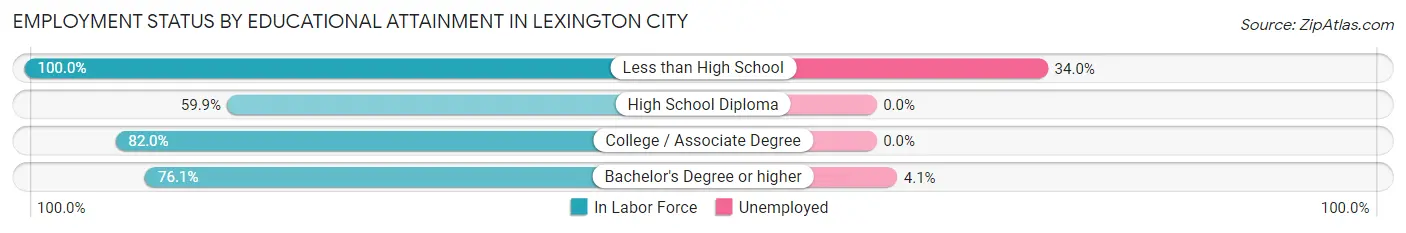
| Educational Attainment | In Labor Force | Unemployed |
| Less than High School | 47 (100.0%) | 16 (34.0%) |
| High School Diploma | 257 (59.9%) | 0 (0.0%) |
| College / Associate Degree | 200 (82.0%) | 0 (0.0%) |
| Bachelor's Degree or higher | 1,196 (76.1%) | 64 (4.1%) |
| Total | 1,701 (74.2%) | 89 (3.9%) |
Employment Occupations by Sex in Lexington city
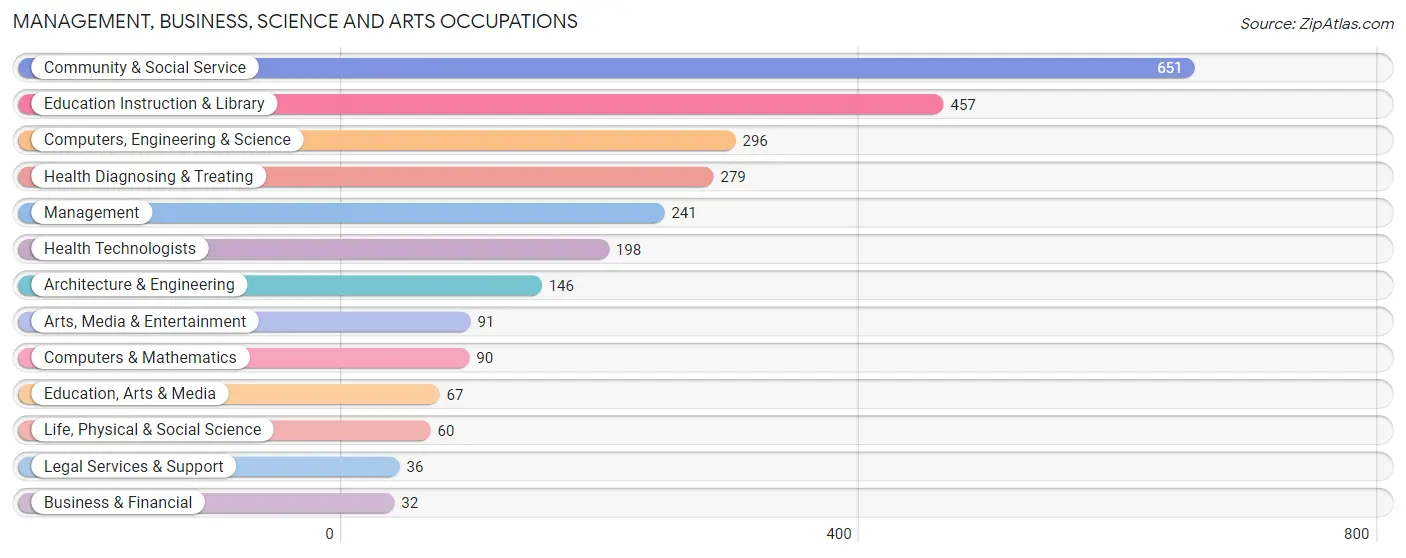
Management, Business, Science and Arts Occupations
The most common Management, Business, Science and Arts occupations in Lexington city are Community & Social Service (651 | 23.2%), Education Instruction & Library (457 | 16.3%), Computers, Engineering & Science (296 | 10.5%), Health Diagnosing & Treating (279 | 9.9%), and Management (241 | 8.6%).
Management, Business, Science and Arts Occupations by Sex
Within the Management, Business, Science and Arts occupations in Lexington city, the most male-oriented occupations are Health Technologists (87.4%), Computers & Mathematics (80.0%), and Arts, Media & Entertainment (74.7%), while the most female-oriented occupations are Business & Financial (100.0%), Education, Arts & Media (100.0%), and Legal Services & Support (100.0%).
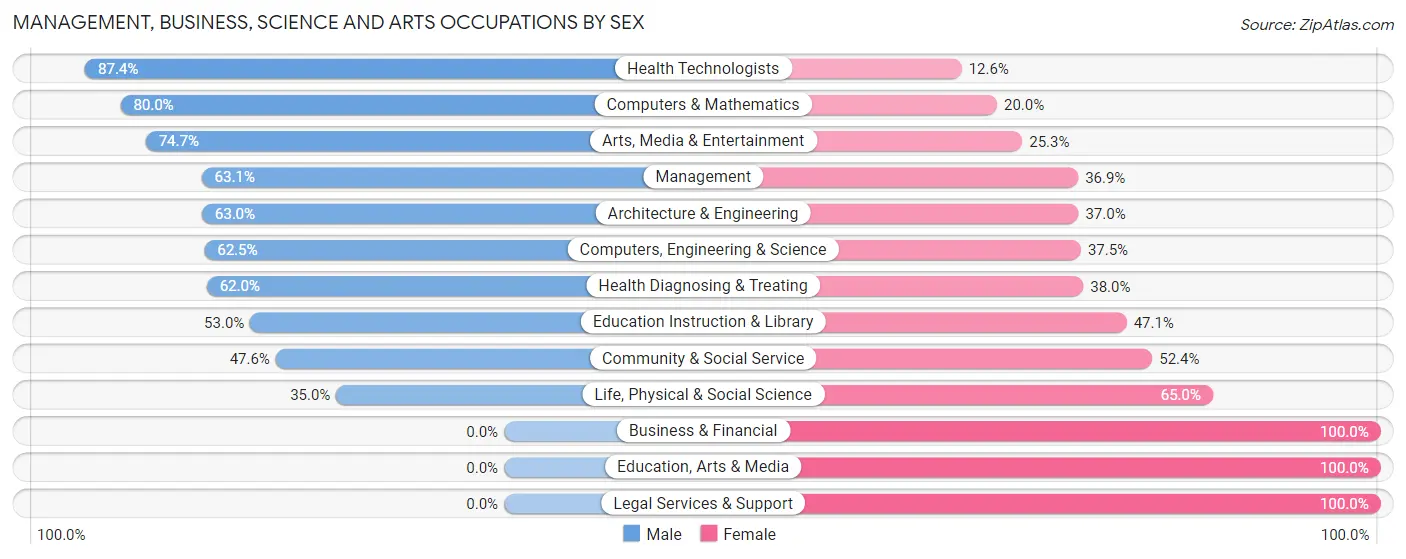
| Occupation | Male | Female |
| Management | 152 (63.1%) | 89 (36.9%) |
| Business & Financial | 0 (0.0%) | 32 (100.0%) |
| Computers, Engineering & Science | 185 (62.5%) | 111 (37.5%) |
| Computers & Mathematics | 72 (80.0%) | 18 (20.0%) |
| Architecture & Engineering | 92 (63.0%) | 54 (37.0%) |
| Life, Physical & Social Science | 21 (35.0%) | 39 (65.0%) |
| Community & Social Service | 310 (47.6%) | 341 (52.4%) |
| Education, Arts & Media | 0 (0.0%) | 67 (100.0%) |
| Legal Services & Support | 0 (0.0%) | 36 (100.0%) |
| Education Instruction & Library | 242 (52.9%) | 215 (47.0%) |
| Arts, Media & Entertainment | 68 (74.7%) | 23 (25.3%) |
| Health Diagnosing & Treating | 173 (62.0%) | 106 (38.0%) |
| Health Technologists | 173 (87.4%) | 25 (12.6%) |
| Total (Category) | 820 (54.7%) | 679 (45.3%) |
| Total (Overall) | 1,382 (49.2%) | 1,426 (50.8%) |
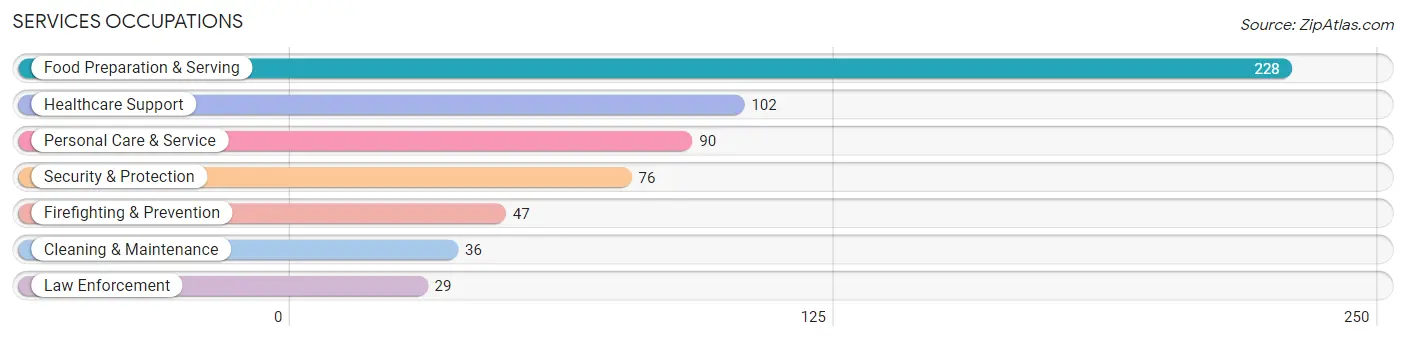
Services Occupations
The most common Services occupations in Lexington city are Food Preparation & Serving (228 | 8.1%), Healthcare Support (102 | 3.6%), Personal Care & Service (90 | 3.2%), Security & Protection (76 | 2.7%), and Firefighting & Prevention (47 | 1.7%).
Services Occupations by Sex
Within the Services occupations in Lexington city, the most male-oriented occupations are Security & Protection (100.0%), Firefighting & Prevention (100.0%), and Law Enforcement (100.0%), while the most female-oriented occupations are Healthcare Support (100.0%), Personal Care & Service (60.0%), and Food Preparation & Serving (52.6%).
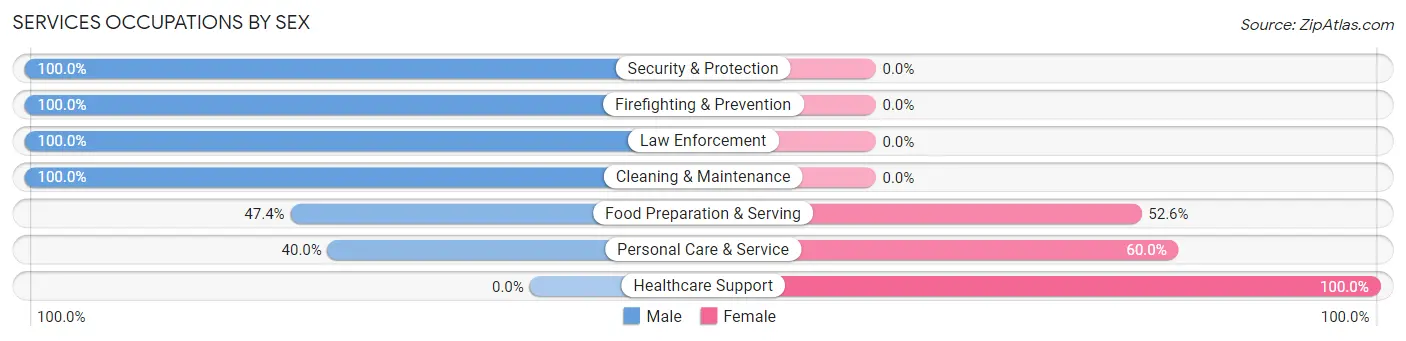
| Occupation | Male | Female |
| Healthcare Support | 0 (0.0%) | 102 (100.0%) |
| Security & Protection | 76 (100.0%) | 0 (0.0%) |
| Firefighting & Prevention | 47 (100.0%) | 0 (0.0%) |
| Law Enforcement | 29 (100.0%) | 0 (0.0%) |
| Food Preparation & Serving | 108 (47.4%) | 120 (52.6%) |
| Cleaning & Maintenance | 36 (100.0%) | 0 (0.0%) |
| Personal Care & Service | 36 (40.0%) | 54 (60.0%) |
| Total (Category) | 256 (48.1%) | 276 (51.9%) |
| Total (Overall) | 1,382 (49.2%) | 1,426 (50.8%) |
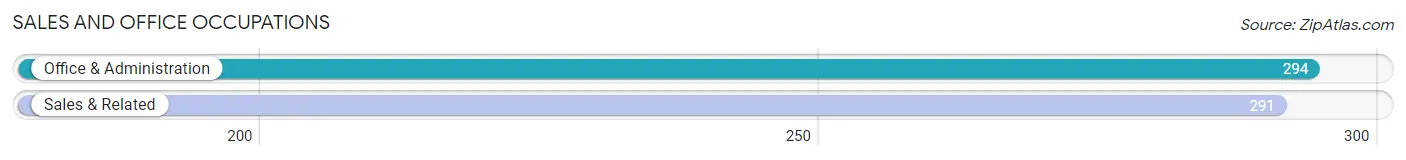
Sales and Office Occupations
The most common Sales and Office occupations in Lexington city are Office & Administration (294 | 10.5%), and Sales & Related (291 | 10.4%).
Sales and Office Occupations by Sex
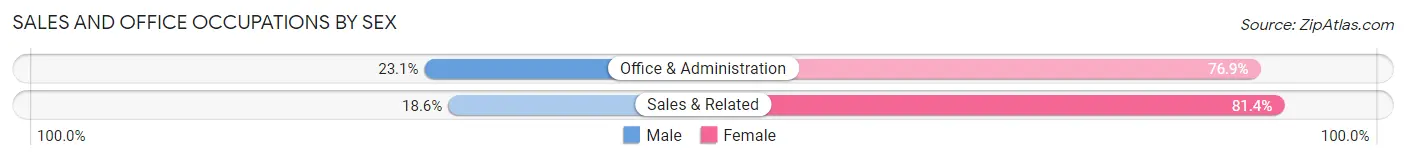
| Occupation | Male | Female |
| Sales & Related | 54 (18.6%) | 237 (81.4%) |
| Office & Administration | 68 (23.1%) | 226 (76.9%) |
| Total (Category) | 122 (20.8%) | 463 (79.1%) |
| Total (Overall) | 1,382 (49.2%) | 1,426 (50.8%) |
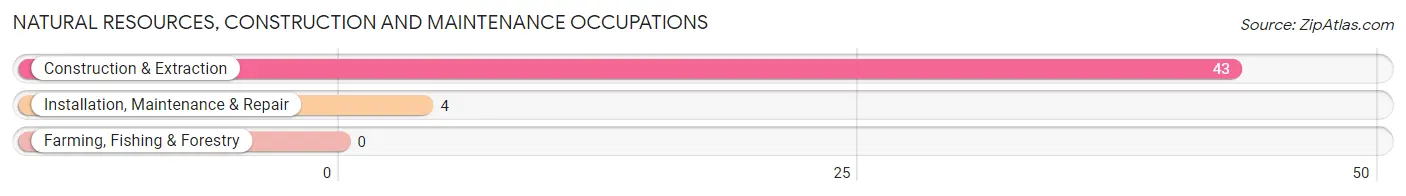
Natural Resources, Construction and Maintenance Occupations
The most common Natural Resources, Construction and Maintenance occupations in Lexington city are Construction & Extraction (43 | 1.5%), and Installation, Maintenance & Repair (4 | 0.1%).
Natural Resources, Construction and Maintenance Occupations by Sex
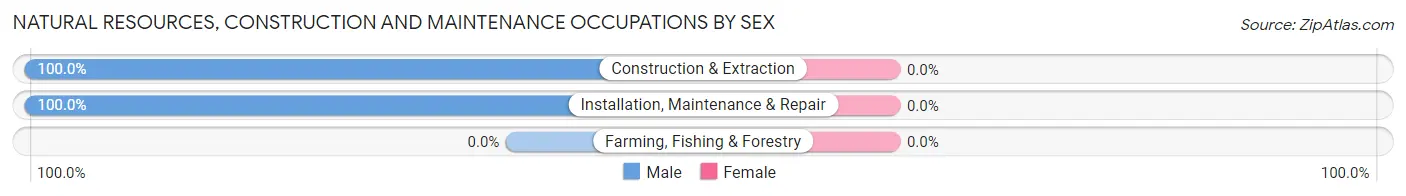
| Occupation | Male | Female |
| Farming, Fishing & Forestry | 0 (0.0%) | 0 (0.0%) |
| Construction & Extraction | 43 (100.0%) | 0 (0.0%) |
| Installation, Maintenance & Repair | 4 (100.0%) | 0 (0.0%) |
| Total (Category) | 47 (100.0%) | 0 (0.0%) |
| Total (Overall) | 1,382 (49.2%) | 1,426 (50.8%) |
Production, Transportation and Moving Occupations
The most common Production, Transportation and Moving occupations in Lexington city are Transportation (67 | 2.4%), Production (41 | 1.5%), and Material Moving (37 | 1.3%).
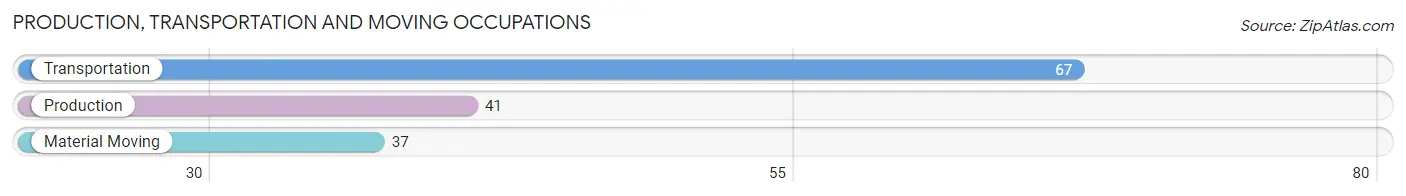
Production, Transportation and Moving Occupations by Sex
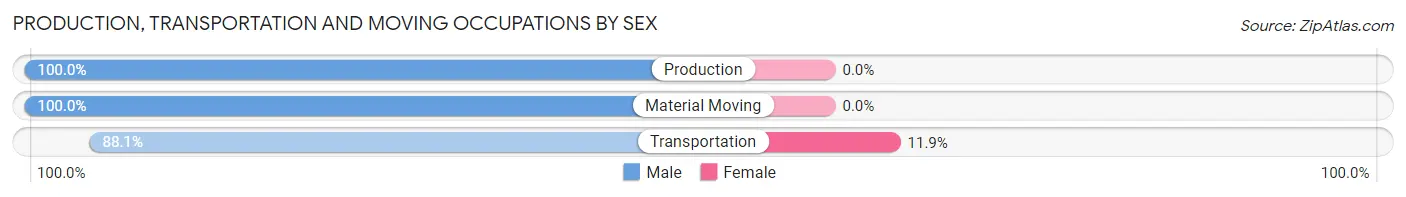
| Occupation | Male | Female |
| Production | 41 (100.0%) | 0 (0.0%) |
| Transportation | 59 (88.1%) | 8 (11.9%) |
| Material Moving | 37 (100.0%) | 0 (0.0%) |
| Total (Category) | 137 (94.5%) | 8 (5.5%) |
| Total (Overall) | 1,382 (49.2%) | 1,426 (50.8%) |
Employment Industries by Sex in Lexington city
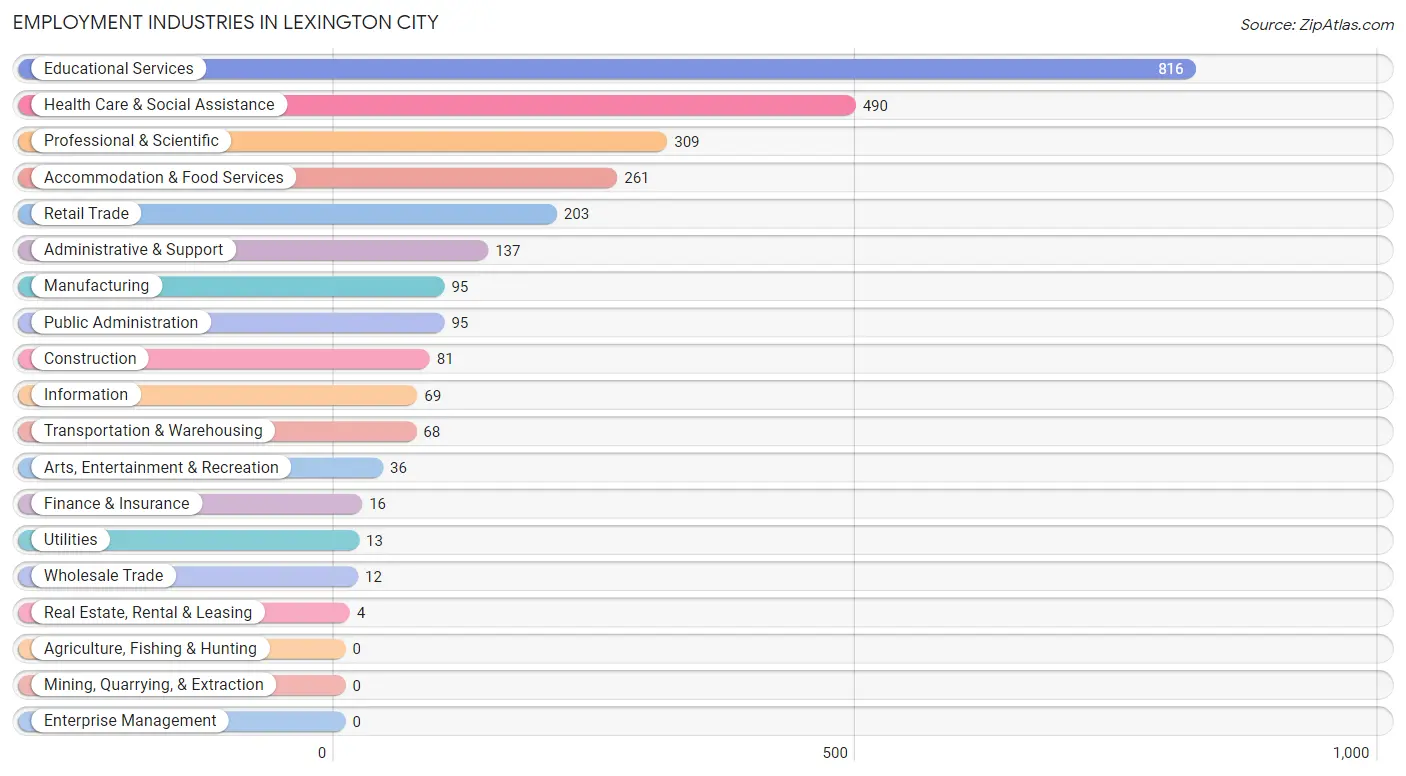
Employment Industries in Lexington city
The major employment industries in Lexington city include Educational Services (816 | 29.1%), Health Care & Social Assistance (490 | 17.4%), Professional & Scientific (309 | 11.0%), Accommodation & Food Services (261 | 9.3%), and Retail Trade (203 | 7.2%).
Employment Industries by Sex in Lexington city
The Lexington city industries that see more men than women are Construction (100.0%), Wholesale Trade (100.0%), and Utilities (100.0%), whereas the industries that tend to have a higher number of women are Administrative & Support (83.2%), Information (73.9%), and Retail Trade (64.5%).
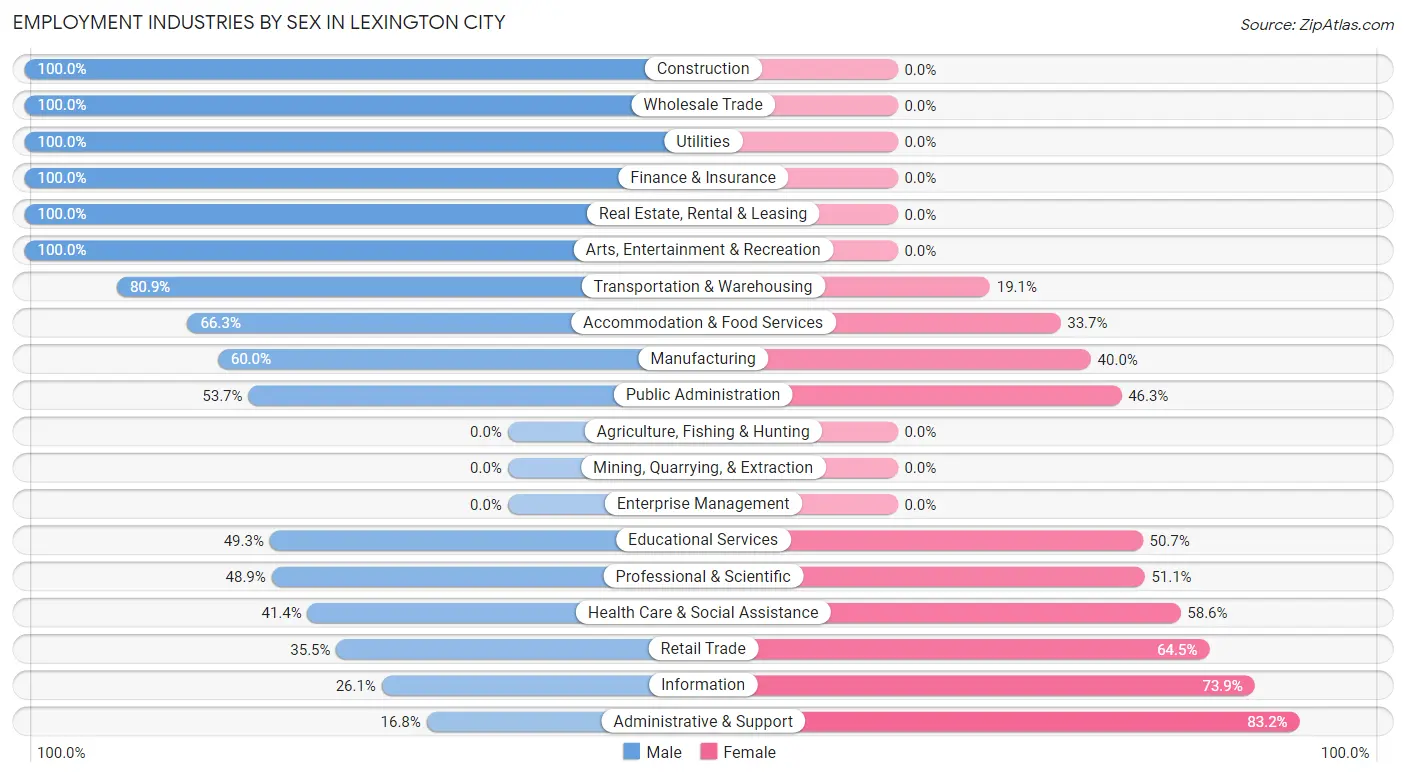
| Industry | Male | Female |
| Agriculture, Fishing & Hunting | 0 (0.0%) | 0 (0.0%) |
| Mining, Quarrying, & Extraction | 0 (0.0%) | 0 (0.0%) |
| Construction | 81 (100.0%) | 0 (0.0%) |
| Manufacturing | 57 (60.0%) | 38 (40.0%) |
| Wholesale Trade | 12 (100.0%) | 0 (0.0%) |
| Retail Trade | 72 (35.5%) | 131 (64.5%) |
| Transportation & Warehousing | 55 (80.9%) | 13 (19.1%) |
| Utilities | 13 (100.0%) | 0 (0.0%) |
| Information | 18 (26.1%) | 51 (73.9%) |
| Finance & Insurance | 16 (100.0%) | 0 (0.0%) |
| Real Estate, Rental & Leasing | 4 (100.0%) | 0 (0.0%) |
| Professional & Scientific | 151 (48.9%) | 158 (51.1%) |
| Enterprise Management | 0 (0.0%) | 0 (0.0%) |
| Administrative & Support | 23 (16.8%) | 114 (83.2%) |
| Educational Services | 402 (49.3%) | 414 (50.7%) |
| Health Care & Social Assistance | 203 (41.4%) | 287 (58.6%) |
| Arts, Entertainment & Recreation | 36 (100.0%) | 0 (0.0%) |
| Accommodation & Food Services | 173 (66.3%) | 88 (33.7%) |
| Public Administration | 51 (53.7%) | 44 (46.3%) |
| Total | 1,382 (49.2%) | 1,426 (50.8%) |
Education in Lexington city
School Enrollment in Lexington city
The most common levels of schooling among the 4,037 students in Lexington city are college / undergraduate (3,235 | 80.1%), graduate / professional (450 | 11.2%), and high school (160 | 4.0%).
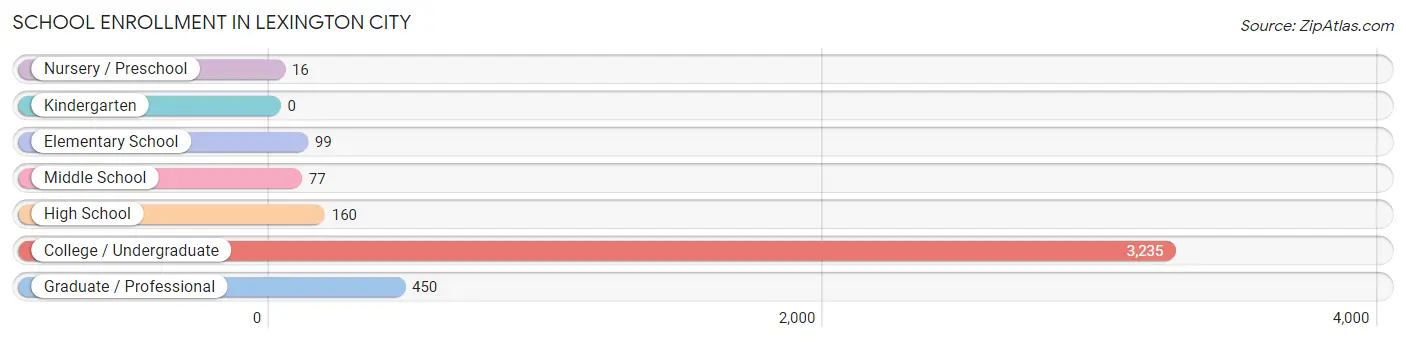
| School Level | # Students | % Students |
| Nursery / Preschool | 16 | 0.4% |
| Kindergarten | 0 | 0.0% |
| Elementary School | 99 | 2.5% |
| Middle School | 77 | 1.9% |
| High School | 160 | 4.0% |
| College / Undergraduate | 3,235 | 80.1% |
| Graduate / Professional | 450 | 11.2% |
| Total | 4,037 | 100.0% |
School Enrollment by Age by Funding Source in Lexington city
Out of a total of 4,037 students who are enrolled in schools in Lexington city, 1,312 (32.5%) attend a private institution, while the remaining 2,725 (67.5%) are enrolled in public schools. The age group of 3 to 4 year olds has the highest likelihood of being enrolled in private schools, with 16 (100.0% in the age bracket) enrolled. Conversely, the age group of 5 to 9 year old has the lowest likelihood of being enrolled in a private school, with 87 (100.0% in the age bracket) attending a public institution.
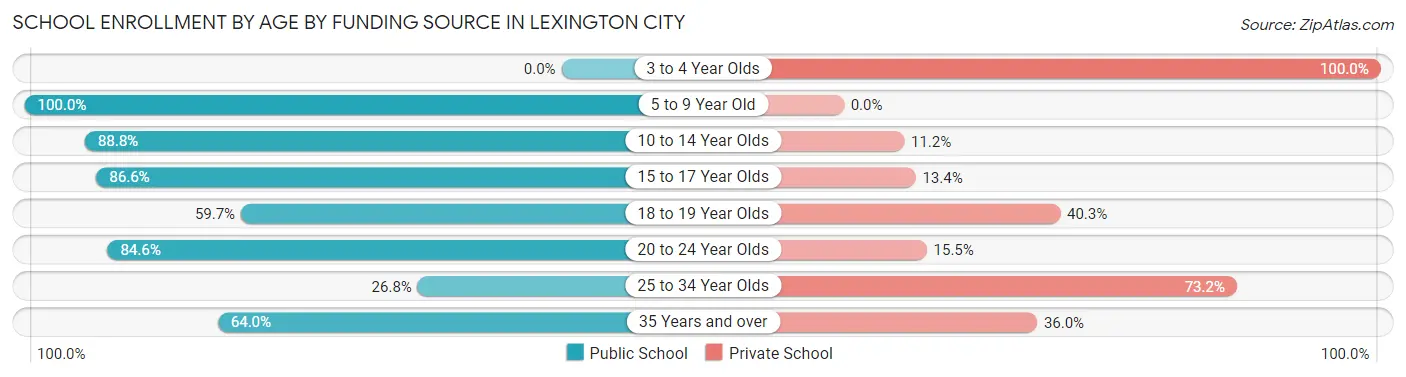
| Age Bracket | Public School | Private School |
| 3 to 4 Year Olds | 0 (0.0%) | 16 (100.0%) |
| 5 to 9 Year Old | 87 (100.0%) | 0 (0.0%) |
| 10 to 14 Year Olds | 79 (88.8%) | 10 (11.2%) |
| 15 to 17 Year Olds | 123 (86.6%) | 19 (13.4%) |
| 18 to 19 Year Olds | 1,077 (59.7%) | 727 (40.3%) |
| 20 to 24 Year Olds | 1,231 (84.6%) | 225 (15.4%) |
| 25 to 34 Year Olds | 112 (26.8%) | 306 (73.2%) |
| 35 Years and over | 16 (64.0%) | 9 (36.0%) |
| Total | 2,725 (67.5%) | 1,312 (32.5%) |
Educational Attainment by Field of Study in Lexington city
Social sciences (451 | 19.5%), liberal arts & history (405 | 17.5%), literature & languages (240 | 10.4%), science & technology (222 | 9.6%), and business (214 | 9.2%) are the most common fields of study among 2,316 individuals in Lexington city who have obtained a bachelor's degree or higher.
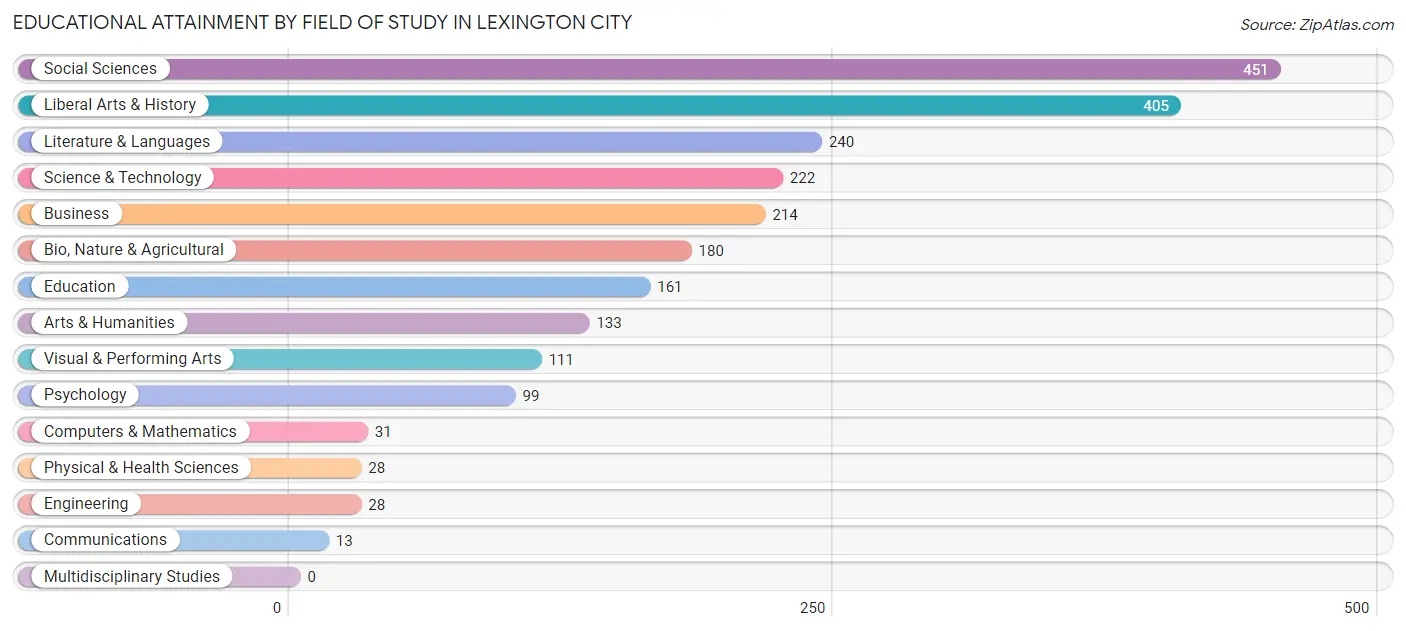
| Field of Study | # Graduates | % Graduates |
| Computers & Mathematics | 31 | 1.3% |
| Bio, Nature & Agricultural | 180 | 7.8% |
| Physical & Health Sciences | 28 | 1.2% |
| Psychology | 99 | 4.3% |
| Social Sciences | 451 | 19.5% |
| Engineering | 28 | 1.2% |
| Multidisciplinary Studies | 0 | 0.0% |
| Science & Technology | 222 | 9.6% |
| Business | 214 | 9.2% |
| Education | 161 | 7.0% |
| Literature & Languages | 240 | 10.4% |
| Liberal Arts & History | 405 | 17.5% |
| Visual & Performing Arts | 111 | 4.8% |
| Communications | 13 | 0.6% |
| Arts & Humanities | 133 | 5.7% |
| Total | 2,316 | 100.0% |
Transportation & Commute in Lexington city
Vehicle Availability by Sex in Lexington city
The most prevalent vehicle ownership categories in Lexington city are males with 3 vehicles (413, accounting for 40.2%) and females with 3 vehicles (193, making up 42.1%).
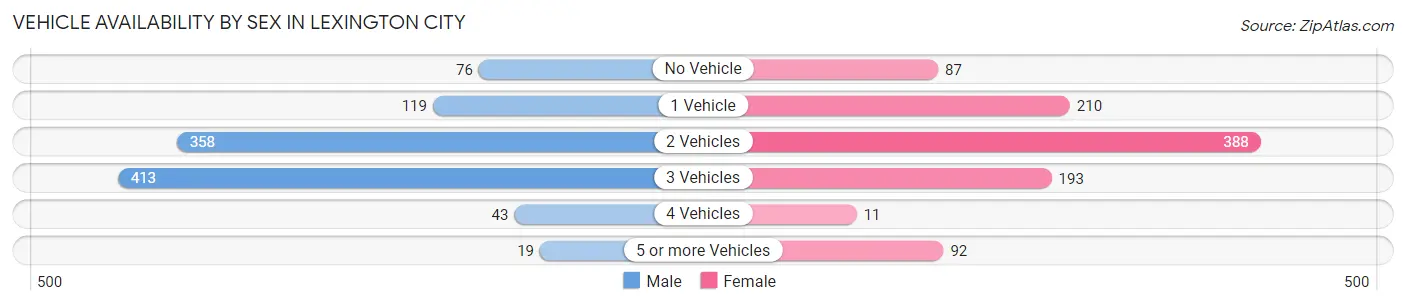
| Vehicles Available | Male | Female |
| No Vehicle | 76 (7.4%) | 87 (8.9%) |
| 1 Vehicle | 119 (11.6%) | 210 (21.4%) |
| 2 Vehicles | 358 (34.8%) | 388 (39.6%) |
| 3 Vehicles | 413 (40.2%) | 193 (19.7%) |
| 4 Vehicles | 43 (4.2%) | 11 (1.1%) |
| 5 or more Vehicles | 19 (1.8%) | 92 (9.4%) |
| Total | 1,028 (100.0%) | 981 (100.0%) |
Commute Time in Lexington city
The most frequently occuring commute durations in Lexington city are 5 to 9 minutes (944 commuters, 39.9%), 10 to 14 minutes (403 commuters, 17.0%), and less than 5 minutes (337 commuters, 14.2%).
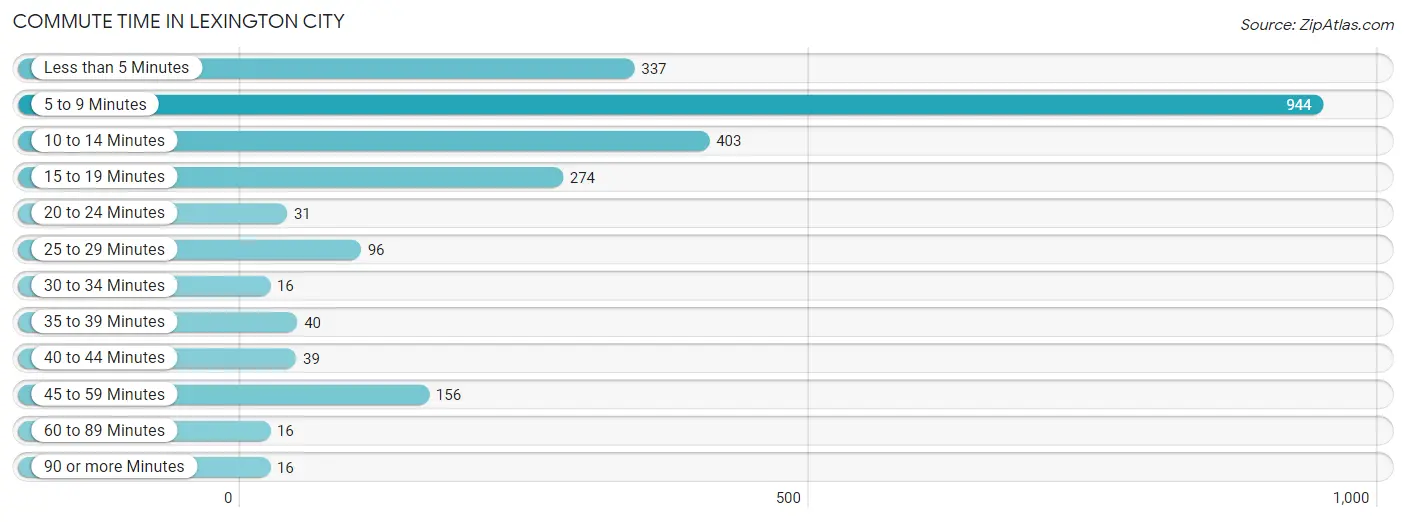
| Commute Time | # Commuters | % Commuters |
| Less than 5 Minutes | 337 | 14.2% |
| 5 to 9 Minutes | 944 | 39.9% |
| 10 to 14 Minutes | 403 | 17.0% |
| 15 to 19 Minutes | 274 | 11.6% |
| 20 to 24 Minutes | 31 | 1.3% |
| 25 to 29 Minutes | 96 | 4.1% |
| 30 to 34 Minutes | 16 | 0.7% |
| 35 to 39 Minutes | 40 | 1.7% |
| 40 to 44 Minutes | 39 | 1.7% |
| 45 to 59 Minutes | 156 | 6.6% |
| 60 to 89 Minutes | 16 | 0.7% |
| 90 or more Minutes | 16 | 0.7% |
Commute Time by Sex in Lexington city
The most common commute times in Lexington city are 5 to 9 minutes (452 commuters, 36.4%) for males and 5 to 9 minutes (492 commuters, 43.6%) for females.
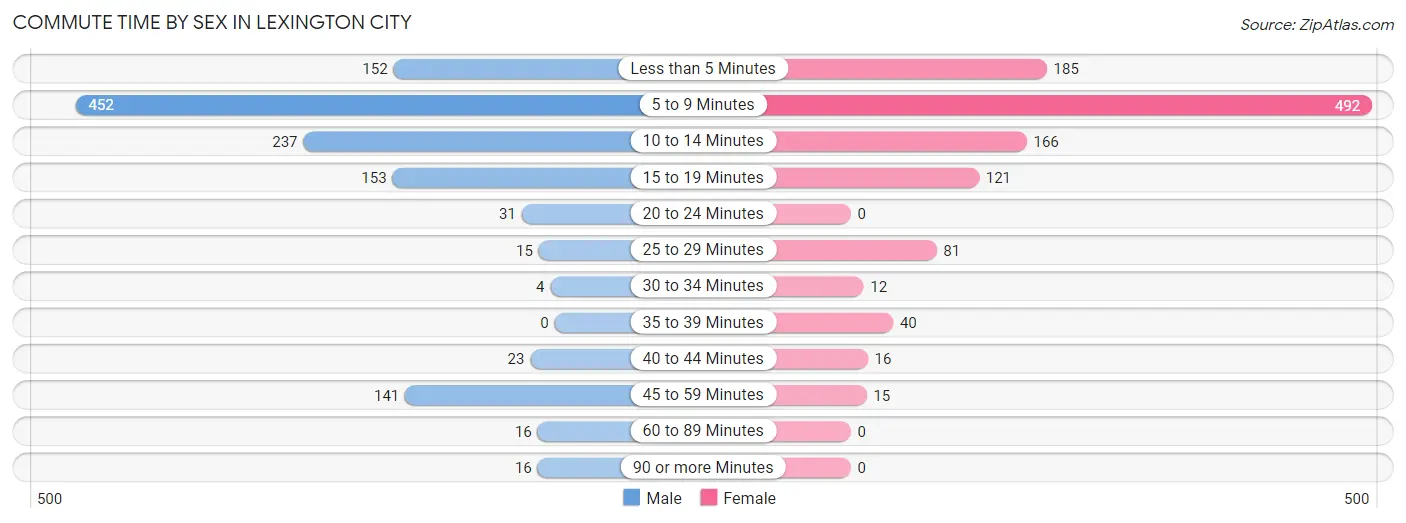
| Commute Time | Male | Female |
| Less than 5 Minutes | 152 (12.3%) | 185 (16.4%) |
| 5 to 9 Minutes | 452 (36.4%) | 492 (43.6%) |
| 10 to 14 Minutes | 237 (19.1%) | 166 (14.7%) |
| 15 to 19 Minutes | 153 (12.3%) | 121 (10.7%) |
| 20 to 24 Minutes | 31 (2.5%) | 0 (0.0%) |
| 25 to 29 Minutes | 15 (1.2%) | 81 (7.2%) |
| 30 to 34 Minutes | 4 (0.3%) | 12 (1.1%) |
| 35 to 39 Minutes | 0 (0.0%) | 40 (3.5%) |
| 40 to 44 Minutes | 23 (1.8%) | 16 (1.4%) |
| 45 to 59 Minutes | 141 (11.4%) | 15 (1.3%) |
| 60 to 89 Minutes | 16 (1.3%) | 0 (0.0%) |
| 90 or more Minutes | 16 (1.3%) | 0 (0.0%) |
Time of Departure to Work by Sex in Lexington city
The most frequent times of departure to work in Lexington city are 8:00 AM to 8:29 AM (342, 27.6%) for males and 7:30 AM to 7:59 AM (255, 22.6%) for females.
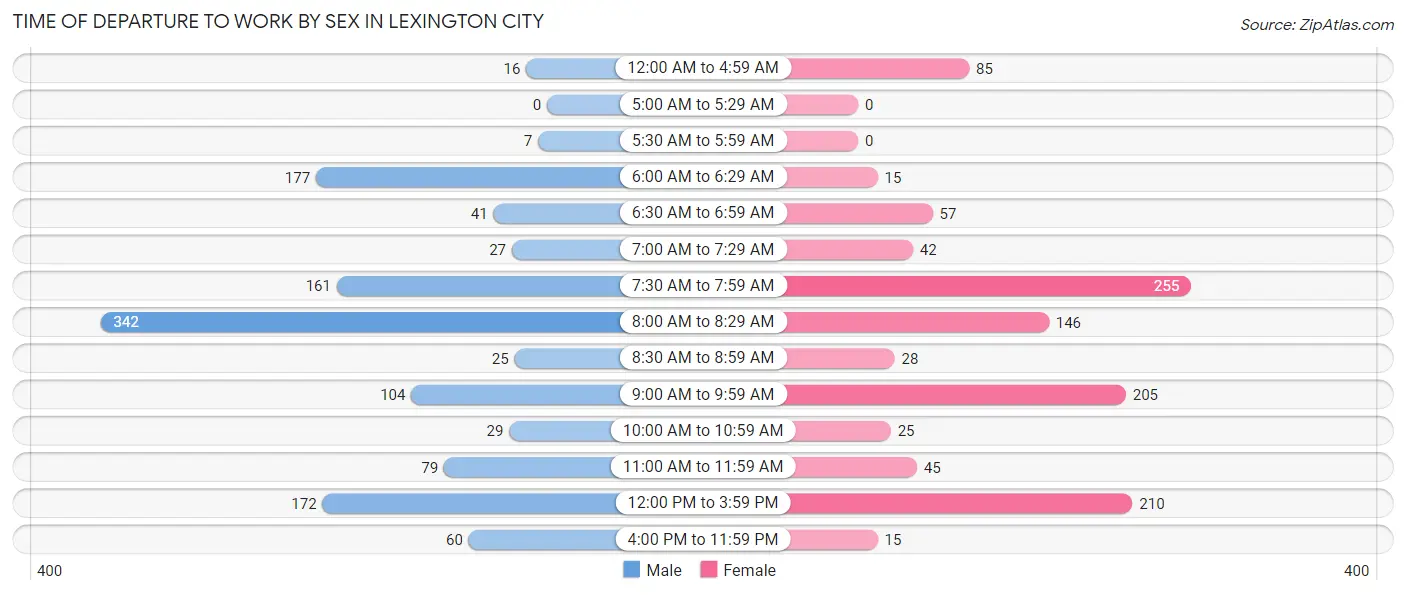
| Time of Departure | Male | Female |
| 12:00 AM to 4:59 AM | 16 (1.3%) | 85 (7.5%) |
| 5:00 AM to 5:29 AM | 0 (0.0%) | 0 (0.0%) |
| 5:30 AM to 5:59 AM | 7 (0.6%) | 0 (0.0%) |
| 6:00 AM to 6:29 AM | 177 (14.3%) | 15 (1.3%) |
| 6:30 AM to 6:59 AM | 41 (3.3%) | 57 (5.1%) |
| 7:00 AM to 7:29 AM | 27 (2.2%) | 42 (3.7%) |
| 7:30 AM to 7:59 AM | 161 (13.0%) | 255 (22.6%) |
| 8:00 AM to 8:29 AM | 342 (27.6%) | 146 (12.9%) |
| 8:30 AM to 8:59 AM | 25 (2.0%) | 28 (2.5%) |
| 9:00 AM to 9:59 AM | 104 (8.4%) | 205 (18.2%) |
| 10:00 AM to 10:59 AM | 29 (2.3%) | 25 (2.2%) |
| 11:00 AM to 11:59 AM | 79 (6.4%) | 45 (4.0%) |
| 12:00 PM to 3:59 PM | 172 (13.9%) | 210 (18.6%) |
| 4:00 PM to 11:59 PM | 60 (4.8%) | 15 (1.3%) |
| Total | 1,240 (100.0%) | 1,128 (100.0%) |
Housing Occupancy in Lexington city
Occupancy by Ownership in Lexington city
Of the total 1,991 dwellings in Lexington city, owner-occupied units account for 1,051 (52.8%), while renter-occupied units make up 940 (47.2%).
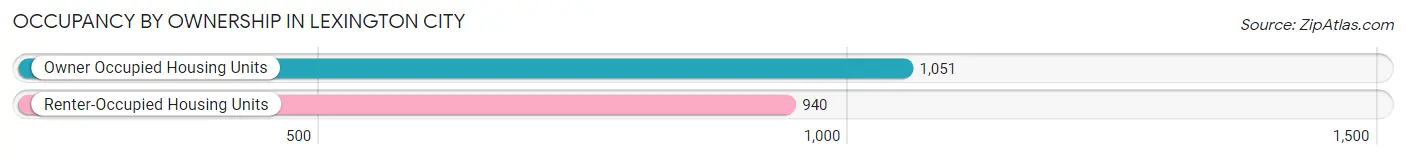
| Occupancy | # Housing Units | % Housing Units |
| Owner Occupied Housing Units | 1,051 | 52.8% |
| Renter-Occupied Housing Units | 940 | 47.2% |
| Total Occupied Housing Units | 1,991 | 100.0% |
Occupancy by Household Size in Lexington city
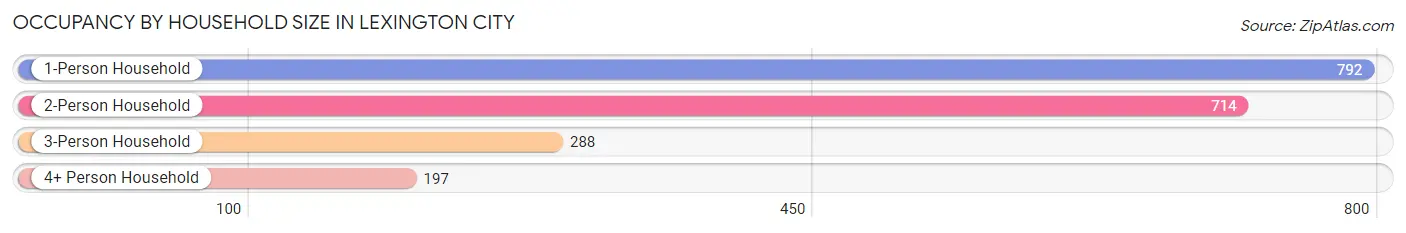
| Household Size | # Housing Units | % Housing Units |
| 1-Person Household | 792 | 39.8% |
| 2-Person Household | 714 | 35.9% |
| 3-Person Household | 288 | 14.5% |
| 4+ Person Household | 197 | 9.9% |
| Total Housing Units | 1,991 | 100.0% |
Occupancy by Ownership by Household Size in Lexington city
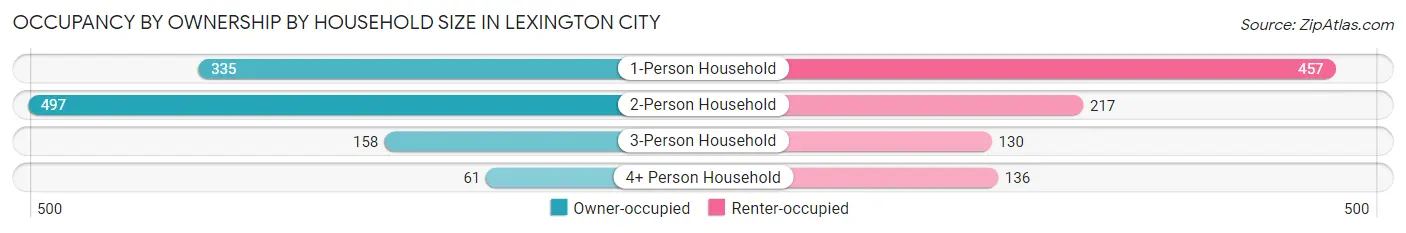
| Household Size | Owner-occupied | Renter-occupied |
| 1-Person Household | 335 (42.3%) | 457 (57.7%) |
| 2-Person Household | 497 (69.6%) | 217 (30.4%) |
| 3-Person Household | 158 (54.9%) | 130 (45.1%) |
| 4+ Person Household | 61 (31.0%) | 136 (69.0%) |
| Total Housing Units | 1,051 (52.8%) | 940 (47.2%) |
Occupancy by Educational Attainment in Lexington city
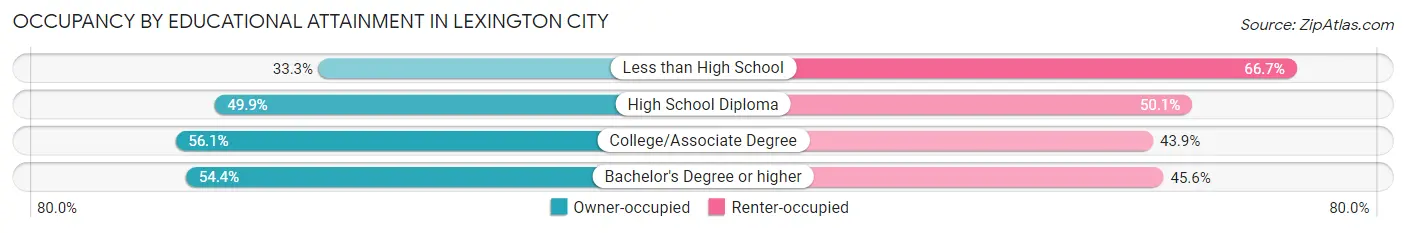
| Household Size | Owner-occupied | Renter-occupied |
| Less than High School | 28 (33.3%) | 56 (66.7%) |
| High School Diploma | 220 (49.9%) | 221 (50.1%) |
| College/Associate Degree | 175 (56.1%) | 137 (43.9%) |
| Bachelor's Degree or higher | 628 (54.4%) | 526 (45.6%) |
Occupancy by Age of Householder in Lexington city
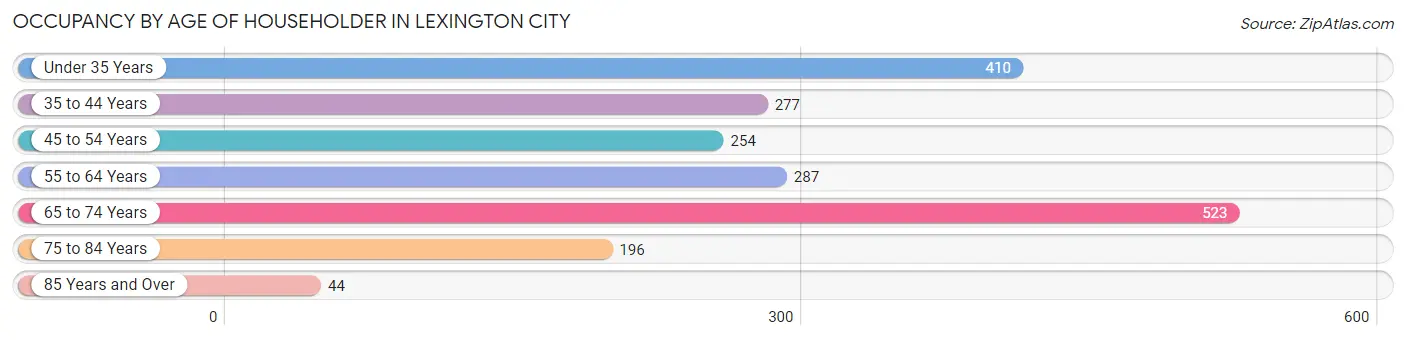
| Age Bracket | # Households | % Households |
| Under 35 Years | 410 | 20.6% |
| 35 to 44 Years | 277 | 13.9% |
| 45 to 54 Years | 254 | 12.8% |
| 55 to 64 Years | 287 | 14.4% |
| 65 to 74 Years | 523 | 26.3% |
| 75 to 84 Years | 196 | 9.8% |
| 85 Years and Over | 44 | 2.2% |
| Total | 1,991 | 100.0% |
Housing Finances in Lexington city
Median Income by Occupancy in Lexington city
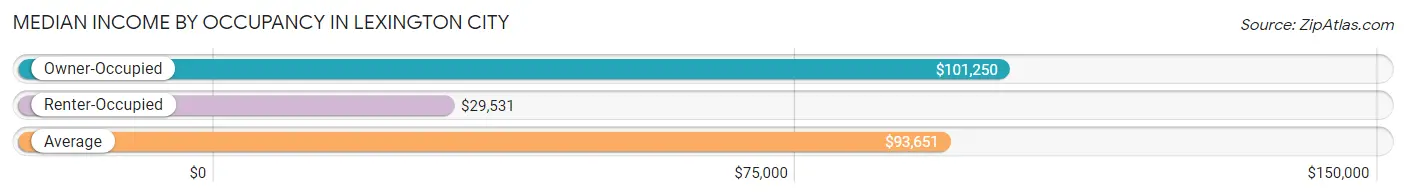
| Occupancy Type | # Households | Median Income |
| Owner-Occupied | 1,051 (52.8%) | $101,250 |
| Renter-Occupied | 940 (47.2%) | $29,531 |
| Average | 1,991 (100.0%) | $93,651 |
Occupancy by Householder Income Bracket in Lexington city
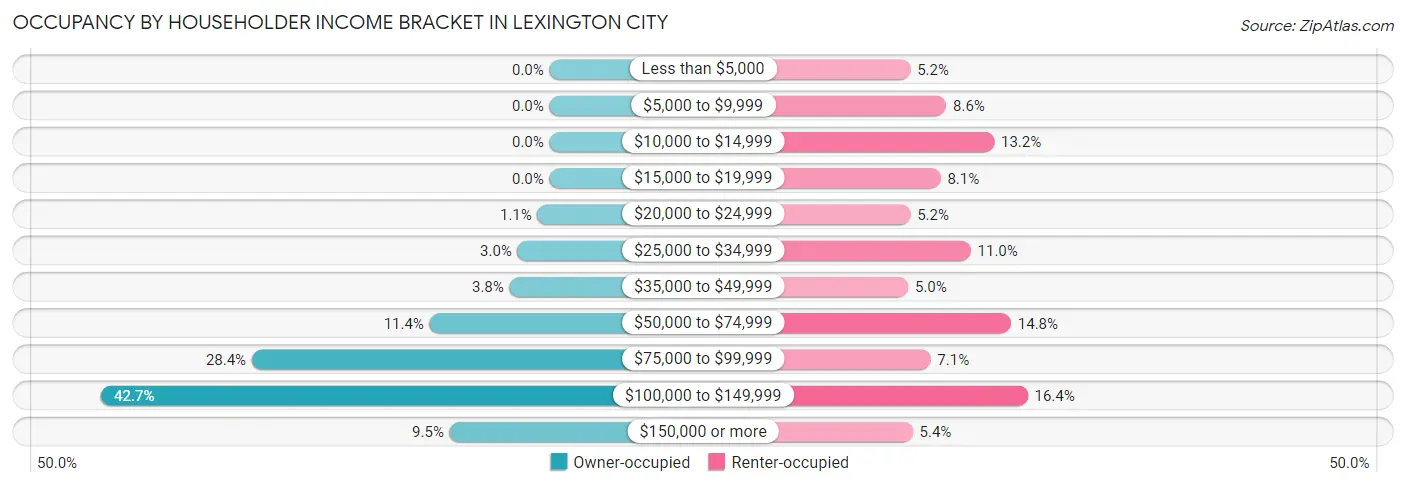
| Income Bracket | Owner-occupied | Renter-occupied |
| Less than $5,000 | 0 (0.0%) | 49 (5.2%) |
| $5,000 to $9,999 | 0 (0.0%) | 81 (8.6%) |
| $10,000 to $14,999 | 0 (0.0%) | 124 (13.2%) |
| $15,000 to $19,999 | 0 (0.0%) | 76 (8.1%) |
| $20,000 to $24,999 | 12 (1.1%) | 49 (5.2%) |
| $25,000 to $34,999 | 32 (3.0%) | 103 (11.0%) |
| $35,000 to $49,999 | 40 (3.8%) | 47 (5.0%) |
| $50,000 to $74,999 | 120 (11.4%) | 139 (14.8%) |
| $75,000 to $99,999 | 298 (28.3%) | 67 (7.1%) |
| $100,000 to $149,999 | 449 (42.7%) | 154 (16.4%) |
| $150,000 or more | 100 (9.5%) | 51 (5.4%) |
| Total | 1,051 (100.0%) | 940 (100.0%) |
Monthly Housing Cost Tiers in Lexington city
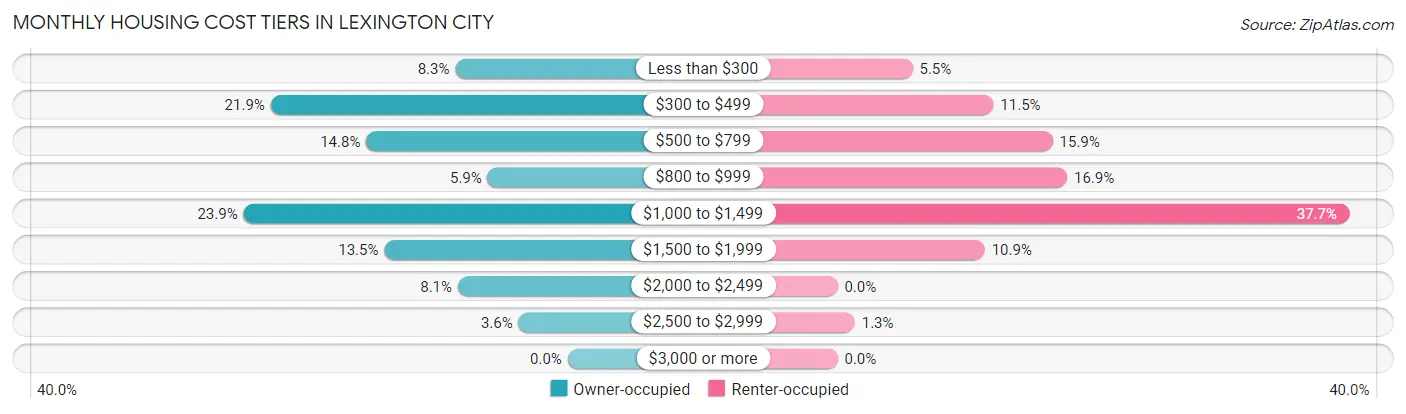
| Monthly Cost | Owner-occupied | Renter-occupied |
| Less than $300 | 87 (8.3%) | 52 (5.5%) |
| $300 to $499 | 230 (21.9%) | 108 (11.5%) |
| $500 to $799 | 156 (14.8%) | 149 (15.9%) |
| $800 to $999 | 62 (5.9%) | 159 (16.9%) |
| $1,000 to $1,499 | 251 (23.9%) | 354 (37.7%) |
| $1,500 to $1,999 | 142 (13.5%) | 102 (10.8%) |
| $2,000 to $2,499 | 85 (8.1%) | 0 (0.0%) |
| $2,500 to $2,999 | 38 (3.6%) | 12 (1.3%) |
| $3,000 or more | 0 (0.0%) | 0 (0.0%) |
| Total | 1,051 (100.0%) | 940 (100.0%) |
Physical Housing Characteristics in Lexington city
Housing Structures in Lexington city
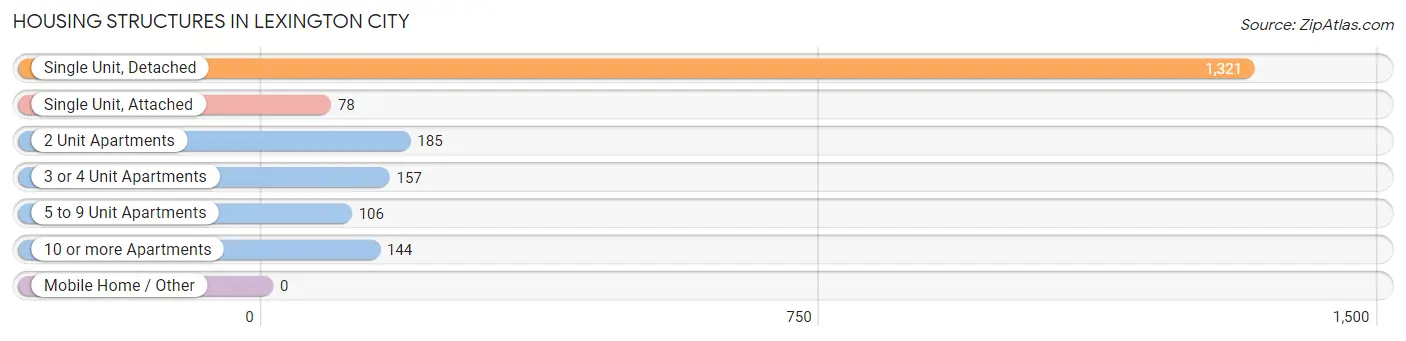
| Structure Type | # Housing Units | % Housing Units |
| Single Unit, Detached | 1,321 | 66.3% |
| Single Unit, Attached | 78 | 3.9% |
| 2 Unit Apartments | 185 | 9.3% |
| 3 or 4 Unit Apartments | 157 | 7.9% |
| 5 to 9 Unit Apartments | 106 | 5.3% |
| 10 or more Apartments | 144 | 7.2% |
| Mobile Home / Other | 0 | 0.0% |
| Total | 1,991 | 100.0% |
Housing Structures by Occupancy in Lexington city
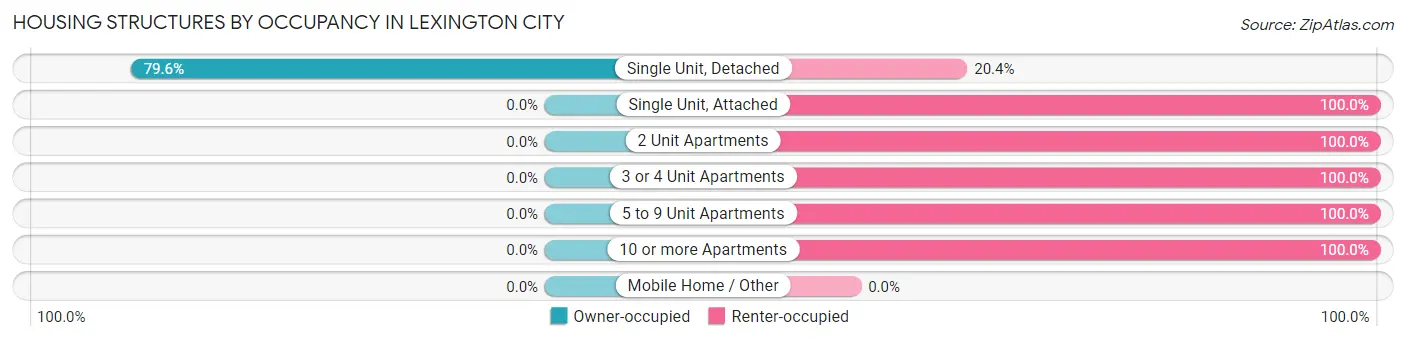
| Structure Type | Owner-occupied | Renter-occupied |
| Single Unit, Detached | 1,051 (79.6%) | 270 (20.4%) |
| Single Unit, Attached | 0 (0.0%) | 78 (100.0%) |
| 2 Unit Apartments | 0 (0.0%) | 185 (100.0%) |
| 3 or 4 Unit Apartments | 0 (0.0%) | 157 (100.0%) |
| 5 to 9 Unit Apartments | 0 (0.0%) | 106 (100.0%) |
| 10 or more Apartments | 0 (0.0%) | 144 (100.0%) |
| Mobile Home / Other | 0 (0.0%) | 0 (0.0%) |
| Total | 1,051 (52.8%) | 940 (47.2%) |
Housing Structures by Number of Rooms in Lexington city
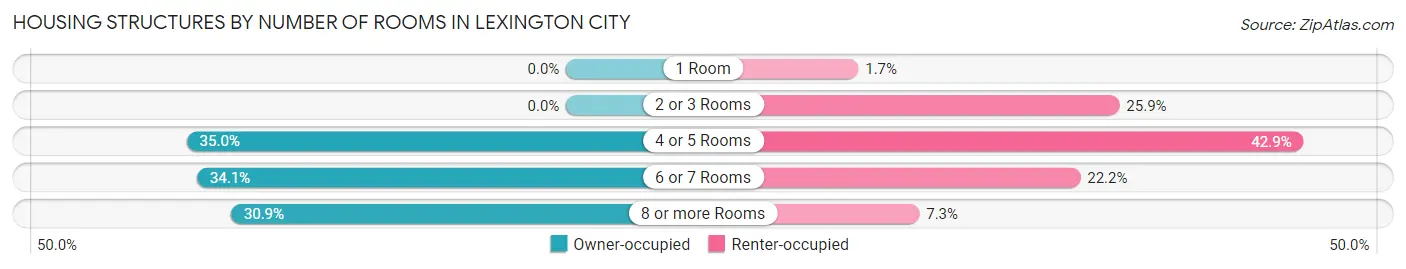
| Number of Rooms | Owner-occupied | Renter-occupied |
| 1 Room | 0 (0.0%) | 16 (1.7%) |
| 2 or 3 Rooms | 0 (0.0%) | 243 (25.9%) |
| 4 or 5 Rooms | 368 (35.0%) | 403 (42.9%) |
| 6 or 7 Rooms | 358 (34.1%) | 209 (22.2%) |
| 8 or more Rooms | 325 (30.9%) | 69 (7.3%) |
| Total | 1,051 (100.0%) | 940 (100.0%) |
Housing Structure by Heating Type in Lexington city
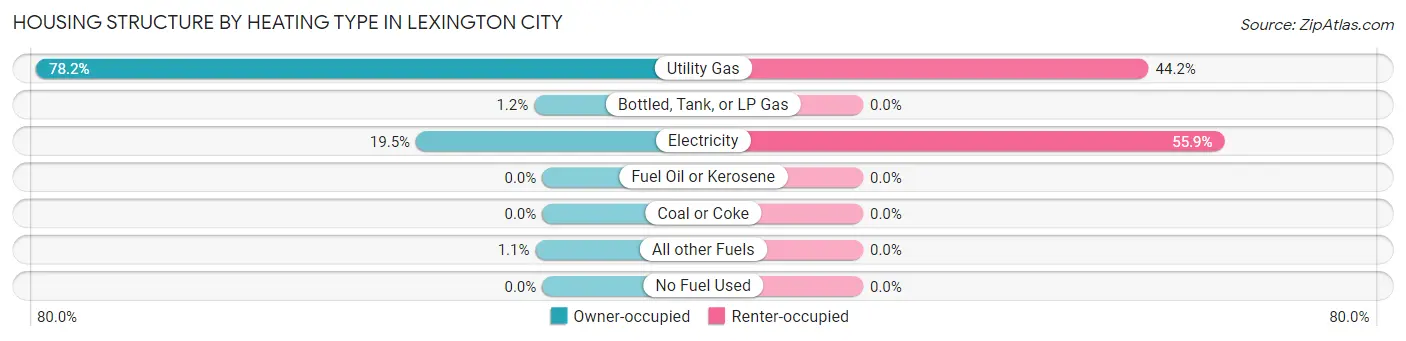
| Heating Type | Owner-occupied | Renter-occupied |
| Utility Gas | 822 (78.2%) | 415 (44.2%) |
| Bottled, Tank, or LP Gas | 13 (1.2%) | 0 (0.0%) |
| Electricity | 205 (19.5%) | 525 (55.8%) |
| Fuel Oil or Kerosene | 0 (0.0%) | 0 (0.0%) |
| Coal or Coke | 0 (0.0%) | 0 (0.0%) |
| All other Fuels | 11 (1.1%) | 0 (0.0%) |
| No Fuel Used | 0 (0.0%) | 0 (0.0%) |
| Total | 1,051 (100.0%) | 940 (100.0%) |
Household Vehicle Usage in Lexington city
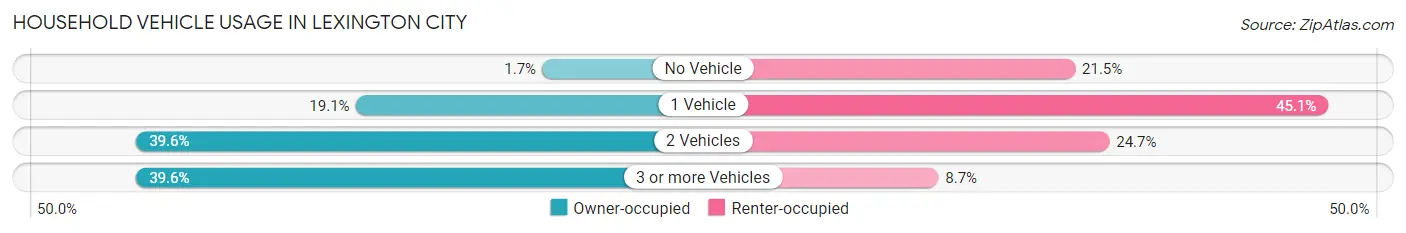
| Vehicles per Household | Owner-occupied | Renter-occupied |
| No Vehicle | 18 (1.7%) | 202 (21.5%) |
| 1 Vehicle | 201 (19.1%) | 424 (45.1%) |
| 2 Vehicles | 416 (39.6%) | 232 (24.7%) |
| 3 or more Vehicles | 416 (39.6%) | 82 (8.7%) |
| Total | 1,051 (100.0%) | 940 (100.0%) |
Real Estate & Mortgages in Lexington city
Real Estate and Mortgage Overview in Lexington city
| Characteristic | Without Mortgage | With Mortgage |
| Housing Units | 511 | 540 |
| Median Property Value | $192,200 | $281,900 |
| Median Household Income | $96,372 | $81 |
| Monthly Housing Costs | $346 | $0 |
| Real Estate Taxes | $1,496 | $0 |
Property Value by Mortgage Status in Lexington city
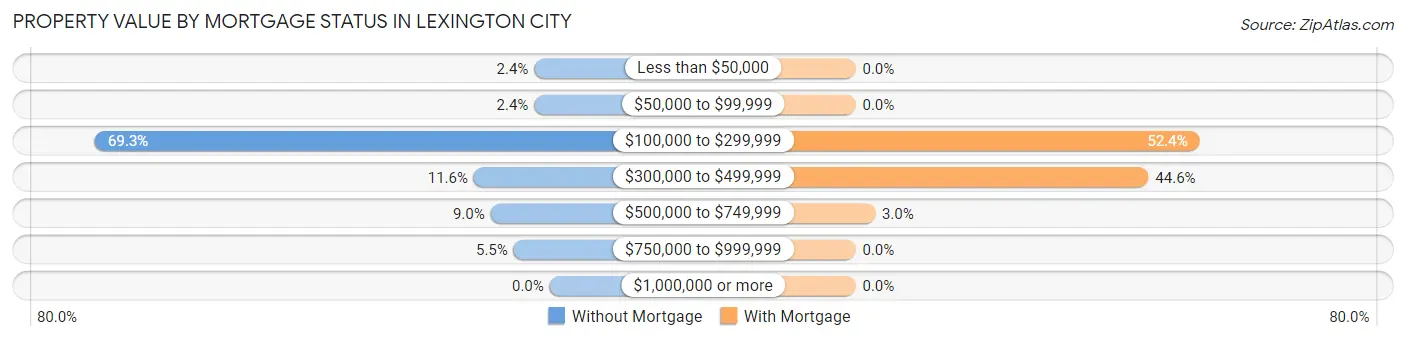
| Property Value | Without Mortgage | With Mortgage |
| Less than $50,000 | 12 (2.4%) | 0 (0.0%) |
| $50,000 to $99,999 | 12 (2.4%) | 0 (0.0%) |
| $100,000 to $299,999 | 354 (69.3%) | 283 (52.4%) |
| $300,000 to $499,999 | 59 (11.6%) | 241 (44.6%) |
| $500,000 to $749,999 | 46 (9.0%) | 16 (3.0%) |
| $750,000 to $999,999 | 28 (5.5%) | 0 (0.0%) |
| $1,000,000 or more | 0 (0.0%) | 0 (0.0%) |
| Total | 511 (100.0%) | 540 (100.0%) |
Household Income by Mortgage Status in Lexington city
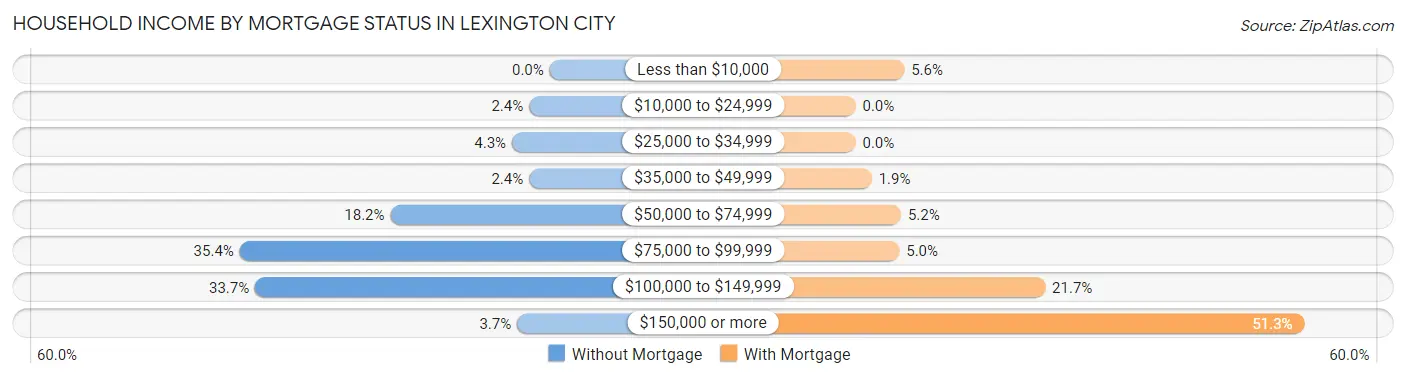
| Household Income | Without Mortgage | With Mortgage |
| Less than $10,000 | 0 (0.0%) | 30 (5.6%) |
| $10,000 to $24,999 | 12 (2.4%) | 0 (0.0%) |
| $25,000 to $34,999 | 22 (4.3%) | 0 (0.0%) |
| $35,000 to $49,999 | 12 (2.4%) | 10 (1.8%) |
| $50,000 to $74,999 | 93 (18.2%) | 28 (5.2%) |
| $75,000 to $99,999 | 181 (35.4%) | 27 (5.0%) |
| $100,000 to $149,999 | 172 (33.7%) | 117 (21.7%) |
| $150,000 or more | 19 (3.7%) | 277 (51.3%) |
| Total | 511 (100.0%) | 540 (100.0%) |
Property Value to Household Income Ratio in Lexington city
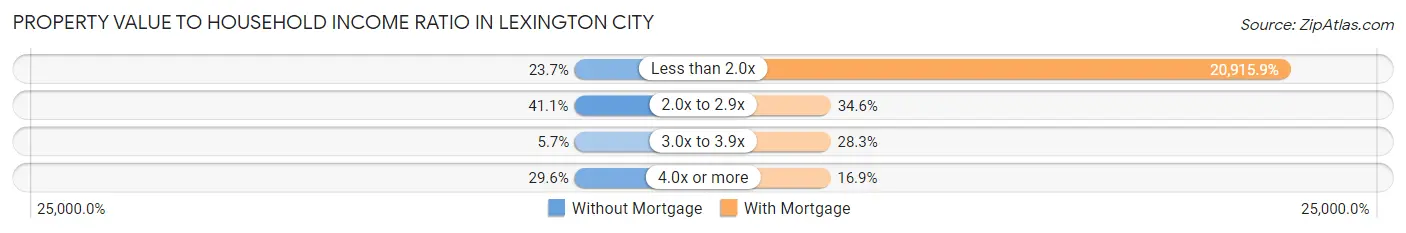
| Value-to-Income Ratio | Without Mortgage | With Mortgage |
| Less than 2.0x | 121 (23.7%) | 112,946 (20,915.9%) |
| 2.0x to 2.9x | 210 (41.1%) | 187 (34.6%) |
| 3.0x to 3.9x | 29 (5.7%) | 153 (28.3%) |
| 4.0x or more | 151 (29.5%) | 91 (16.9%) |
| Total | 511 (100.0%) | 540 (100.0%) |
Real Estate Taxes by Mortgage Status in Lexington city
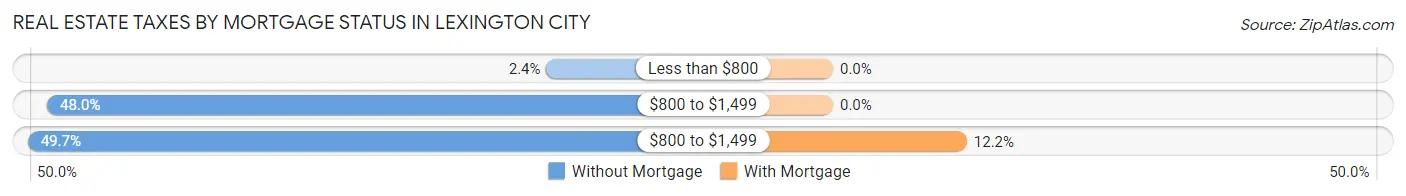
| Property Taxes | Without Mortgage | With Mortgage |
| Less than $800 | 12 (2.4%) | 0 (0.0%) |
| $800 to $1,499 | 245 (47.9%) | 0 (0.0%) |
| $800 to $1,499 | 254 (49.7%) | 66 (12.2%) |
| Total | 511 (100.0%) | 540 (100.0%) |
Health & Disability in Lexington city
Health Insurance Coverage by Age in Lexington city
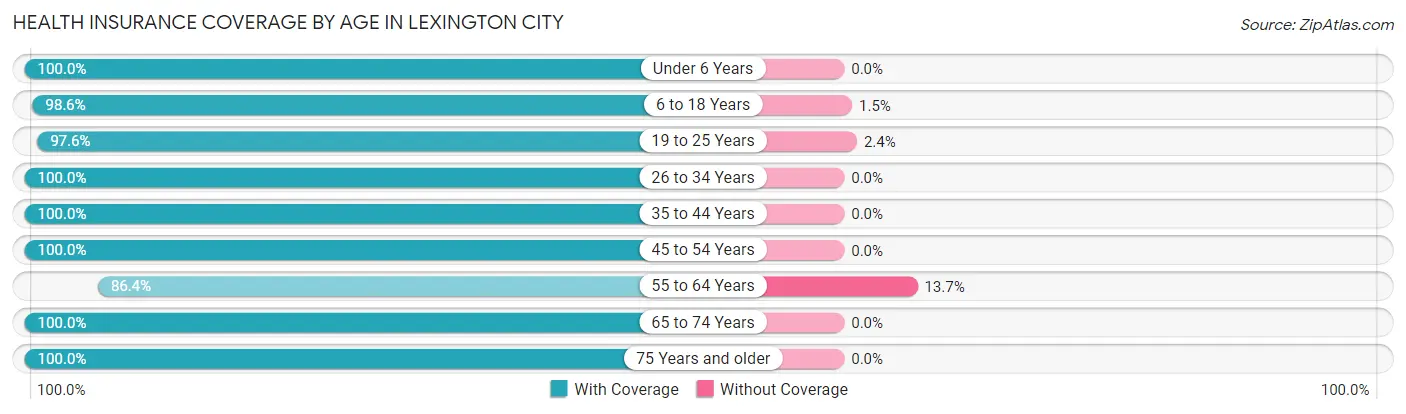
| Age Bracket | With Coverage | Without Coverage |
| Under 6 Years | 208 (100.0%) | 0 (0.0%) |
| 6 to 18 Years | 1,085 (98.6%) | 16 (1.5%) |
| 19 to 25 Years | 2,933 (97.6%) | 71 (2.4%) |
| 26 to 34 Years | 430 (100.0%) | 0 (0.0%) |
| 35 to 44 Years | 428 (100.0%) | 0 (0.0%) |
| 45 to 54 Years | 583 (100.0%) | 0 (0.0%) |
| 55 to 64 Years | 424 (86.4%) | 67 (13.7%) |
| 65 to 74 Years | 686 (100.0%) | 0 (0.0%) |
| 75 Years and older | 339 (100.0%) | 0 (0.0%) |
| Total | 7,116 (97.9%) | 154 (2.1%) |
Health Insurance Coverage by Citizenship Status in Lexington city
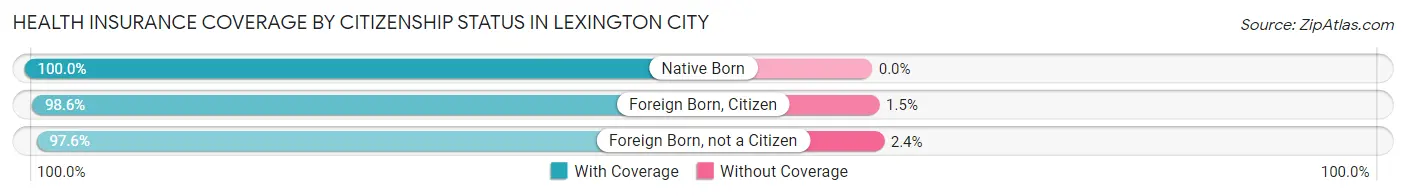
| Citizenship Status | With Coverage | Without Coverage |
| Native Born | 208 (100.0%) | 0 (0.0%) |
| Foreign Born, Citizen | 1,085 (98.6%) | 16 (1.5%) |
| Foreign Born, not a Citizen | 2,933 (97.6%) | 71 (2.4%) |
Health Insurance Coverage by Household Income in Lexington city
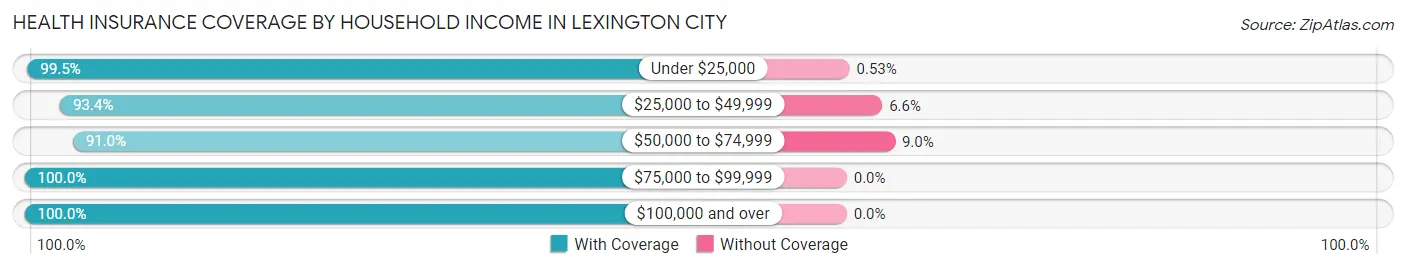
| Household Income | With Coverage | Without Coverage |
| Under $25,000 | 745 (99.5%) | 4 (0.5%) |
| $25,000 to $49,999 | 225 (93.4%) | 16 (6.6%) |
| $50,000 to $74,999 | 514 (91.0%) | 51 (9.0%) |
| $75,000 to $99,999 | 714 (100.0%) | 0 (0.0%) |
| $100,000 and over | 1,903 (100.0%) | 0 (0.0%) |
Public vs Private Health Insurance Coverage by Age in Lexington city
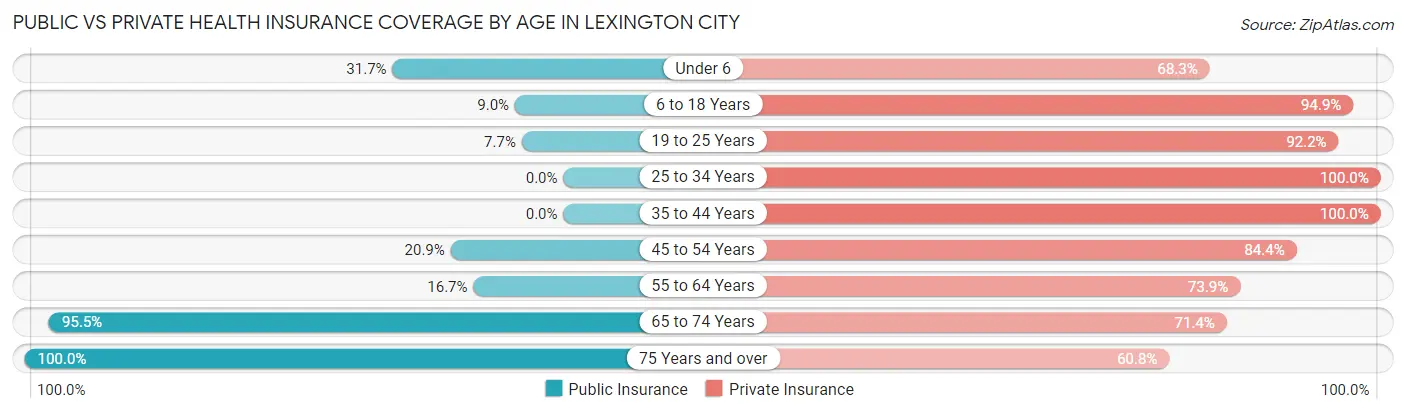
| Age Bracket | Public Insurance | Private Insurance |
| Under 6 | 66 (31.7%) | 142 (68.3%) |
| 6 to 18 Years | 99 (9.0%) | 1,045 (94.9%) |
| 19 to 25 Years | 232 (7.7%) | 2,769 (92.2%) |
| 25 to 34 Years | 0 (0.0%) | 430 (100.0%) |
| 35 to 44 Years | 0 (0.0%) | 428 (100.0%) |
| 45 to 54 Years | 122 (20.9%) | 492 (84.4%) |
| 55 to 64 Years | 82 (16.7%) | 363 (73.9%) |
| 65 to 74 Years | 655 (95.5%) | 490 (71.4%) |
| 75 Years and over | 339 (100.0%) | 206 (60.8%) |
| Total | 1,595 (21.9%) | 6,365 (87.5%) |
Disability Status by Sex by Age in Lexington city
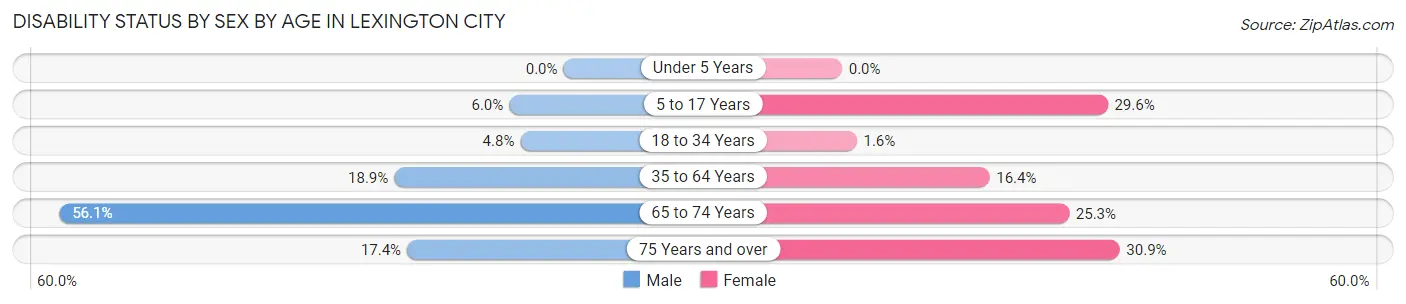
| Age Bracket | Male | Female |
| Under 5 Years | 0 (0.0%) | 0 (0.0%) |
| 5 to 17 Years | 9 (6.0%) | 50 (29.6%) |
| 18 to 34 Years | 135 (4.8%) | 23 (1.6%) |
| 35 to 64 Years | 134 (18.9%) | 130 (16.4%) |
| 65 to 74 Years | 192 (56.1%) | 87 (25.3%) |
| 75 Years and over | 23 (17.4%) | 64 (30.9%) |
Disability Class by Sex by Age in Lexington city
Disability Class: Hearing Difficulty
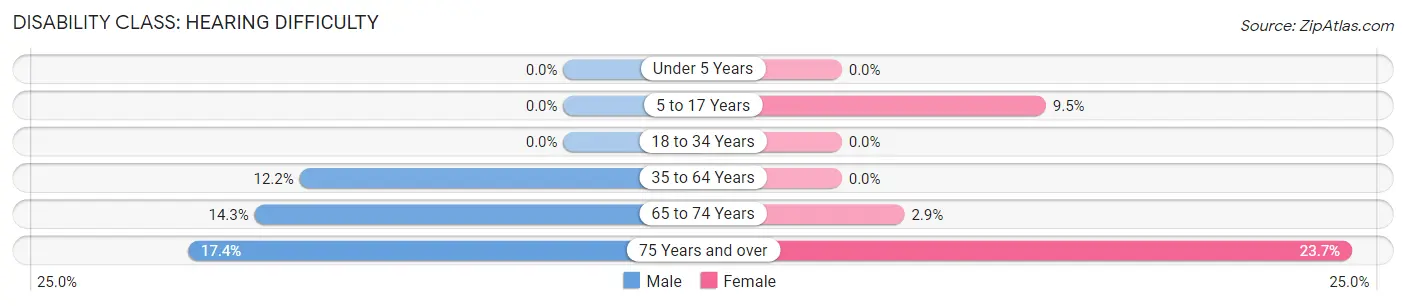
| Age Bracket | Male | Female |
| Under 5 Years | 0 (0.0%) | 0 (0.0%) |
| 5 to 17 Years | 0 (0.0%) | 16 (9.5%) |
| 18 to 34 Years | 0 (0.0%) | 0 (0.0%) |
| 35 to 64 Years | 87 (12.2%) | 0 (0.0%) |
| 65 to 74 Years | 49 (14.3%) | 10 (2.9%) |
| 75 Years and over | 23 (17.4%) | 49 (23.7%) |
Disability Class: Vision Difficulty
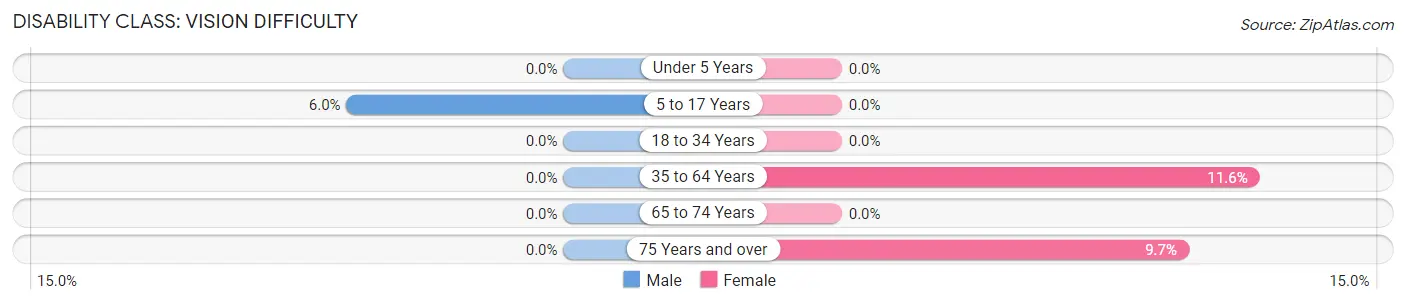
| Age Bracket | Male | Female |
| Under 5 Years | 0 (0.0%) | 0 (0.0%) |
| 5 to 17 Years | 9 (6.0%) | 0 (0.0%) |
| 18 to 34 Years | 0 (0.0%) | 0 (0.0%) |
| 35 to 64 Years | 0 (0.0%) | 92 (11.6%) |
| 65 to 74 Years | 0 (0.0%) | 0 (0.0%) |
| 75 Years and over | 0 (0.0%) | 20 (9.7%) |
Disability Class: Cognitive Difficulty
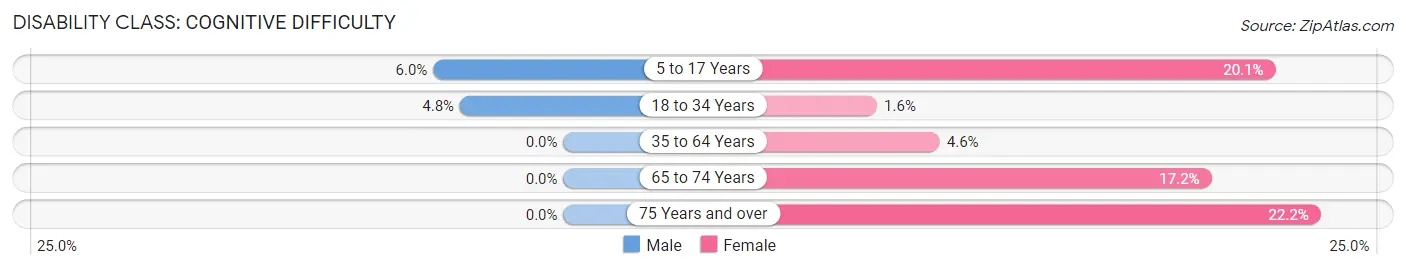
| Age Bracket | Male | Female |
| 5 to 17 Years | 9 (6.0%) | 34 (20.1%) |
| 18 to 34 Years | 135 (4.8%) | 23 (1.6%) |
| 35 to 64 Years | 0 (0.0%) | 36 (4.5%) |
| 65 to 74 Years | 0 (0.0%) | 59 (17.2%) |
| 75 Years and over | 0 (0.0%) | 46 (22.2%) |
Disability Class: Ambulatory Difficulty
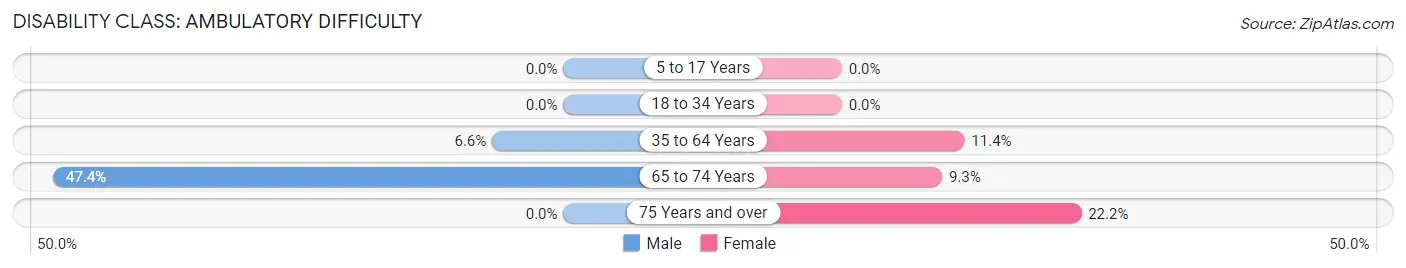
| Age Bracket | Male | Female |
| 5 to 17 Years | 0 (0.0%) | 0 (0.0%) |
| 18 to 34 Years | 0 (0.0%) | 0 (0.0%) |
| 35 to 64 Years | 47 (6.6%) | 90 (11.4%) |
| 65 to 74 Years | 162 (47.4%) | 32 (9.3%) |
| 75 Years and over | 0 (0.0%) | 46 (22.2%) |
Disability Class: Self-Care Difficulty
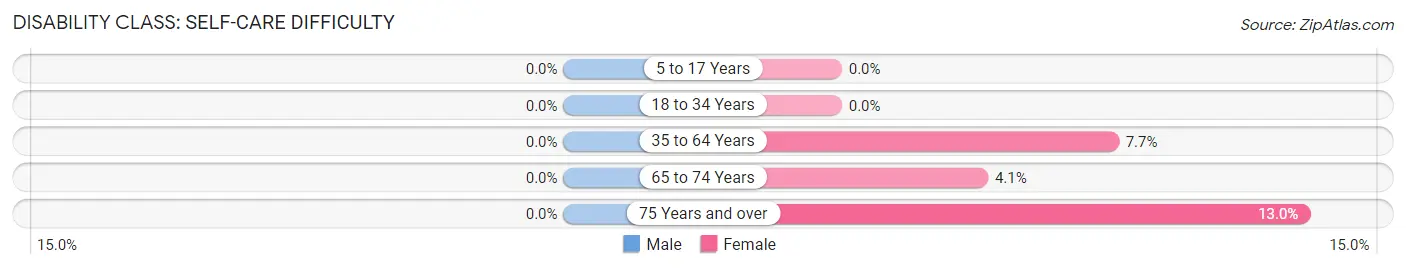
| Age Bracket | Male | Female |
| 5 to 17 Years | 0 (0.0%) | 0 (0.0%) |
| 18 to 34 Years | 0 (0.0%) | 0 (0.0%) |
| 35 to 64 Years | 0 (0.0%) | 61 (7.7%) |
| 65 to 74 Years | 0 (0.0%) | 14 (4.1%) |
| 75 Years and over | 0 (0.0%) | 27 (13.0%) |
Technology Access in Lexington city
Computing Device Access in Lexington city
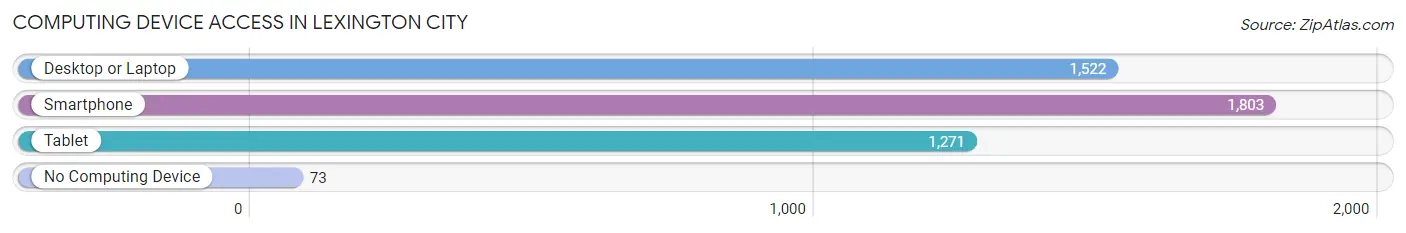
| Device Type | # Households | % Households |
| Desktop or Laptop | 1,522 | 76.4% |
| Smartphone | 1,803 | 90.6% |
| Tablet | 1,271 | 63.8% |
| No Computing Device | 73 | 3.7% |
| Total | 1,991 | 100.0% |
Internet Access in Lexington city
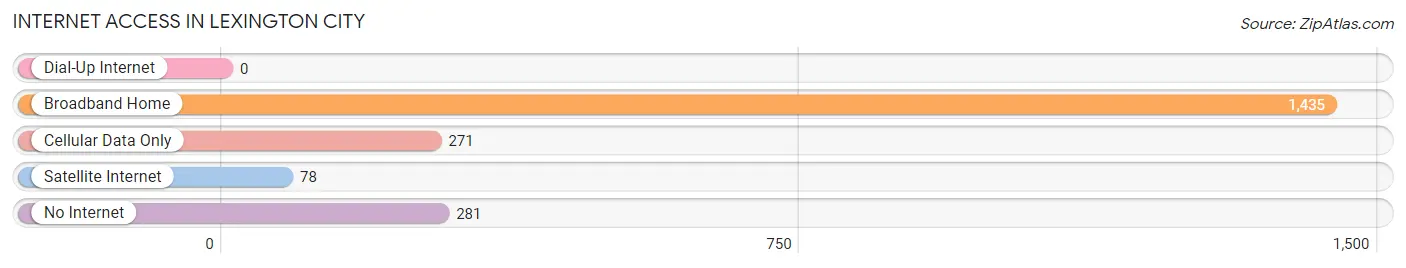
| Internet Type | # Households | % Households |
| Dial-Up Internet | 0 | 0.0% |
| Broadband Home | 1,435 | 72.1% |
| Cellular Data Only | 271 | 13.6% |
| Satellite Internet | 78 | 3.9% |
| No Internet | 281 | 14.1% |
| Total | 1,991 | 100.0% |
Lexington city Summary
Lexington City, Virginia is a small city located in the Shenandoah Valley of Virginia. It is the county seat of Rockbridge County and is located at the intersection of Interstate 81 and US Route 11. The city is home to the Virginia Military Institute and Washington and Lee University. The population of Lexington City was 6,867 as of the 2010 census.
History
The area that is now Lexington City was first settled in 1777 by Scots-Irish immigrants. The town was named after the Battle of Lexington in Massachusetts, which was fought during the American Revolutionary War. The town was officially incorporated in 1806.
In 1839, the Virginia Military Institute (VMI) was founded in Lexington City. VMI is the oldest state-supported military college in the United States. In 1849, Washington and Lee University was founded in Lexington City. The university was originally named Washington College, but was renamed in honor of General Robert E. Lee in 1865.
During the Civil War, Lexington City was the site of several battles. In 1864, the Battle of Lexington was fought in the city. The Confederate forces were victorious in this battle.
Geography
Lexington City is located in the Shenandoah Valley of Virginia. The city is situated at the intersection of Interstate 81 and US Route 11. The city is located at the base of the Blue Ridge Mountains and is surrounded by the George Washington and Jefferson National Forests.
The city has a total area of 4.2 square miles, all of which is land. The city is located at an elevation of 1,400 feet above sea level.
Economy
The economy of Lexington City is largely based on education and tourism. The city is home to the Virginia Military Institute and Washington and Lee University. These two institutions are the largest employers in the city.
The city is also a popular tourist destination. The city is home to several historic sites, including the Stonewall Jackson House, the Lee Chapel, and the Virginia Military Institute Museum. The city also hosts several festivals and events throughout the year, including the Rockbridge County Fair and the Lexington Barbecue Festival.
Demographics
As of the 2010 census, the population of Lexington City was 6,867. The racial makeup of the city was 90.2% White, 5.3% African American, 0.4% Native American, 1.7% Asian, 0.1% Pacific Islander, 0.7% from other races, and 1.6% from two or more races. Hispanic or Latino of any race were 2.2% of the population.
The median household income in Lexington City was $41,945, and the median family income was $54,844. The per capita income for the city was $25,945. About 11.2% of families and 15.3% of the population were below the poverty line, including 22.2% of those under age 18 and 8.2% of those age 65 or over.
Common Questions
What is Per Capita Income in Lexington city?
Per Capita income in Lexington city is $29,117.
What is the Median Family Income in Lexington city?
Median Family Income in Lexington city is $103,359.
What is the Median Household income in Lexington city?
Median Household Income in Lexington city is $93,651.
What is Income or Wage Gap in Lexington city?
Income or Wage Gap in Lexington city is 29.7%.
Women in Lexington city earn 70.3 cents for every dollar earned by a man.
What is Inequality or Gini Index in Lexington city?
Inequality or Gini Index in Lexington city is 0.41.
What is the Total Population of Lexington city?
Total Population of Lexington city is 7,346.
What is the Total Male Population of Lexington city?
Total Male Population of Lexington city is 4,285.
What is the Total Female Population of Lexington city?
Total Female Population of Lexington city is 3,061.
What is the Ratio of Males per 100 Females in Lexington city?
There are 139.99 Males per 100 Females in Lexington city.
What is the Ratio of Females per 100 Males in Lexington city?
There are 71.44 Females per 100 Males in Lexington city.
What is the Median Population Age in Lexington city?
Median Population Age in Lexington city is 22.7 Years.
What is the Average Family Size in Lexington city
Average Family Size in Lexington city is 2.8 People.
What is the Average Household Size in Lexington city
Average Household Size in Lexington city is 2.1 People.
How Large is the Labor Force in Lexington city?
There are 2,893 People in the Labor Forcein in Lexington city.
What is the Percentage of People in the Labor Force in Lexington city?
41.8% of People are in the Labor Force in Lexington city.
What is the Unemployment Rate in Lexington city?
Unemployment Rate in Lexington city is 2.5%.