Covington city, VA Map & Demographics
Covington city Map
Covington city Overview
$24,657
PER CAPITA INCOME
$57,125
AVG FAMILY INCOME
$45,737
AVG HOUSEHOLD INCOME
53.9%
WAGE / INCOME GAP [ % ]
46.1¢/ $1
WAGE / INCOME GAP [ $ ]
$8,627
FAMILY INCOME DEFICIT
0.40
INEQUALITY / GINI INDEX
5,722
TOTAL POPULATION
2,716
MALE POPULATION
3,006
FEMALE POPULATION
90.35
MALES / 100 FEMALES
110.68
FEMALES / 100 MALES
41.9
MEDIAN AGE
2.9
AVG FAMILY SIZE
2.2
AVG HOUSEHOLD SIZE
2,421
LABOR FORCE [ PEOPLE ]
53.9%
PERCENT IN LABOR FORCE
2.6%
UNEMPLOYMENT RATE
Income in Covington city
Income Overview in Covington city
Per Capita Income in Covington city is $24,657, while median incomes of families and households are $57,125 and $45,737 respectively.
| Characteristic | Number | Measure |
| Per Capita Income | 5,722 | $24,657 |
| Median Family Income | 1,520 | $57,125 |
| Mean Family Income | 1,520 | $66,362 |
| Median Household Income | 2,503 | $45,737 |
| Mean Household Income | 2,503 | $55,199 |
| Income Deficit | 1,520 | $8,627 |
| Wage / Income Gap (%) | 5,722 | 53.92% |
| Wage / Income Gap ($) | 5,722 | 46.08¢ per $1 |
| Gini / Inequality Index | 5,722 | 0.40 |
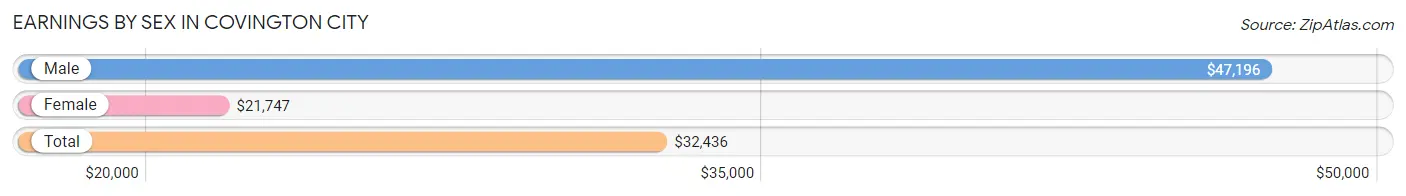
Earnings by Sex in Covington city
Average Earnings in Covington city are $32,436, $47,196 for men and $21,747 for women, a difference of 53.9%.
| Sex | Number | Average Earnings |
| Male | 1,235 (47.6%) | $47,196 |
| Female | 1,361 (52.4%) | $21,747 |
| Total | 2,596 (100.0%) | $32,436 |
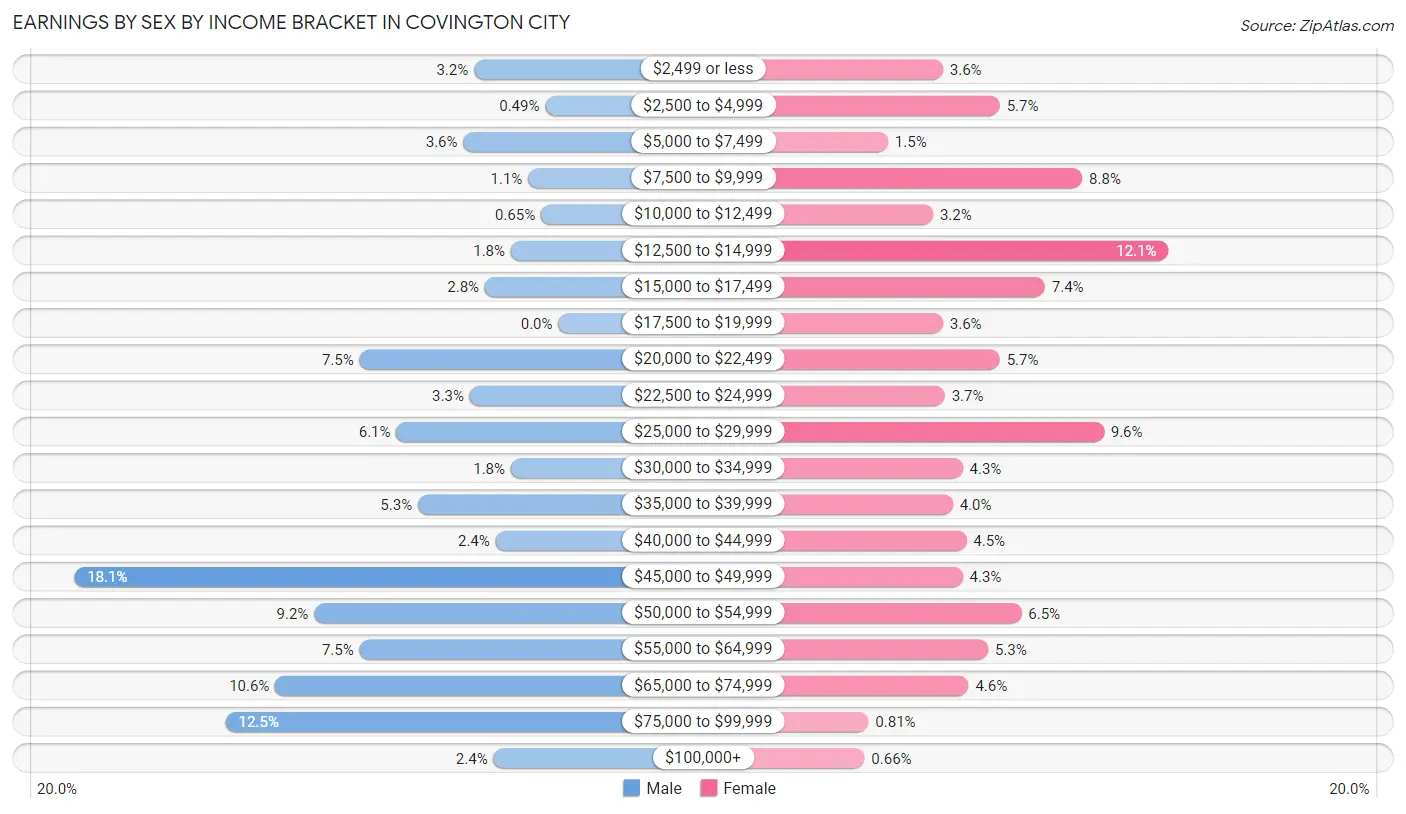
Earnings by Sex by Income Bracket in Covington city
The most common earnings brackets in Covington city are $45,000 to $49,999 for men (224 | 18.1%) and $12,500 to $14,999 for women (164 | 12.0%).
| Income | Male | Female |
| $2,499 or less | 39 (3.2%) | 49 (3.6%) |
| $2,500 to $4,999 | 6 (0.5%) | 78 (5.7%) |
| $5,000 to $7,499 | 44 (3.6%) | 21 (1.5%) |
| $7,500 to $9,999 | 14 (1.1%) | 120 (8.8%) |
| $10,000 to $12,499 | 8 (0.6%) | 44 (3.2%) |
| $12,500 to $14,999 | 22 (1.8%) | 164 (12.0%) |
| $15,000 to $17,499 | 34 (2.8%) | 101 (7.4%) |
| $17,500 to $19,999 | 0 (0.0%) | 49 (3.6%) |
| $20,000 to $22,499 | 92 (7.4%) | 78 (5.7%) |
| $22,500 to $24,999 | 41 (3.3%) | 50 (3.7%) |
| $25,000 to $29,999 | 75 (6.1%) | 131 (9.6%) |
| $30,000 to $34,999 | 22 (1.8%) | 59 (4.3%) |
| $35,000 to $39,999 | 65 (5.3%) | 54 (4.0%) |
| $40,000 to $44,999 | 29 (2.4%) | 61 (4.5%) |
| $45,000 to $49,999 | 224 (18.1%) | 59 (4.3%) |
| $50,000 to $54,999 | 113 (9.1%) | 89 (6.5%) |
| $55,000 to $64,999 | 92 (7.4%) | 72 (5.3%) |
| $65,000 to $74,999 | 131 (10.6%) | 62 (4.6%) |
| $75,000 to $99,999 | 154 (12.5%) | 11 (0.8%) |
| $100,000+ | 30 (2.4%) | 9 (0.7%) |
| Total | 1,235 (100.0%) | 1,361 (100.0%) |
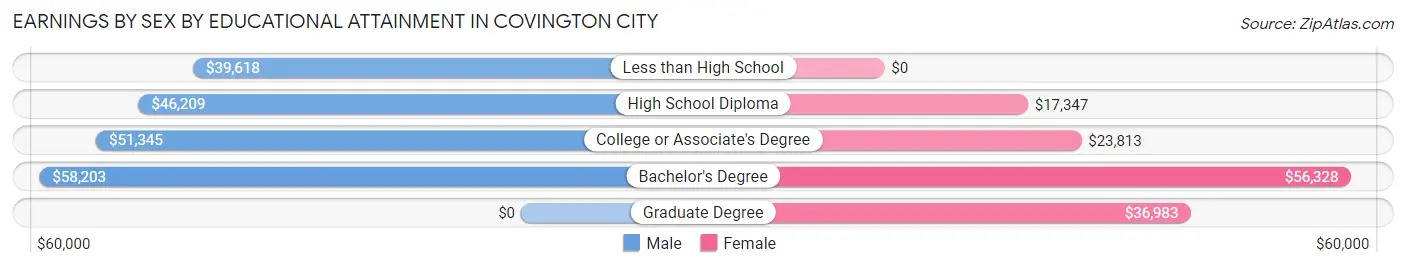
Earnings by Sex by Educational Attainment in Covington city
Average earnings in Covington city are $47,688 for men and $25,140 for women, a difference of 47.3%. Men with an educational attainment of bachelor's degree enjoy the highest average annual earnings of $58,203, while those with less than high school education earn the least with $39,618. Women with an educational attainment of bachelor's degree earn the most with the average annual earnings of $56,328, while those with high school diploma education have the smallest earnings of $17,347.
| Educational Attainment | Male Income | Female Income |
| Less than High School | $39,618 | $0 |
| High School Diploma | $46,209 | $17,347 |
| College or Associate's Degree | $51,345 | $23,813 |
| Bachelor's Degree | $58,203 | $56,328 |
| Graduate Degree | - | - |
| Total | $47,688 | $25,140 |
Family Income in Covington city
Family Income Brackets in Covington city
According to the Covington city family income data, there are 350 families falling into the $50,000 to $74,999 income range, which is the most common income bracket and makes up 23.0% of all families. Conversely, the $200,000+ income bracket is the least frequent group with only 5 families (0.3%) belonging to this category.
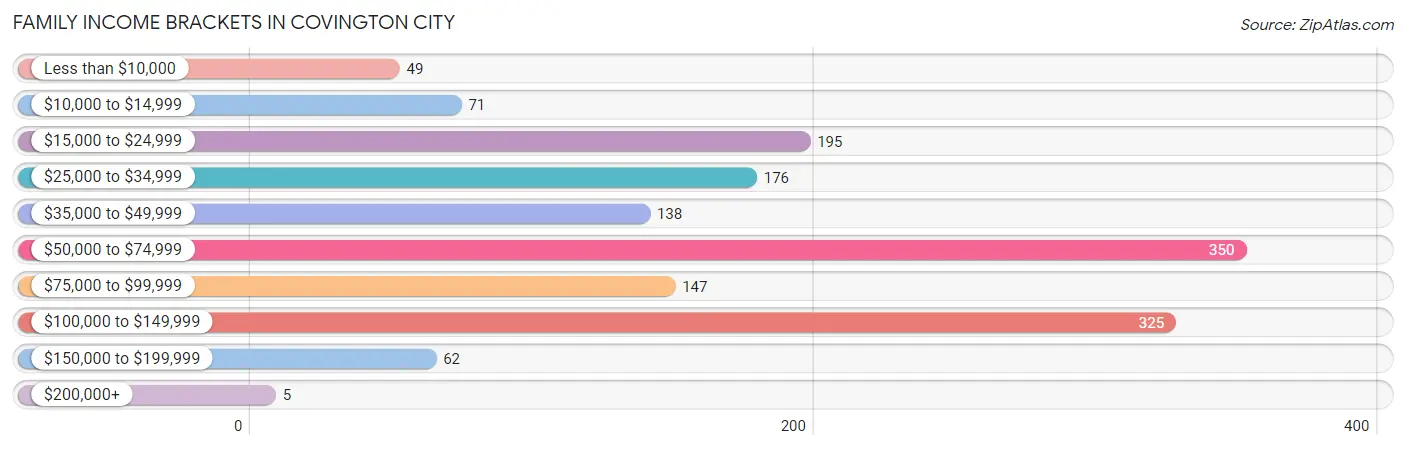
| Income Bracket | # Families | % Families |
| Less than $10,000 | 49 | 3.2% |
| $10,000 to $14,999 | 71 | 4.7% |
| $15,000 to $24,999 | 195 | 12.8% |
| $25,000 to $34,999 | 176 | 11.6% |
| $35,000 to $49,999 | 138 | 9.1% |
| $50,000 to $74,999 | 350 | 23.0% |
| $75,000 to $99,999 | 147 | 9.7% |
| $100,000 to $149,999 | 325 | 21.4% |
| $150,000 to $199,999 | 62 | 4.1% |
| $200,000+ | 5 | 0.3% |
Family Income by Famaliy Size in Covington city
5-person families (154 | 10.1%) account for the highest median family income in Covington city with $96,944 per family, while 2-person families (803 | 52.8%) have the highest median income of $25,068 per family member.
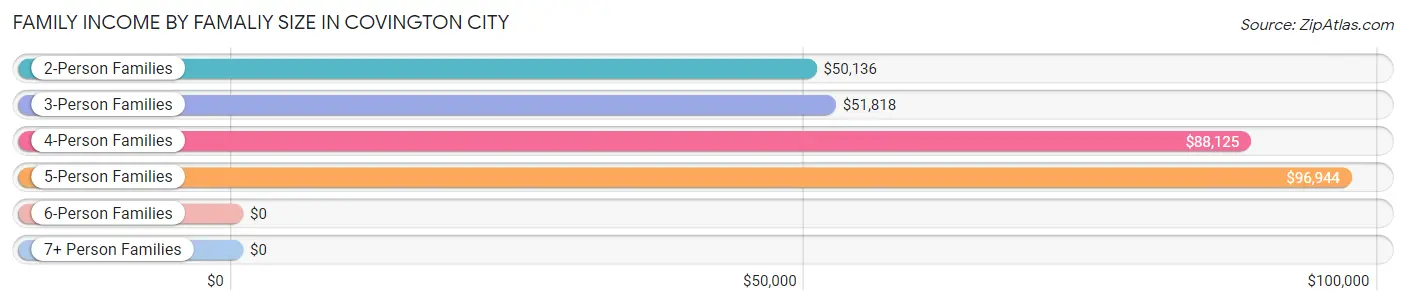
| Income Bracket | # Families | Median Income |
| 2-Person Families | 803 (52.8%) | $50,136 |
| 3-Person Families | 346 (22.8%) | $51,818 |
| 4-Person Families | 206 (13.6%) | $88,125 |
| 5-Person Families | 154 (10.1%) | $96,944 |
| 6-Person Families | 11 (0.7%) | $0 |
| 7+ Person Families | 0 (0.0%) | $0 |
| Total | 1,520 (100.0%) | $57,125 |
Family Income by Number of Earners in Covington city
The median family income in Covington city is $57,125, with families comprising 3+ earners (68) having the highest median family income of $118,966, while families with no earners (323) have the lowest median family income of $25,653, accounting for 4.5% and 21.2% of families, respectively.
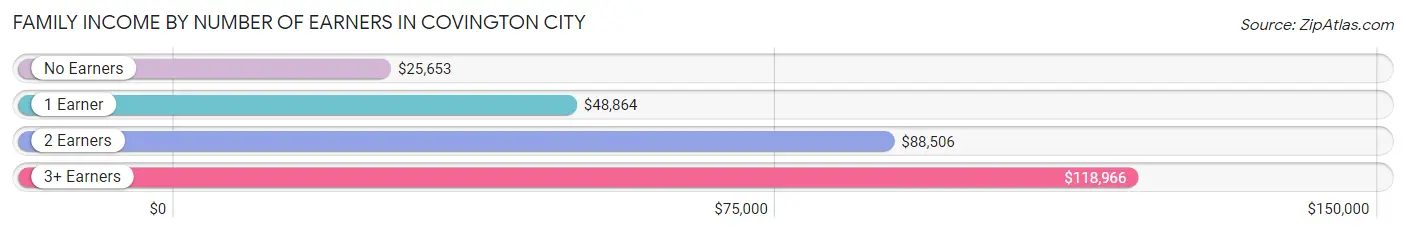
| Number of Earners | # Families | Median Income |
| No Earners | 323 (21.2%) | $25,653 |
| 1 Earner | 660 (43.4%) | $48,864 |
| 2 Earners | 469 (30.9%) | $88,506 |
| 3+ Earners | 68 (4.5%) | $118,966 |
| Total | 1,520 (100.0%) | $57,125 |
Household Income in Covington city
Household Income Brackets in Covington city
With 493 households falling in the category, the $50,000 to $74,999 income range is the most frequent in Covington city, accounting for 19.7% of all households. In contrast, only 5 households (0.2%) fall into the $200,000+ income bracket, making it the least populous group.
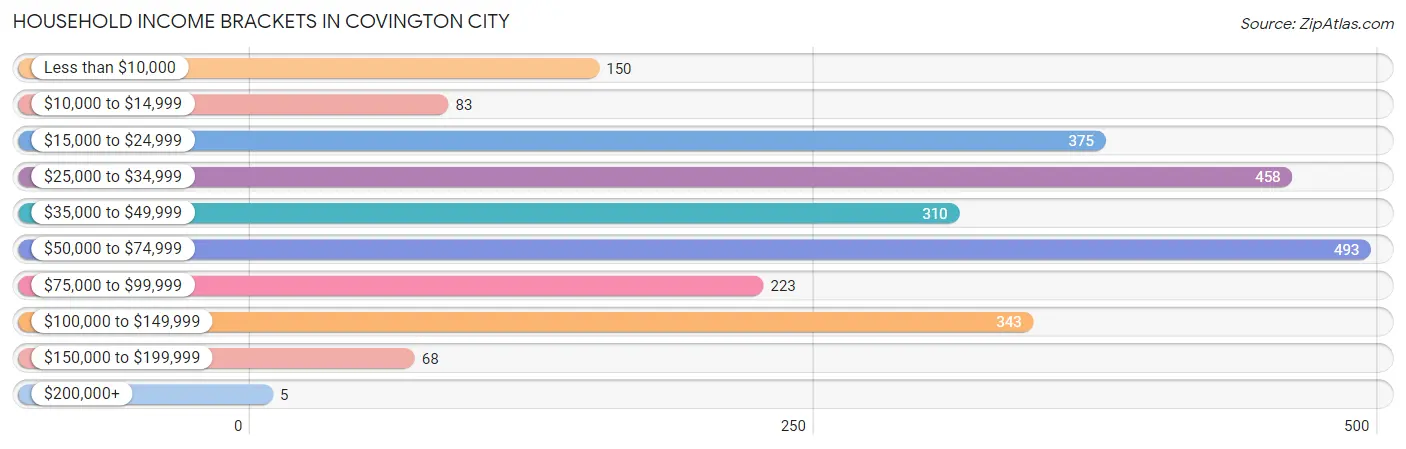
| Income Bracket | # Households | % Households |
| Less than $10,000 | 150 | 6.0% |
| $10,000 to $14,999 | 83 | 3.3% |
| $15,000 to $24,999 | 375 | 15.0% |
| $25,000 to $34,999 | 458 | 18.3% |
| $35,000 to $49,999 | 310 | 12.4% |
| $50,000 to $74,999 | 493 | 19.7% |
| $75,000 to $99,999 | 223 | 8.9% |
| $100,000 to $149,999 | 343 | 13.7% |
| $150,000 to $199,999 | 68 | 2.7% |
| $200,000+ | 5 | 0.2% |
Household Income by Householder Age in Covington city
The median household income in Covington city is $45,737, with the highest median household income of $51,172 found in the 45 to 64 years age bracket for the primary householder. A total of 814 households (32.5%) fall into this category. Meanwhile, the 65+ years age bracket for the primary householder has the lowest median household income of $35,833, with 788 households (31.5%) in this group.
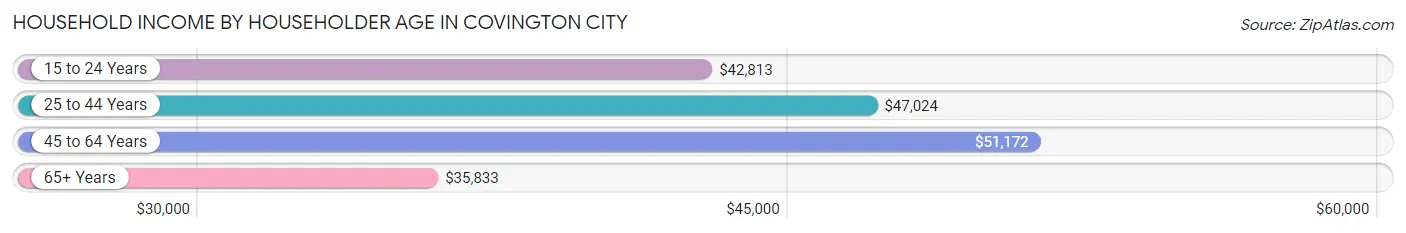
| Income Bracket | # Households | Median Income |
| 15 to 24 Years | 32 (1.3%) | $42,813 |
| 25 to 44 Years | 869 (34.7%) | $47,024 |
| 45 to 64 Years | 814 (32.5%) | $51,172 |
| 65+ Years | 788 (31.5%) | $35,833 |
| Total | 2,503 (100.0%) | $45,737 |
Poverty in Covington city
Income Below Poverty by Sex and Age in Covington city
With 14.8% poverty level for males and 18.8% for females among the residents of Covington city, under 5 year old males and 6 to 11 year old females are the most vulnerable to poverty, with 55 males (38.5%) and 142 females (40.8%) in their respective age groups living below the poverty level.
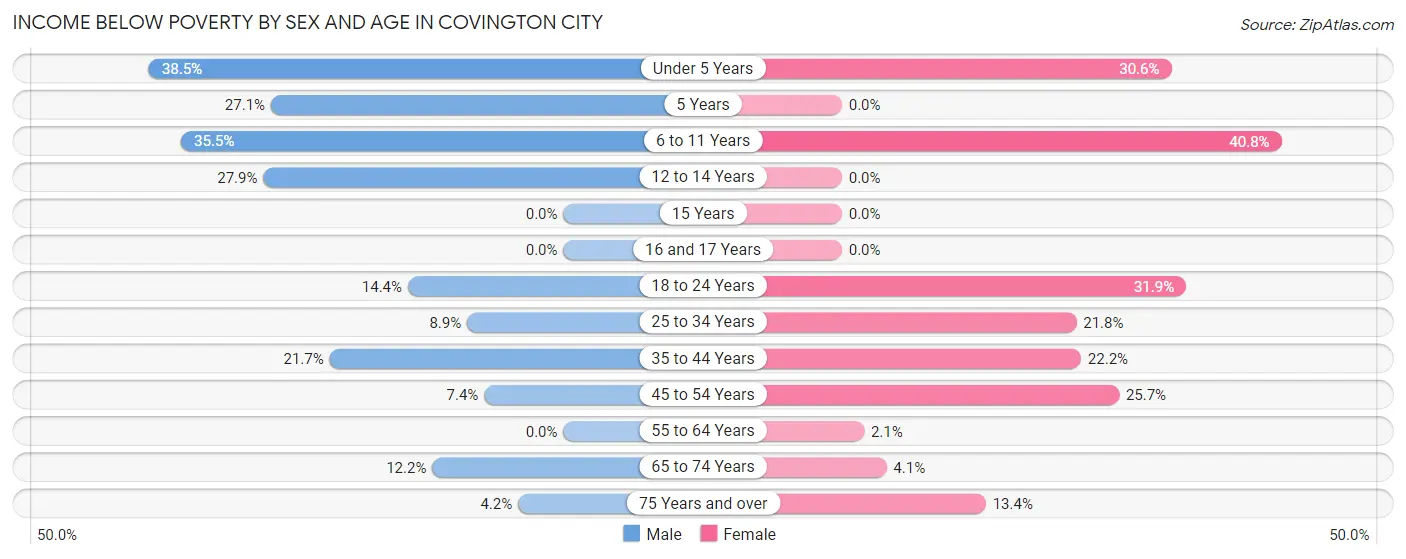
| Age Bracket | Male | Female |
| Under 5 Years | 55 (38.5%) | 63 (30.6%) |
| 5 Years | 19 (27.1%) | 0 (0.0%) |
| 6 to 11 Years | 72 (35.5%) | 142 (40.8%) |
| 12 to 14 Years | 44 (27.9%) | 0 (0.0%) |
| 15 Years | 0 (0.0%) | 0 (0.0%) |
| 16 and 17 Years | 0 (0.0%) | 0 (0.0%) |
| 18 to 24 Years | 29 (14.4%) | 69 (31.9%) |
| 25 to 34 Years | 32 (8.9%) | 74 (21.8%) |
| 35 to 44 Years | 74 (21.7%) | 79 (22.2%) |
| 45 to 54 Years | 20 (7.3%) | 71 (25.7%) |
| 55 to 64 Years | 0 (0.0%) | 10 (2.1%) |
| 65 to 74 Years | 37 (12.2%) | 14 (4.1%) |
| 75 Years and over | 6 (4.2%) | 41 (13.4%) |
| Total | 388 (14.8%) | 563 (18.8%) |
Income Above Poverty by Sex and Age in Covington city
According to the poverty statistics in Covington city, males aged 16 and 17 years and females aged 12 to 14 years are the age groups that are most secure financially, with 100.0% of males and 100.0% of females in these age groups living above the poverty line.
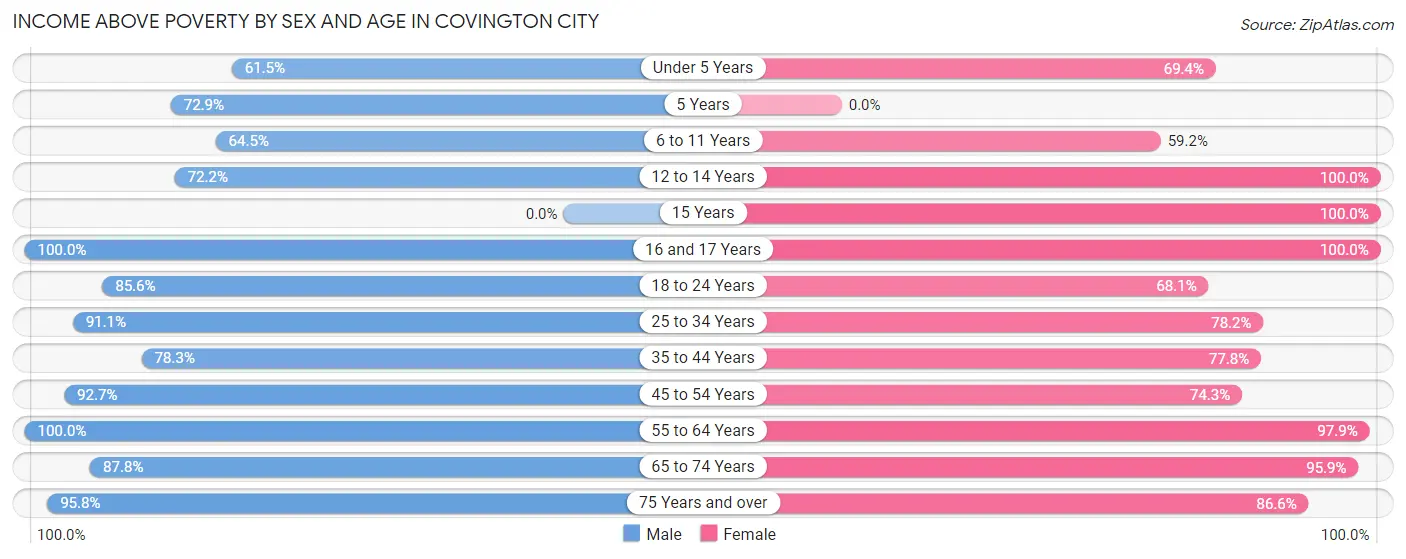
| Age Bracket | Male | Female |
| Under 5 Years | 88 (61.5%) | 143 (69.4%) |
| 5 Years | 51 (72.9%) | 0 (0.0%) |
| 6 to 11 Years | 131 (64.5%) | 206 (59.2%) |
| 12 to 14 Years | 114 (72.2%) | 74 (100.0%) |
| 15 Years | 0 (0.0%) | 14 (100.0%) |
| 16 and 17 Years | 21 (100.0%) | 34 (100.0%) |
| 18 to 24 Years | 172 (85.6%) | 147 (68.1%) |
| 25 to 34 Years | 326 (91.1%) | 266 (78.2%) |
| 35 to 44 Years | 267 (78.3%) | 277 (77.8%) |
| 45 to 54 Years | 252 (92.6%) | 205 (74.3%) |
| 55 to 64 Years | 411 (100.0%) | 476 (97.9%) |
| 65 to 74 Years | 267 (87.8%) | 324 (95.9%) |
| 75 Years and over | 137 (95.8%) | 266 (86.6%) |
| Total | 2,237 (85.2%) | 2,432 (81.2%) |
Income Below Poverty Among Married-Couple Families in Covington city
The poverty statistics for married-couple families in Covington city show that 4.0% or 45 of the total 1,113 families live below the poverty line. Families with 1 or 2 children have the highest poverty rate of 11.6%, comprising of 34 families. On the other hand, families with 3 or 4 children have the lowest poverty rate of 0.0%, which includes 0 families.
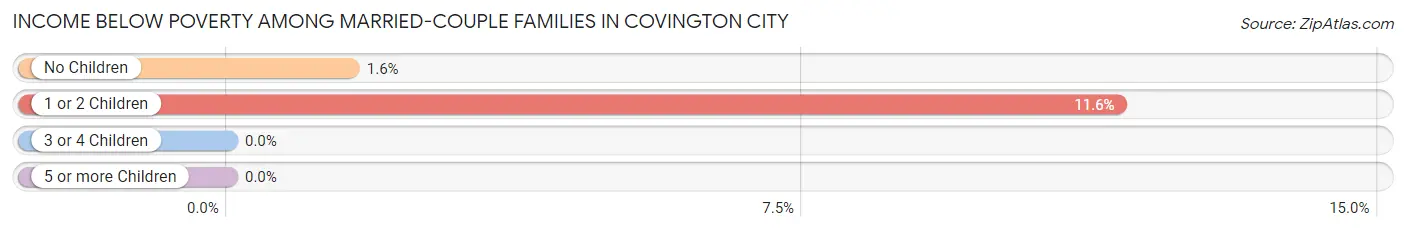
| Children | Above Poverty | Below Poverty |
| No Children | 679 (98.4%) | 11 (1.6%) |
| 1 or 2 Children | 259 (88.4%) | 34 (11.6%) |
| 3 or 4 Children | 130 (100.0%) | 0 (0.0%) |
| 5 or more Children | 0 (0.0%) | 0 (0.0%) |
| Total | 1,068 (96.0%) | 45 (4.0%) |
Income Below Poverty Among Single-Parent Households in Covington city
According to the poverty data in Covington city, 24.7% or 46 single-father households and 71.0% or 157 single-mother households are living below the poverty line. Among single-father households, those with 3 or 4 children have the highest poverty rate, with 39 households (100.0%) experiencing poverty. Likewise, among single-mother households, those with 3 or 4 children have the highest poverty rate, with 8 households (100.0%) falling below the poverty line.
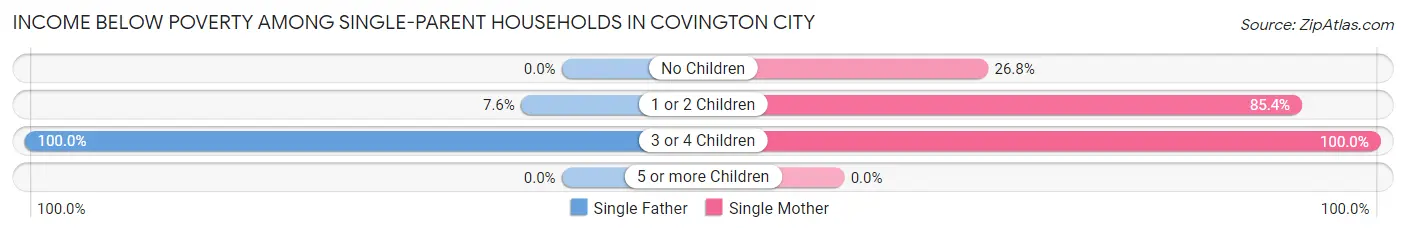
| Children | Single Father | Single Mother |
| No Children | 0 (0.0%) | 15 (26.8%) |
| 1 or 2 Children | 7 (7.6%) | 134 (85.4%) |
| 3 or 4 Children | 39 (100.0%) | 8 (100.0%) |
| 5 or more Children | 0 (0.0%) | 0 (0.0%) |
| Total | 46 (24.7%) | 157 (71.0%) |
Income Below Poverty Among Married-Couple vs Single-Parent Households in Covington city
The poverty data for Covington city shows that 45 of the married-couple family households (4.0%) and 203 of the single-parent households (49.9%) are living below the poverty level. Within the married-couple family households, those with 1 or 2 children have the highest poverty rate, with 34 households (11.6%) falling below the poverty line. Among the single-parent households, those with 3 or 4 children have the highest poverty rate, with 47 household (100.0%) living below poverty.
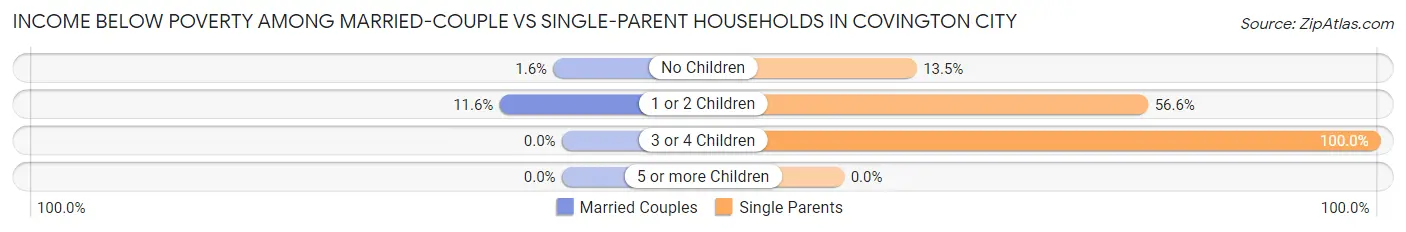
| Children | Married-Couple Families | Single-Parent Households |
| No Children | 11 (1.6%) | 15 (13.5%) |
| 1 or 2 Children | 34 (11.6%) | 141 (56.6%) |
| 3 or 4 Children | 0 (0.0%) | 47 (100.0%) |
| 5 or more Children | 0 (0.0%) | 0 (0.0%) |
| Total | 45 (4.0%) | 203 (49.9%) |
Race in Covington city
The most populous races in Covington city are White / Caucasian (4,672 | 81.7%), Black / African American (770 | 13.5%), and Two or more Races (216 | 3.8%).
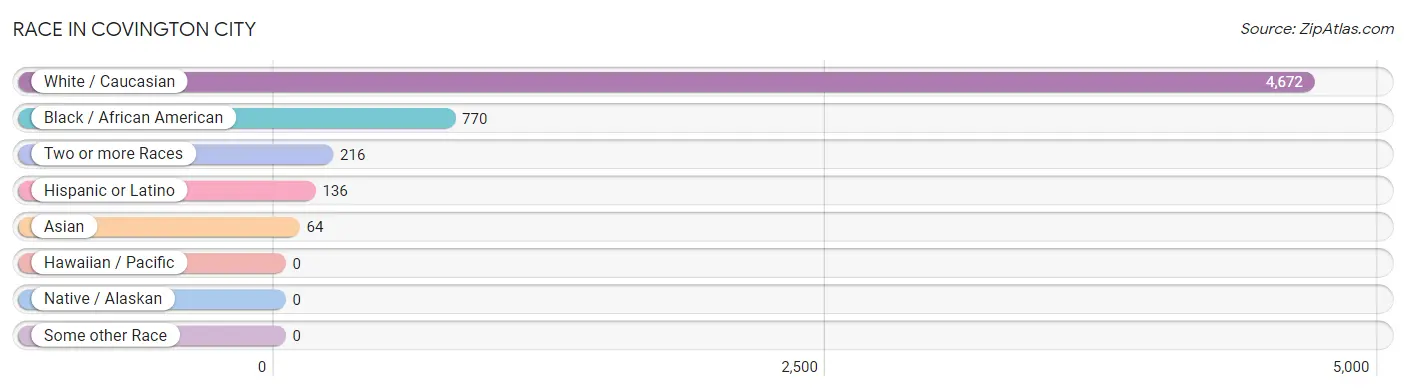
| Race | # Population | % Population |
| Asian | 64 | 1.1% |
| Black / African American | 770 | 13.5% |
| Hawaiian / Pacific | 0 | 0.0% |
| Hispanic or Latino | 136 | 2.4% |
| Native / Alaskan | 0 | 0.0% |
| White / Caucasian | 4,672 | 81.7% |
| Two or more Races | 216 | 3.8% |
| Some other Race | 0 | 0.0% |
| Total | 5,722 | 100.0% |
Ancestry in Covington city
The most populous ancestries reported in Covington city are American (741 | 13.0%), English (622 | 10.9%), Irish (530 | 9.3%), German (524 | 9.2%), and European (274 | 4.8%), together accounting for 47.0% of all Covington city residents.
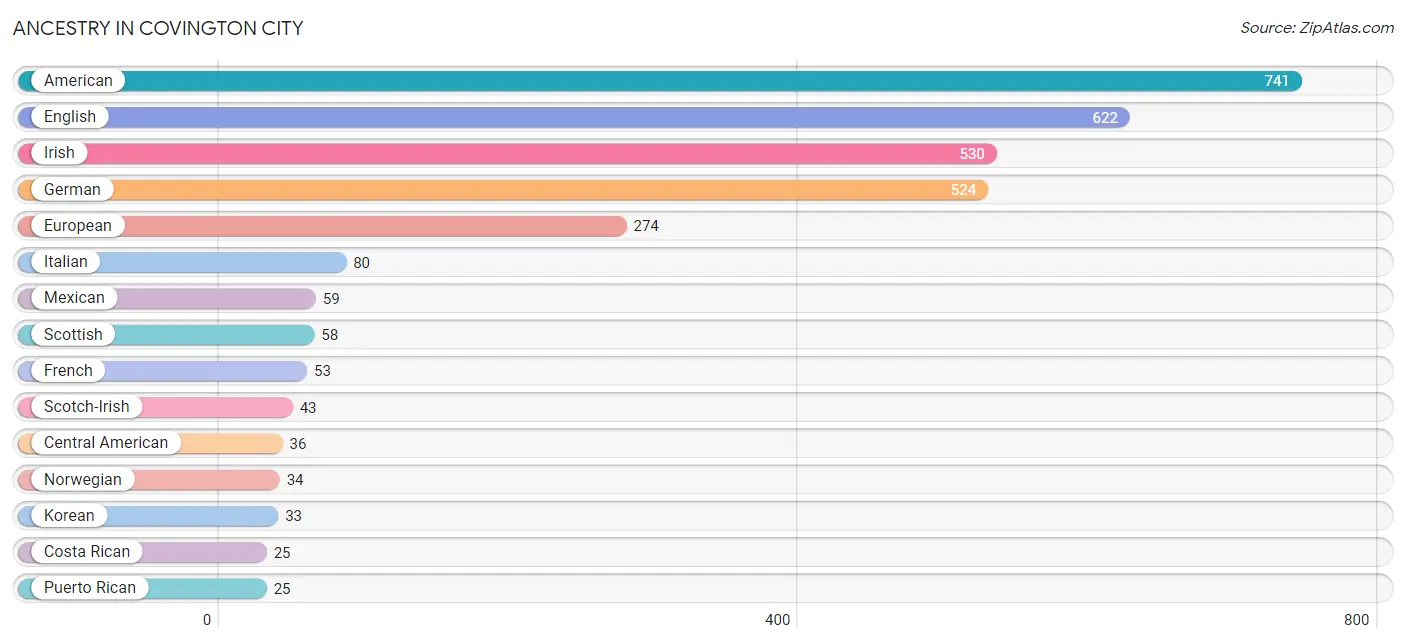
| Ancestry | # Population | % Population |
| American | 741 | 13.0% |
| British | 5 | 0.1% |
| Burmese | 22 | 0.4% |
| Central American | 36 | 0.6% |
| Cherokee | 17 | 0.3% |
| Costa Rican | 25 | 0.4% |
| Czech | 22 | 0.4% |
| Danish | 7 | 0.1% |
| Dutch | 9 | 0.2% |
| English | 622 | 10.9% |
| European | 274 | 4.8% |
| French | 53 | 0.9% |
| German | 524 | 9.2% |
| Guatemalan | 11 | 0.2% |
| Indian (Asian) | 17 | 0.3% |
| Irish | 530 | 9.3% |
| Italian | 80 | 1.4% |
| Korean | 33 | 0.6% |
| Mexican | 59 | 1.0% |
| Norwegian | 34 | 0.6% |
| Polish | 20 | 0.4% |
| Puerto Rican | 25 | 0.4% |
| Scotch-Irish | 43 | 0.7% |
| Scottish | 58 | 1.0% |
| Swiss | 14 | 0.2% | View All 25 Rows |
Immigrants in Covington city
The most numerous immigrant groups reported in Covington city came from Asia (52 | 0.9%), Philippines (33 | 0.6%), South Eastern Asia (33 | 0.6%), Eastern Asia (19 | 0.3%), and Korea (13 | 0.2%), together accounting for 2.6% of all Covington city residents.
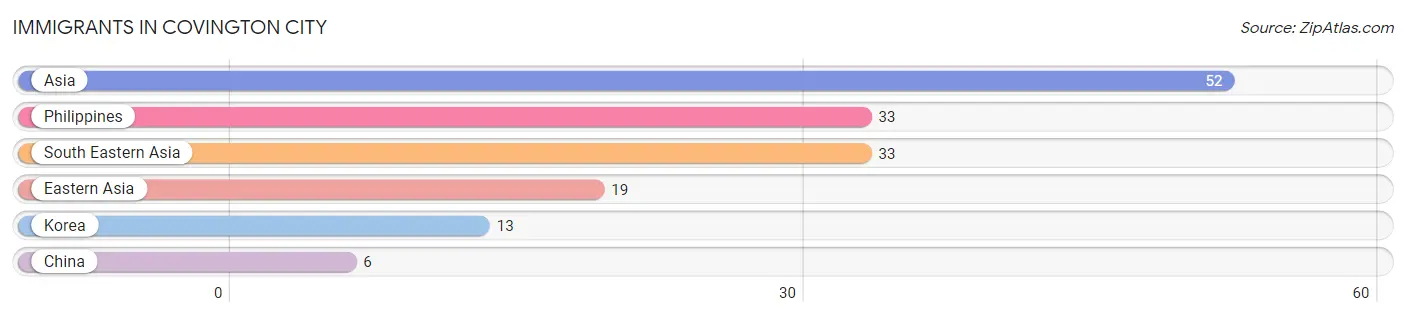
| Immigration Origin | # Population | % Population |
| Asia | 52 | 0.9% |
| China | 6 | 0.1% |
| Eastern Asia | 19 | 0.3% |
| Korea | 13 | 0.2% |
| Philippines | 33 | 0.6% |
| South Eastern Asia | 33 | 0.6% | View All 6 Rows |
Sex and Age in Covington city
Sex and Age in Covington city
The most populous age groups in Covington city are 60 to 64 Years (331 | 12.2%) for men and 60 to 64 Years (273 | 9.1%) for women.
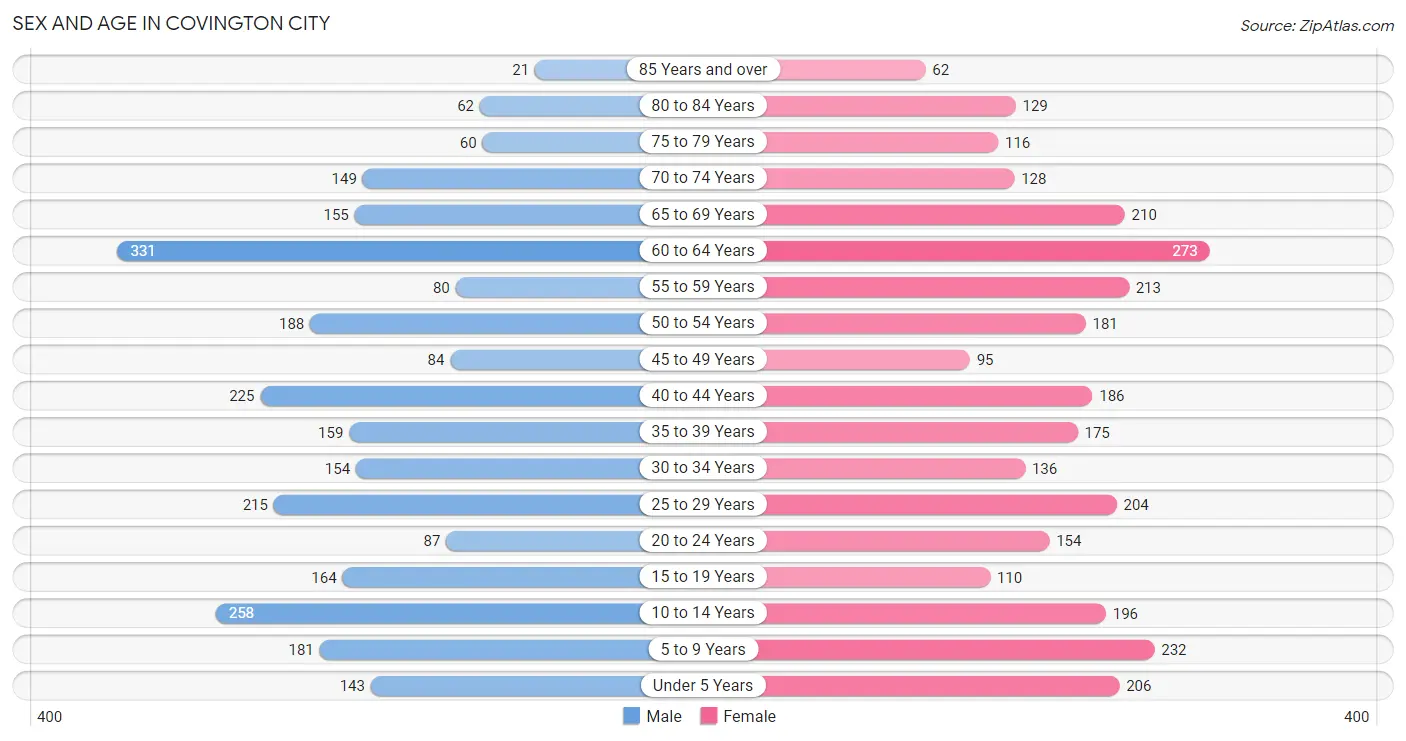
| Age Bracket | Male | Female |
| Under 5 Years | 143 (5.3%) | 206 (6.9%) |
| 5 to 9 Years | 181 (6.7%) | 232 (7.7%) |
| 10 to 14 Years | 258 (9.5%) | 196 (6.5%) |
| 15 to 19 Years | 164 (6.0%) | 110 (3.7%) |
| 20 to 24 Years | 87 (3.2%) | 154 (5.1%) |
| 25 to 29 Years | 215 (7.9%) | 204 (6.8%) |
| 30 to 34 Years | 154 (5.7%) | 136 (4.5%) |
| 35 to 39 Years | 159 (5.9%) | 175 (5.8%) |
| 40 to 44 Years | 225 (8.3%) | 186 (6.2%) |
| 45 to 49 Years | 84 (3.1%) | 95 (3.2%) |
| 50 to 54 Years | 188 (6.9%) | 181 (6.0%) |
| 55 to 59 Years | 80 (2.9%) | 213 (7.1%) |
| 60 to 64 Years | 331 (12.2%) | 273 (9.1%) |
| 65 to 69 Years | 155 (5.7%) | 210 (7.0%) |
| 70 to 74 Years | 149 (5.5%) | 128 (4.3%) |
| 75 to 79 Years | 60 (2.2%) | 116 (3.9%) |
| 80 to 84 Years | 62 (2.3%) | 129 (4.3%) |
| 85 Years and over | 21 (0.8%) | 62 (2.1%) |
| Total | 2,716 (100.0%) | 3,006 (100.0%) |
Families and Households in Covington city
Median Family Size in Covington city
The median family size in Covington city is 2.93 persons per family, with married-couple families (1,113 | 73.2%) accounting for the largest median family size of 3.11 persons per family. On the other hand, single male/father families (186 | 12.2%) represent the smallest median family size with 2.35 persons per family.
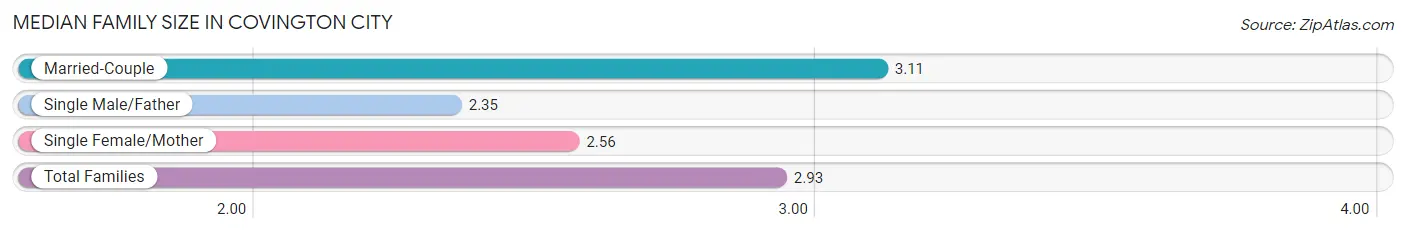
| Family Type | # Families | Family Size |
| Married-Couple | 1,113 (73.2%) | 3.11 |
| Single Male/Father | 186 (12.2%) | 2.35 |
| Single Female/Mother | 221 (14.5%) | 2.56 |
| Total Families | 1,520 (100.0%) | 2.93 |
Median Household Size in Covington city
The median household size in Covington city is 2.25 persons per household, with married-couple households (1,113 | 44.5%) accounting for the largest median household size of 3.12 persons per household. non-family households (983 | 39.3%) represent the smallest median household size with 1.10 persons per household.
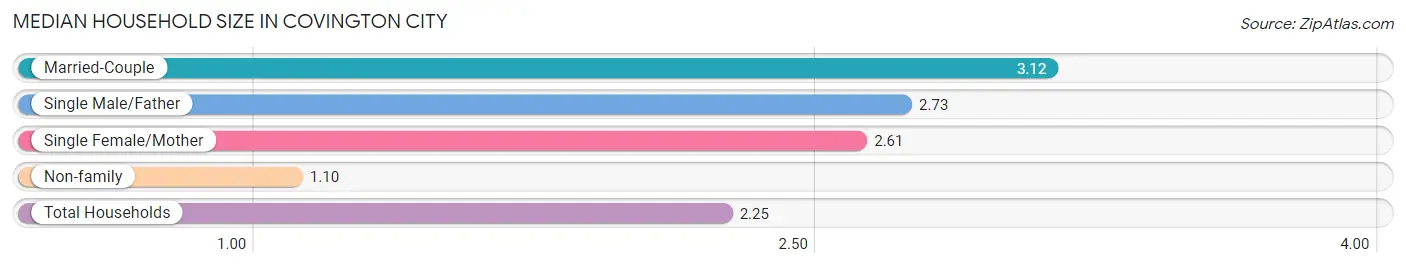
| Household Type | # Households | Household Size |
| Married-Couple | 1,113 (44.5%) | 3.12 |
| Single Male/Father | 186 (7.4%) | 2.73 |
| Single Female/Mother | 221 (8.8%) | 2.61 |
| Non-family | 983 (39.3%) | 1.10 |
| Total Households | 2,503 (100.0%) | 2.25 |
Household Size by Marriage Status in Covington city
Out of a total of 2,503 households in Covington city, 1,520 (60.7%) are family households, while 983 (39.3%) are nonfamily households. The most numerous type of family households are 2-person households, comprising 750, and the most common type of nonfamily households are 1-person households, comprising 897.
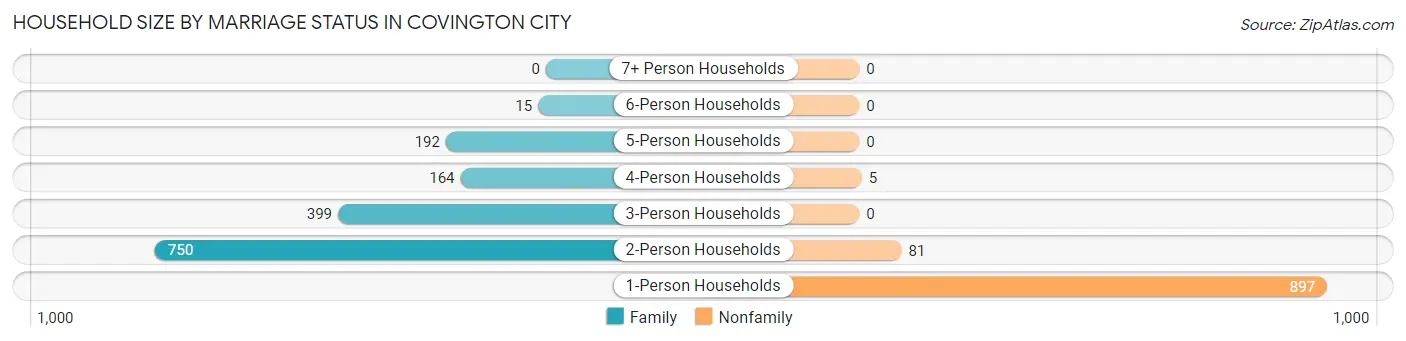
| Household Size | Family Households | Nonfamily Households |
| 1-Person Households | - | 897 (35.8%) |
| 2-Person Households | 750 (30.0%) | 81 (3.2%) |
| 3-Person Households | 399 (15.9%) | 0 (0.0%) |
| 4-Person Households | 164 (6.6%) | 5 (0.2%) |
| 5-Person Households | 192 (7.7%) | 0 (0.0%) |
| 6-Person Households | 15 (0.6%) | 0 (0.0%) |
| 7+ Person Households | 0 (0.0%) | 0 (0.0%) |
| Total | 1,520 (60.7%) | 983 (39.3%) |
Female Fertility in Covington city
Fertility by Age in Covington city
Average fertility rate in Covington city is 24.0 births per 1,000 women. Women in the age bracket of 15 to 19 years have the highest fertility rate with 173.0 births per 1,000 women. Women in the age bracket of 15 to 19 years acount for 70.4% of all women with births.
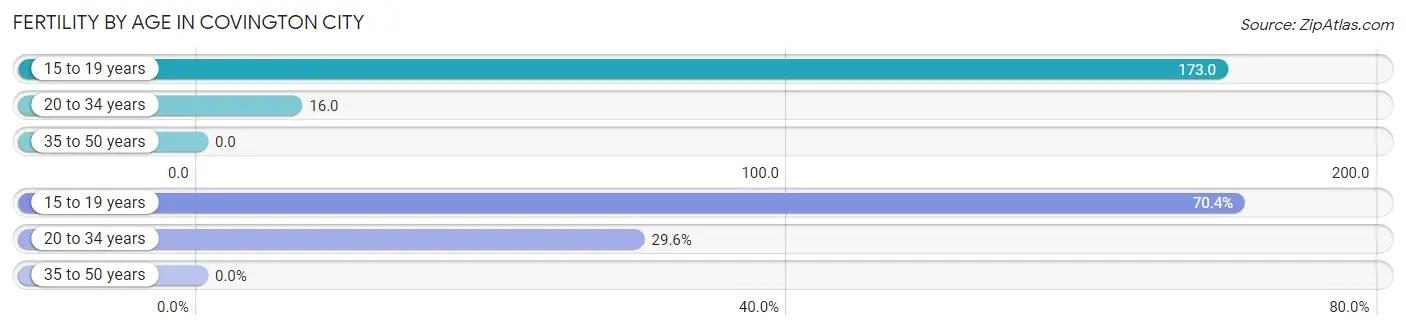
| Age Bracket | Women with Births | Births / 1,000 Women |
| 15 to 19 years | 19 (70.4%) | 173.0 |
| 20 to 34 years | 8 (29.6%) | 16.0 |
| 35 to 50 years | 0 (0.0%) | 0.0 |
| Total | 27 (100.0%) | 24.0 |
Fertility by Age by Marriage Status in Covington city
29.6% of women with births (27) in Covington city are married. The highest percentage of unmarried women with births falls into 15 to 19 years age bracket with 100.0% of them unmarried at the time of birth, while the lowest percentage of unmarried women with births belong to 20 to 34 years age bracket with 0.0% of them unmarried.
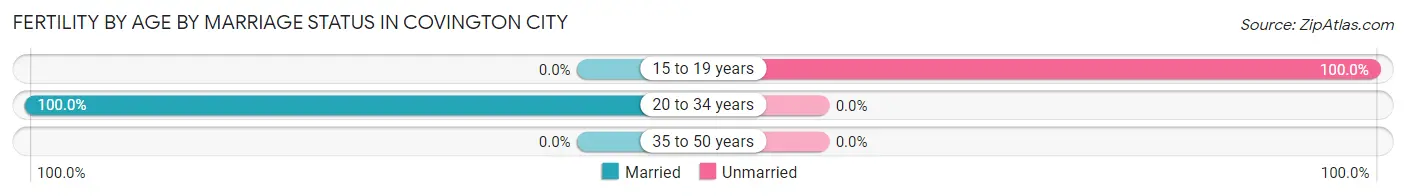
| Age Bracket | Married | Unmarried |
| 15 to 19 years | 0 (0.0%) | 19 (100.0%) |
| 20 to 34 years | 8 (100.0%) | 0 (0.0%) |
| 35 to 50 years | 0 (0.0%) | 0 (0.0%) |
| Total | 8 (29.6%) | 19 (70.4%) |
Fertility by Education in Covington city
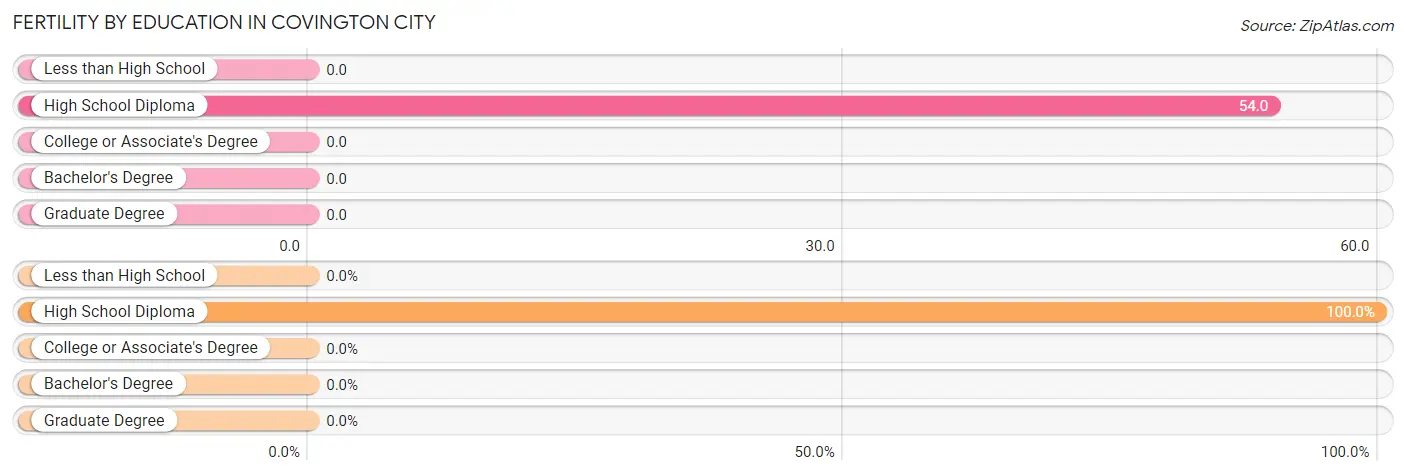
| Educational Attainment | Women with Births | Births / 1,000 Women |
| Less than High School | 0 (0.0%) | 0.0 |
| High School Diploma | 27 (100.0%) | 54.0 |
| College or Associate's Degree | 0 (0.0%) | 0.0 |
| Bachelor's Degree | 0 (0.0%) | 0.0 |
| Graduate Degree | 0 (0.0%) | 0.0 |
| Total | 27 (100.0%) | 24.0 |
Fertility by Education by Marriage Status in Covington city
70.4% of women with births in Covington city are unmarried. Women with the educational attainment of high school diploma are most likely to be married with 29.6% of them married at childbirth, while women with the educational attainment of high school diploma are least likely to be married with 70.4% of them unmarried at childbirth.
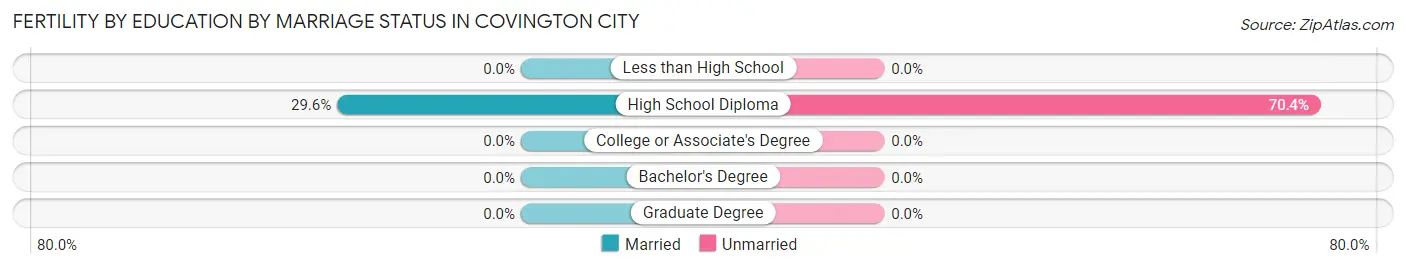
| Educational Attainment | Married | Unmarried |
| Less than High School | 0 (0.0%) | 0 (0.0%) |
| High School Diploma | 8 (29.6%) | 19 (70.4%) |
| College or Associate's Degree | 0 (0.0%) | 0 (0.0%) |
| Bachelor's Degree | 0 (0.0%) | 0 (0.0%) |
| Graduate Degree | 0 (0.0%) | 0 (0.0%) |
| Total | 8 (29.6%) | 19 (70.4%) |
Employment Characteristics in Covington city
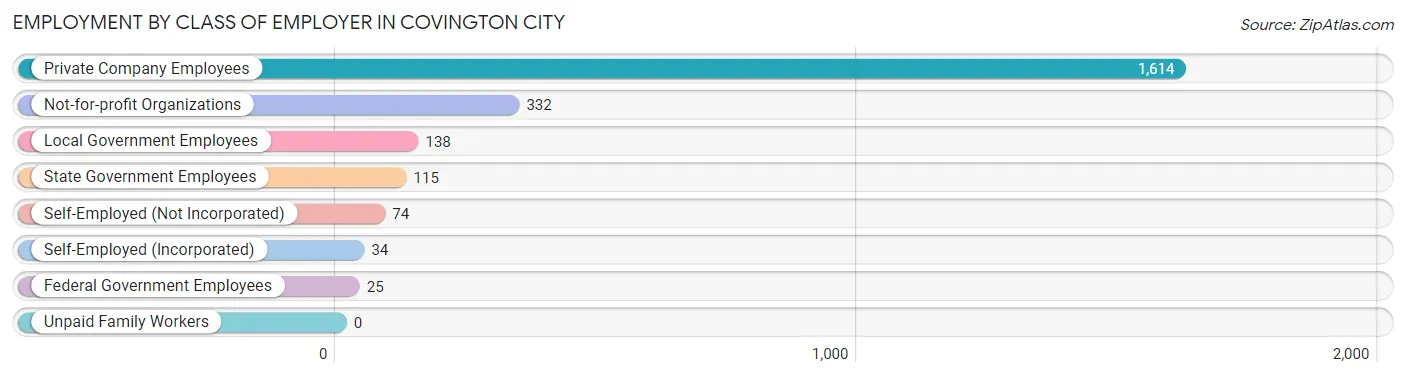
Employment by Class of Employer in Covington city
Among the 2,332 employed individuals in Covington city, private company employees (1,614 | 69.2%), not-for-profit organizations (332 | 14.2%), and local government employees (138 | 5.9%) make up the most common classes of employment.
| Employer Class | # Employees | % Employees |
| Private Company Employees | 1,614 | 69.2% |
| Self-Employed (Incorporated) | 34 | 1.5% |
| Self-Employed (Not Incorporated) | 74 | 3.2% |
| Not-for-profit Organizations | 332 | 14.2% |
| Local Government Employees | 138 | 5.9% |
| State Government Employees | 115 | 4.9% |
| Federal Government Employees | 25 | 1.1% |
| Unpaid Family Workers | 0 | 0.0% |
| Total | 2,332 | 100.0% |
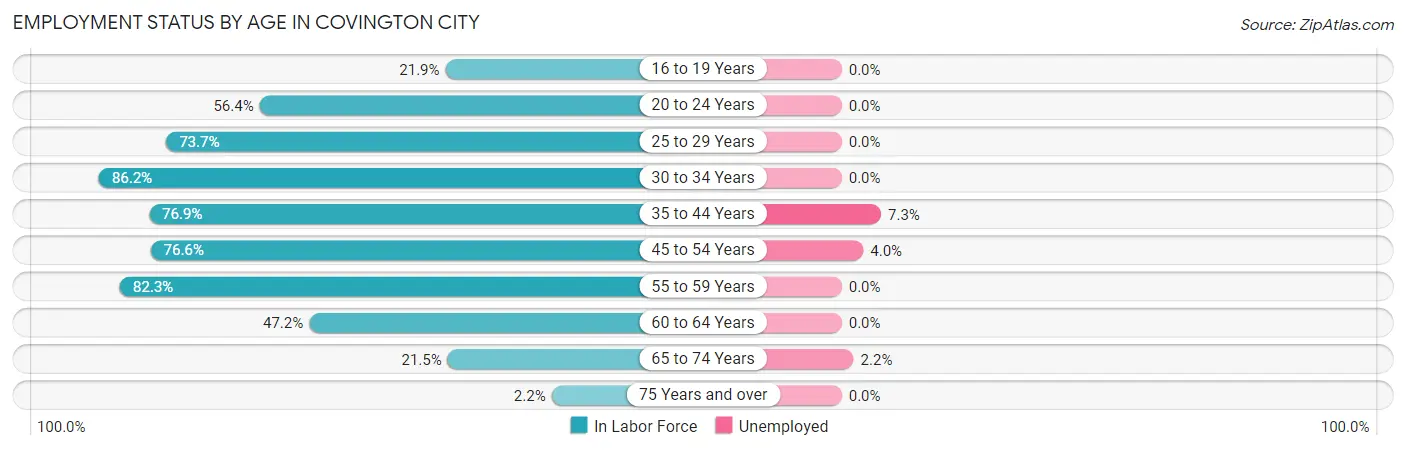
Employment Status by Age in Covington city
According to the labor force statistics for Covington city, out of the total population over 16 years of age (4,492), 53.9% or 2,421 individuals are in the labor force, with 2.6% or 63 of them unemployed. The age group with the highest labor force participation rate is 30 to 34 years, with 86.2% or 250 individuals in the labor force. Within the labor force, the 35 to 44 years age range has the highest percentage of unemployed individuals, with 7.3% or 42 of them being unemployed.
| Age Bracket | In Labor Force | Unemployed |
| 16 to 19 Years | 57 (21.9%) | 0 (0.0%) |
| 20 to 24 Years | 136 (56.4%) | 0 (0.0%) |
| 25 to 29 Years | 309 (73.7%) | 0 (0.0%) |
| 30 to 34 Years | 250 (86.2%) | 0 (0.0%) |
| 35 to 44 Years | 573 (76.9%) | 42 (7.3%) |
| 45 to 54 Years | 420 (76.6%) | 17 (4.0%) |
| 55 to 59 Years | 241 (82.3%) | 0 (0.0%) |
| 60 to 64 Years | 285 (47.2%) | 0 (0.0%) |
| 65 to 74 Years | 138 (21.5%) | 3 (2.2%) |
| 75 Years and over | 10 (2.2%) | 0 (0.0%) |
| Total | 2,421 (53.9%) | 63 (2.6%) |
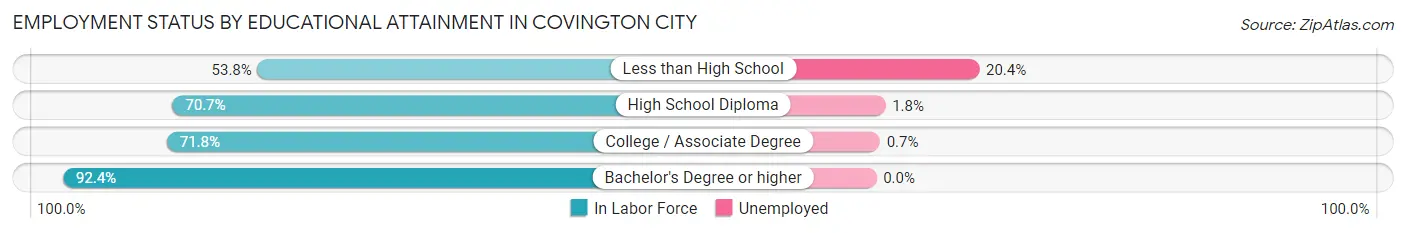
Employment Status by Educational Attainment in Covington city
According to labor force statistics for Covington city, 71.7% of individuals (2,079) out of the total population between 25 and 64 years of age (2,899) are in the labor force, with 2.8% or 58 of them being unemployed. The group with the highest labor force participation rate are those with the educational attainment of bachelor's degree or higher, with 92.4% or 330 individuals in the labor force. Within the labor force, individuals with less than high school education have the highest percentage of unemployment, with 20.4% or 38 of them being unemployed.
| Educational Attainment | In Labor Force | Unemployed |
| Less than High School | 186 (53.8%) | 71 (20.4%) |
| High School Diploma | 969 (70.7%) | 25 (1.8%) |
| College / Associate Degree | 593 (71.8%) | 6 (0.7%) |
| Bachelor's Degree or higher | 330 (92.4%) | 0 (0.0%) |
| Total | 2,079 (71.7%) | 81 (2.8%) |
Employment Occupations by Sex in Covington city
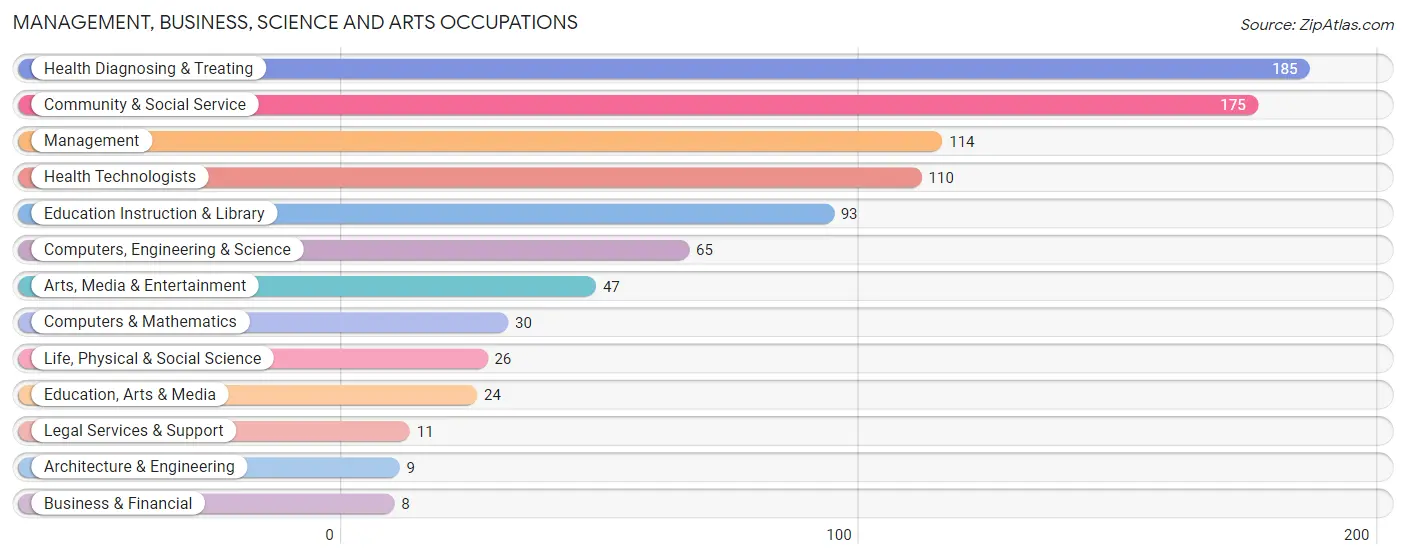
Management, Business, Science and Arts Occupations
The most common Management, Business, Science and Arts occupations in Covington city are Health Diagnosing & Treating (185 | 7.9%), Community & Social Service (175 | 7.4%), Management (114 | 4.8%), Health Technologists (110 | 4.7%), and Education Instruction & Library (93 | 4.0%).
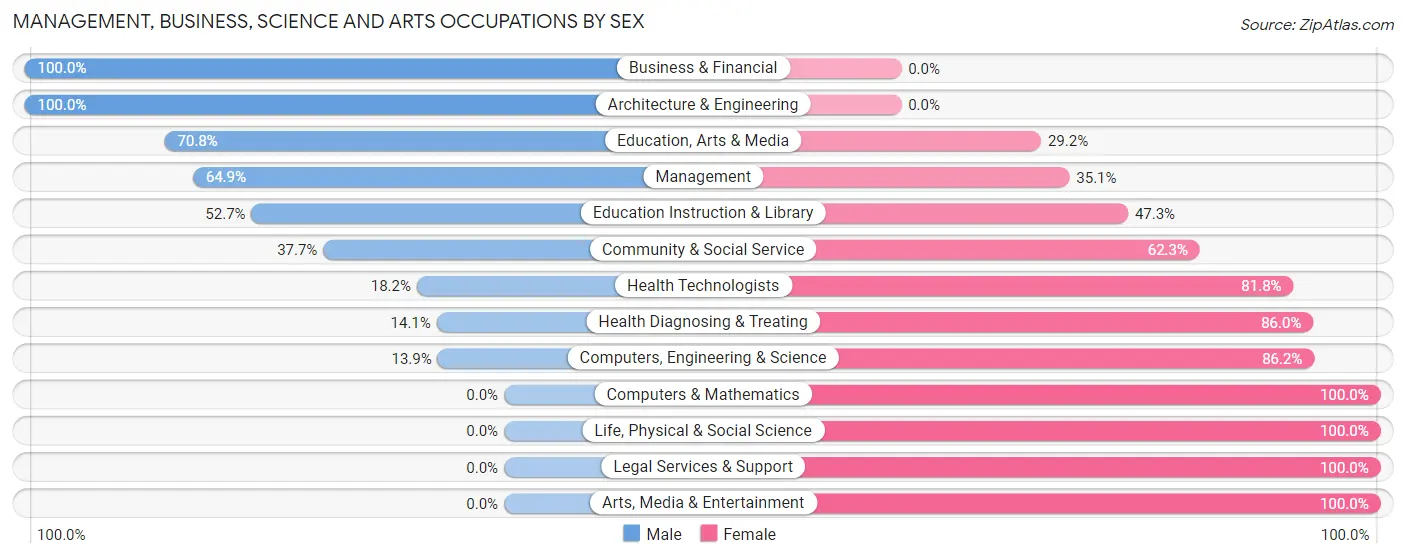
Management, Business, Science and Arts Occupations by Sex
Within the Management, Business, Science and Arts occupations in Covington city, the most male-oriented occupations are Business & Financial (100.0%), Architecture & Engineering (100.0%), and Education, Arts & Media (70.8%), while the most female-oriented occupations are Computers & Mathematics (100.0%), Life, Physical & Social Science (100.0%), and Legal Services & Support (100.0%).
| Occupation | Male | Female |
| Management | 74 (64.9%) | 40 (35.1%) |
| Business & Financial | 8 (100.0%) | 0 (0.0%) |
| Computers, Engineering & Science | 9 (13.9%) | 56 (86.2%) |
| Computers & Mathematics | 0 (0.0%) | 30 (100.0%) |
| Architecture & Engineering | 9 (100.0%) | 0 (0.0%) |
| Life, Physical & Social Science | 0 (0.0%) | 26 (100.0%) |
| Community & Social Service | 66 (37.7%) | 109 (62.3%) |
| Education, Arts & Media | 17 (70.8%) | 7 (29.2%) |
| Legal Services & Support | 0 (0.0%) | 11 (100.0%) |
| Education Instruction & Library | 49 (52.7%) | 44 (47.3%) |
| Arts, Media & Entertainment | 0 (0.0%) | 47 (100.0%) |
| Health Diagnosing & Treating | 26 (14.1%) | 159 (86.0%) |
| Health Technologists | 20 (18.2%) | 90 (81.8%) |
| Total (Category) | 183 (33.5%) | 364 (66.5%) |
| Total (Overall) | 1,138 (48.3%) | 1,219 (51.7%) |
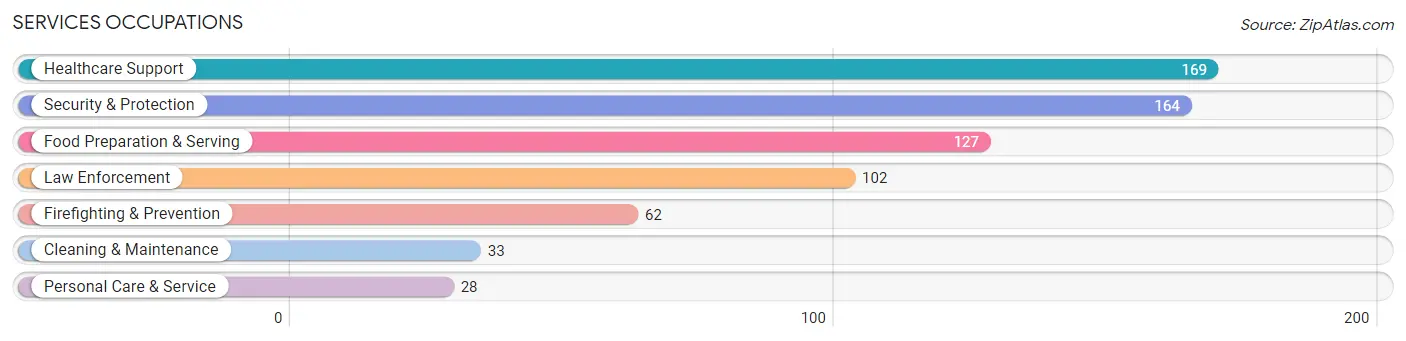
Services Occupations
The most common Services occupations in Covington city are Healthcare Support (169 | 7.2%), Security & Protection (164 | 7.0%), Food Preparation & Serving (127 | 5.4%), Law Enforcement (102 | 4.3%), and Firefighting & Prevention (62 | 2.6%).
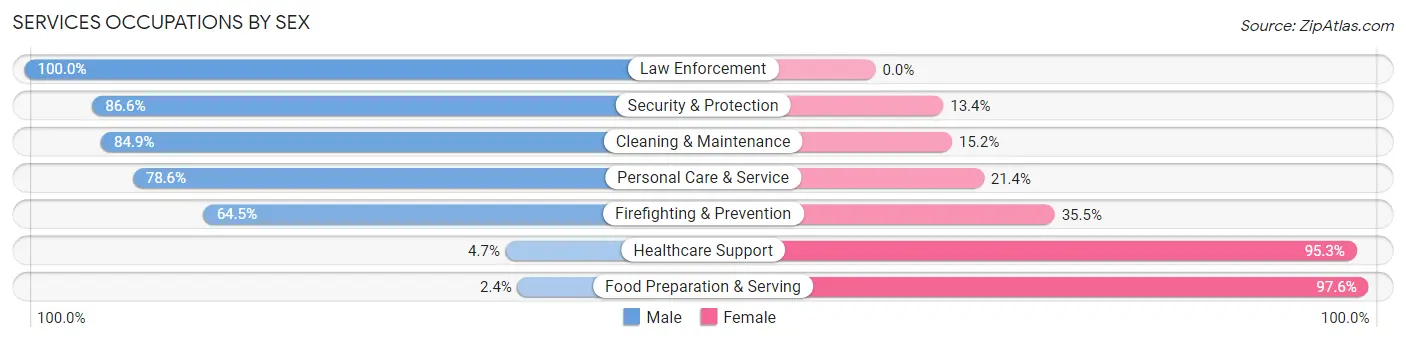
Services Occupations by Sex
Within the Services occupations in Covington city, the most male-oriented occupations are Law Enforcement (100.0%), Security & Protection (86.6%), and Cleaning & Maintenance (84.9%), while the most female-oriented occupations are Food Preparation & Serving (97.6%), Healthcare Support (95.3%), and Firefighting & Prevention (35.5%).
| Occupation | Male | Female |
| Healthcare Support | 8 (4.7%) | 161 (95.3%) |
| Security & Protection | 142 (86.6%) | 22 (13.4%) |
| Firefighting & Prevention | 40 (64.5%) | 22 (35.5%) |
| Law Enforcement | 102 (100.0%) | 0 (0.0%) |
| Food Preparation & Serving | 3 (2.4%) | 124 (97.6%) |
| Cleaning & Maintenance | 28 (84.9%) | 5 (15.1%) |
| Personal Care & Service | 22 (78.6%) | 6 (21.4%) |
| Total (Category) | 203 (39.0%) | 318 (61.0%) |
| Total (Overall) | 1,138 (48.3%) | 1,219 (51.7%) |
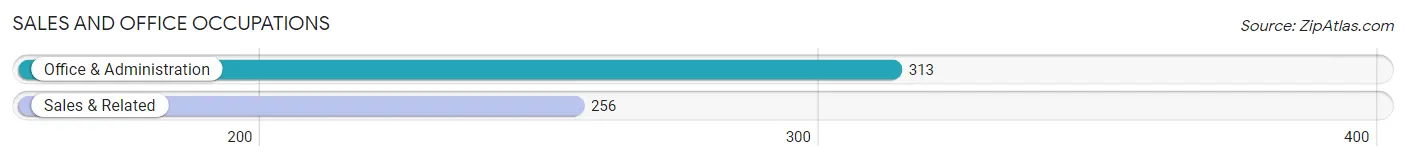
Sales and Office Occupations
The most common Sales and Office occupations in Covington city are Office & Administration (313 | 13.3%), and Sales & Related (256 | 10.9%).
Sales and Office Occupations by Sex
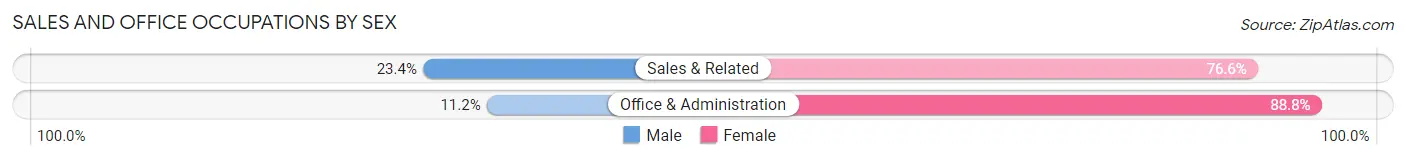
| Occupation | Male | Female |
| Sales & Related | 60 (23.4%) | 196 (76.6%) |
| Office & Administration | 35 (11.2%) | 278 (88.8%) |
| Total (Category) | 95 (16.7%) | 474 (83.3%) |
| Total (Overall) | 1,138 (48.3%) | 1,219 (51.7%) |
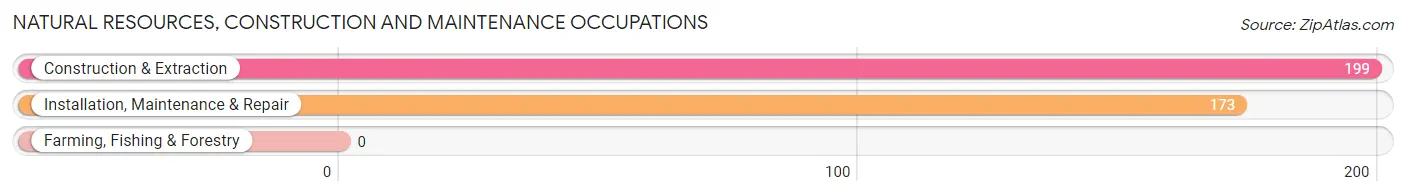
Natural Resources, Construction and Maintenance Occupations
The most common Natural Resources, Construction and Maintenance occupations in Covington city are Construction & Extraction (199 | 8.4%), and Installation, Maintenance & Repair (173 | 7.3%).
Natural Resources, Construction and Maintenance Occupations by Sex
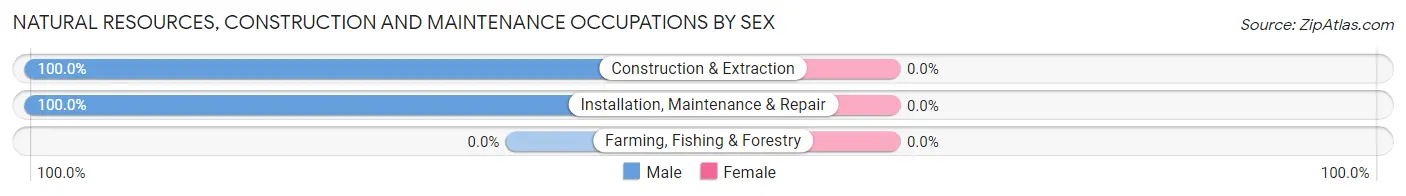
| Occupation | Male | Female |
| Farming, Fishing & Forestry | 0 (0.0%) | 0 (0.0%) |
| Construction & Extraction | 199 (100.0%) | 0 (0.0%) |
| Installation, Maintenance & Repair | 173 (100.0%) | 0 (0.0%) |
| Total (Category) | 372 (100.0%) | 0 (0.0%) |
| Total (Overall) | 1,138 (48.3%) | 1,219 (51.7%) |
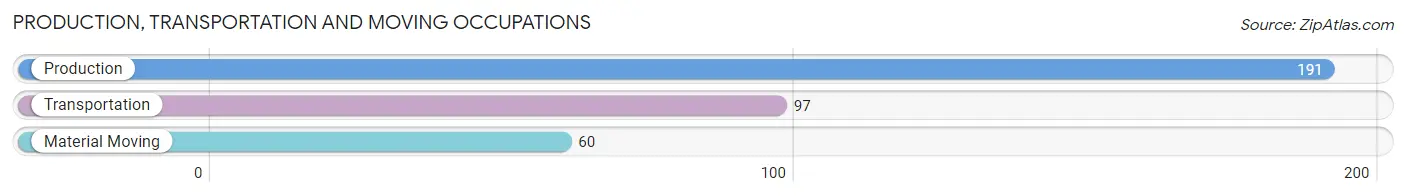
Production, Transportation and Moving Occupations
The most common Production, Transportation and Moving occupations in Covington city are Production (191 | 8.1%), Transportation (97 | 4.1%), and Material Moving (60 | 2.5%).
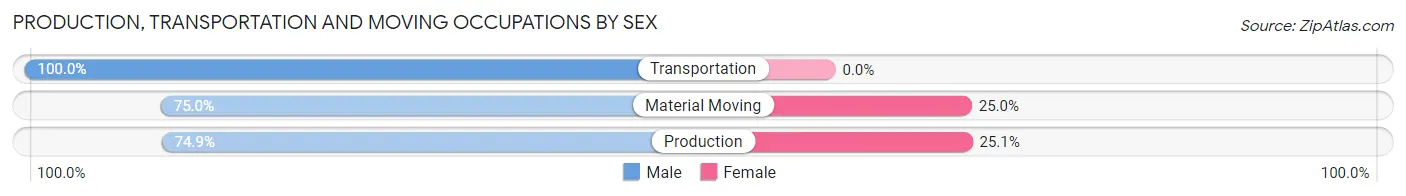
Production, Transportation and Moving Occupations by Sex
| Occupation | Male | Female |
| Production | 143 (74.9%) | 48 (25.1%) |
| Transportation | 97 (100.0%) | 0 (0.0%) |
| Material Moving | 45 (75.0%) | 15 (25.0%) |
| Total (Category) | 285 (81.9%) | 63 (18.1%) |
| Total (Overall) | 1,138 (48.3%) | 1,219 (51.7%) |
Employment Industries by Sex in Covington city
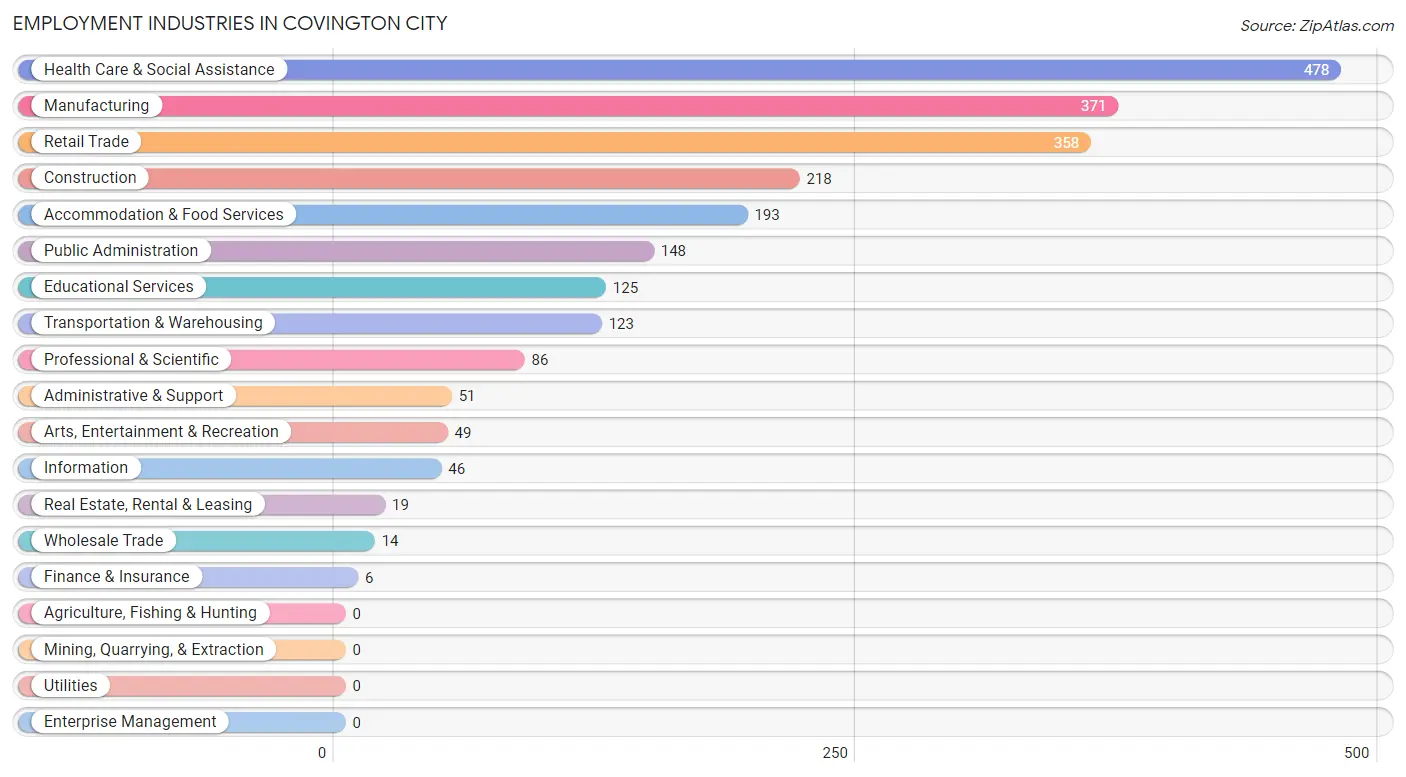
Employment Industries in Covington city
The major employment industries in Covington city include Health Care & Social Assistance (478 | 20.3%), Manufacturing (371 | 15.7%), Retail Trade (358 | 15.2%), Construction (218 | 9.2%), and Accommodation & Food Services (193 | 8.2%).
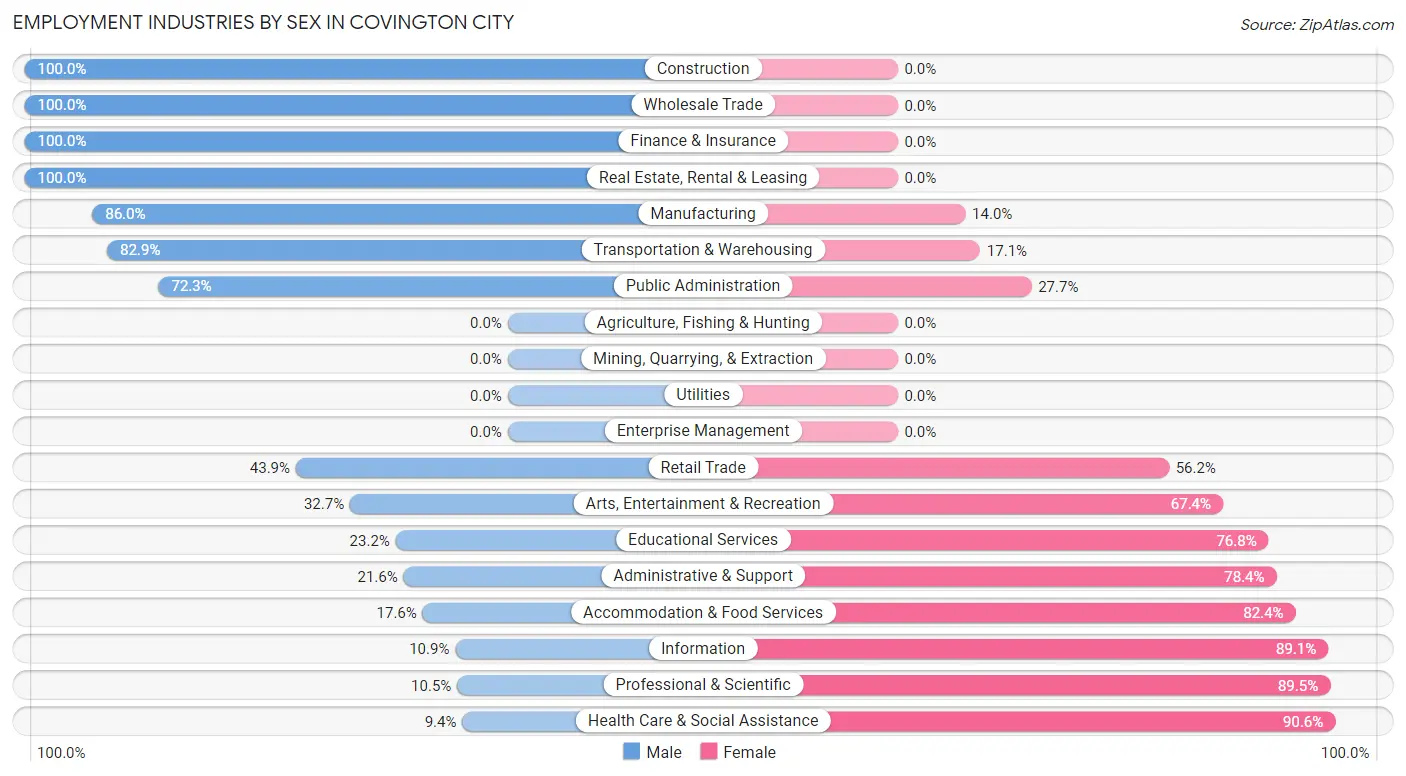
Employment Industries by Sex in Covington city
The Covington city industries that see more men than women are Construction (100.0%), Wholesale Trade (100.0%), and Finance & Insurance (100.0%), whereas the industries that tend to have a higher number of women are Health Care & Social Assistance (90.6%), Professional & Scientific (89.5%), and Information (89.1%).
| Industry | Male | Female |
| Agriculture, Fishing & Hunting | 0 (0.0%) | 0 (0.0%) |
| Mining, Quarrying, & Extraction | 0 (0.0%) | 0 (0.0%) |
| Construction | 218 (100.0%) | 0 (0.0%) |
| Manufacturing | 319 (86.0%) | 52 (14.0%) |
| Wholesale Trade | 14 (100.0%) | 0 (0.0%) |
| Retail Trade | 157 (43.9%) | 201 (56.1%) |
| Transportation & Warehousing | 102 (82.9%) | 21 (17.1%) |
| Utilities | 0 (0.0%) | 0 (0.0%) |
| Information | 5 (10.9%) | 41 (89.1%) |
| Finance & Insurance | 6 (100.0%) | 0 (0.0%) |
| Real Estate, Rental & Leasing | 19 (100.0%) | 0 (0.0%) |
| Professional & Scientific | 9 (10.5%) | 77 (89.5%) |
| Enterprise Management | 0 (0.0%) | 0 (0.0%) |
| Administrative & Support | 11 (21.6%) | 40 (78.4%) |
| Educational Services | 29 (23.2%) | 96 (76.8%) |
| Health Care & Social Assistance | 45 (9.4%) | 433 (90.6%) |
| Arts, Entertainment & Recreation | 16 (32.7%) | 33 (67.3%) |
| Accommodation & Food Services | 34 (17.6%) | 159 (82.4%) |
| Public Administration | 107 (72.3%) | 41 (27.7%) |
| Total | 1,138 (48.3%) | 1,219 (51.7%) |
Education in Covington city
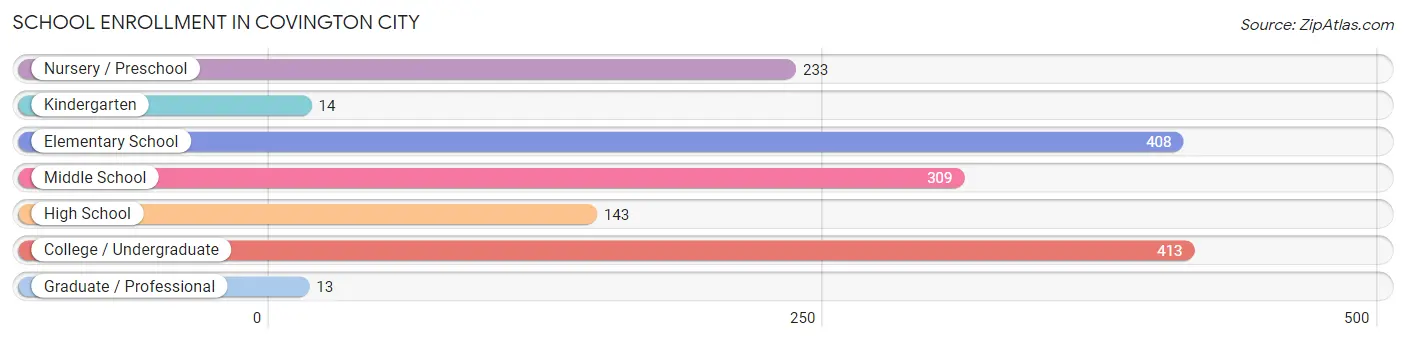
School Enrollment in Covington city
The most common levels of schooling among the 1,533 students in Covington city are college / undergraduate (413 | 26.9%), elementary school (408 | 26.6%), and middle school (309 | 20.2%).
| School Level | # Students | % Students |
| Nursery / Preschool | 233 | 15.2% |
| Kindergarten | 14 | 0.9% |
| Elementary School | 408 | 26.6% |
| Middle School | 309 | 20.2% |
| High School | 143 | 9.3% |
| College / Undergraduate | 413 | 26.9% |
| Graduate / Professional | 13 | 0.9% |
| Total | 1,533 | 100.0% |
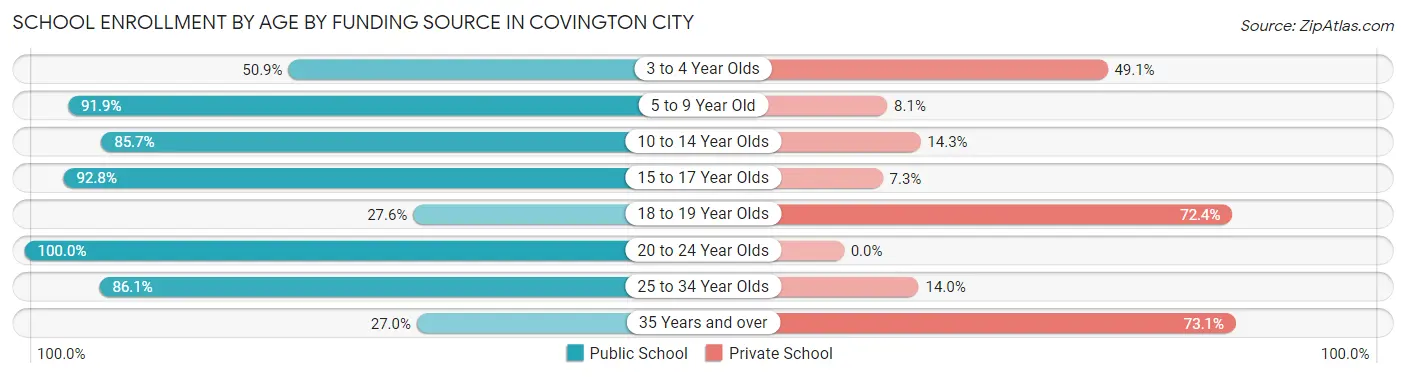
School Enrollment by Age by Funding Source in Covington city
Out of a total of 1,533 students who are enrolled in schools in Covington city, 443 (28.9%) attend a private institution, while the remaining 1,090 (71.1%) are enrolled in public schools. The age group of 35 years and over has the highest likelihood of being enrolled in private schools, with 122 (73.1% in the age bracket) enrolled. Conversely, the age group of 20 to 24 year olds has the lowest likelihood of being enrolled in a private school, with 71 (100.0% in the age bracket) attending a public institution.
| Age Bracket | Public School | Private School |
| 3 to 4 Year Olds | 88 (50.9%) | 85 (49.1%) |
| 5 to 9 Year Old | 363 (91.9%) | 32 (8.1%) |
| 10 to 14 Year Olds | 372 (85.7%) | 62 (14.3%) |
| 15 to 17 Year Olds | 64 (92.7%) | 5 (7.2%) |
| 18 to 19 Year Olds | 50 (27.6%) | 131 (72.4%) |
| 20 to 24 Year Olds | 71 (100.0%) | 0 (0.0%) |
| 25 to 34 Year Olds | 37 (86.1%) | 6 (14.0%) |
| 35 Years and over | 45 (27.0%) | 122 (73.1%) |
| Total | 1,090 (71.1%) | 443 (28.9%) |
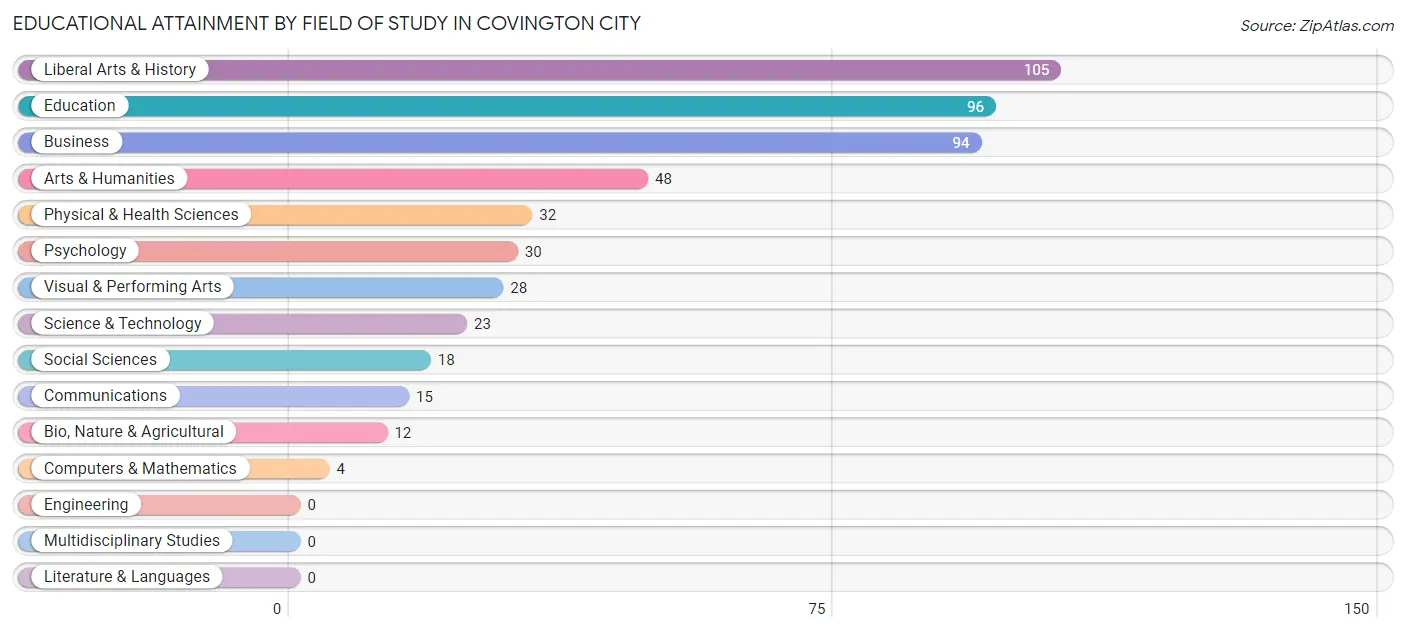
Educational Attainment by Field of Study in Covington city
Liberal arts & history (105 | 20.8%), education (96 | 19.0%), business (94 | 18.6%), arts & humanities (48 | 9.5%), and physical & health sciences (32 | 6.3%) are the most common fields of study among 505 individuals in Covington city who have obtained a bachelor's degree or higher.
| Field of Study | # Graduates | % Graduates |
| Computers & Mathematics | 4 | 0.8% |
| Bio, Nature & Agricultural | 12 | 2.4% |
| Physical & Health Sciences | 32 | 6.3% |
| Psychology | 30 | 5.9% |
| Social Sciences | 18 | 3.6% |
| Engineering | 0 | 0.0% |
| Multidisciplinary Studies | 0 | 0.0% |
| Science & Technology | 23 | 4.5% |
| Business | 94 | 18.6% |
| Education | 96 | 19.0% |
| Literature & Languages | 0 | 0.0% |
| Liberal Arts & History | 105 | 20.8% |
| Visual & Performing Arts | 28 | 5.5% |
| Communications | 15 | 3.0% |
| Arts & Humanities | 48 | 9.5% |
| Total | 505 | 100.0% |
Transportation & Commute in Covington city
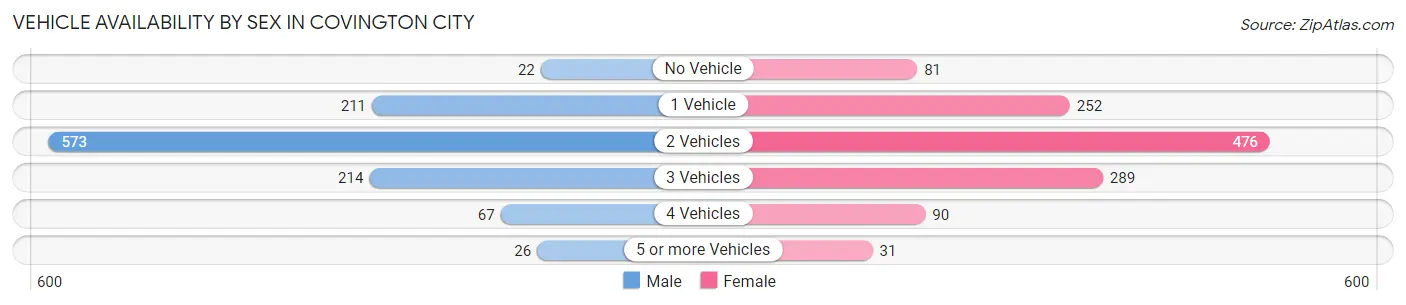
Vehicle Availability by Sex in Covington city
The most prevalent vehicle ownership categories in Covington city are males with 2 vehicles (573, accounting for 51.5%) and females with 2 vehicles (476, making up 47.0%).
| Vehicles Available | Male | Female |
| No Vehicle | 22 (2.0%) | 81 (6.6%) |
| 1 Vehicle | 211 (19.0%) | 252 (20.7%) |
| 2 Vehicles | 573 (51.5%) | 476 (39.1%) |
| 3 Vehicles | 214 (19.2%) | 289 (23.7%) |
| 4 Vehicles | 67 (6.0%) | 90 (7.4%) |
| 5 or more Vehicles | 26 (2.3%) | 31 (2.5%) |
| Total | 1,113 (100.0%) | 1,219 (100.0%) |
Commute Time in Covington city
The most frequently occuring commute durations in Covington city are 10 to 14 minutes (585 commuters, 26.1%), 5 to 9 minutes (519 commuters, 23.1%), and 15 to 19 minutes (258 commuters, 11.5%).
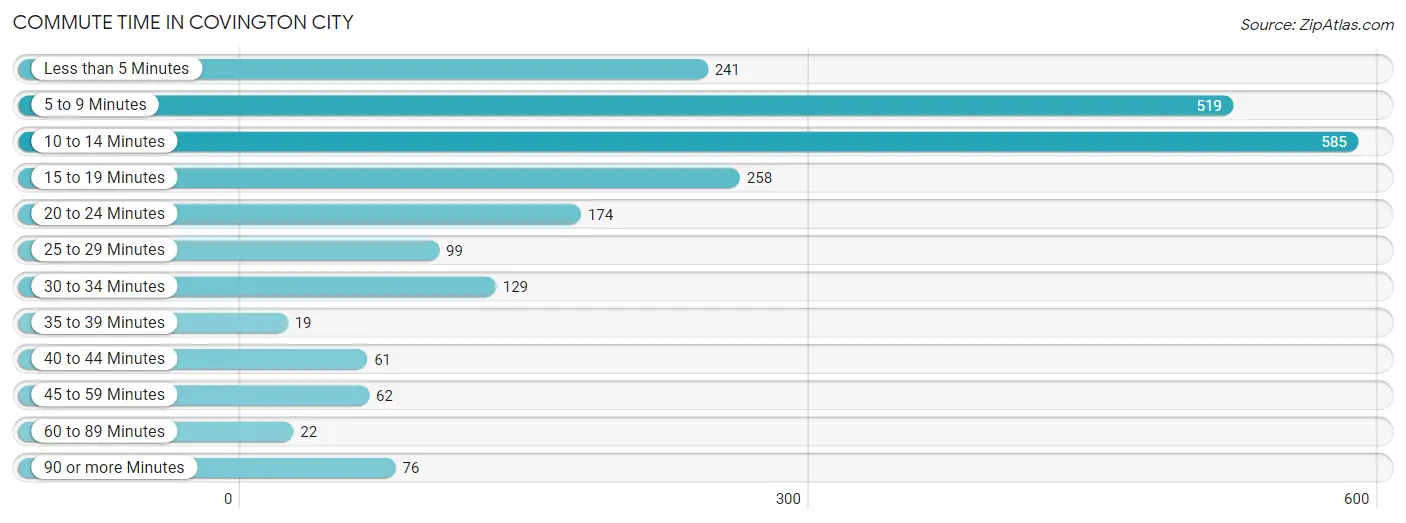
| Commute Time | # Commuters | % Commuters |
| Less than 5 Minutes | 241 | 10.7% |
| 5 to 9 Minutes | 519 | 23.1% |
| 10 to 14 Minutes | 585 | 26.1% |
| 15 to 19 Minutes | 258 | 11.5% |
| 20 to 24 Minutes | 174 | 7.7% |
| 25 to 29 Minutes | 99 | 4.4% |
| 30 to 34 Minutes | 129 | 5.8% |
| 35 to 39 Minutes | 19 | 0.9% |
| 40 to 44 Minutes | 61 | 2.7% |
| 45 to 59 Minutes | 62 | 2.8% |
| 60 to 89 Minutes | 22 | 1.0% |
| 90 or more Minutes | 76 | 3.4% |
Commute Time by Sex in Covington city
The most common commute times in Covington city are 10 to 14 minutes (323 commuters, 29.4%) for males and 5 to 9 minutes (325 commuters, 28.4%) for females.
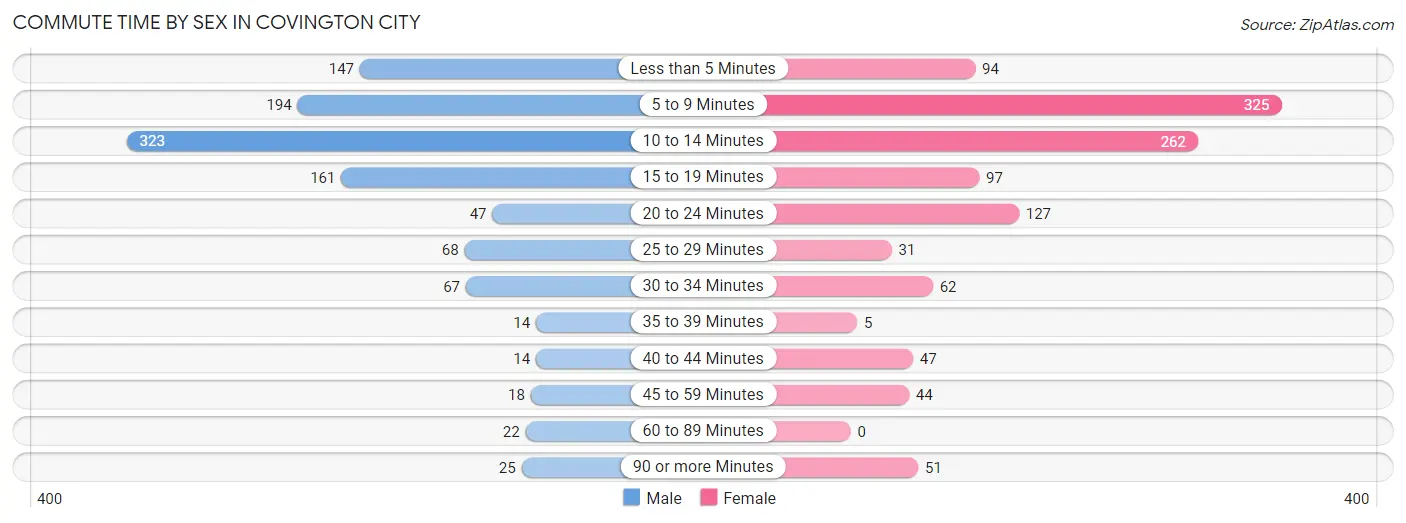
| Commute Time | Male | Female |
| Less than 5 Minutes | 147 (13.4%) | 94 (8.2%) |
| 5 to 9 Minutes | 194 (17.6%) | 325 (28.4%) |
| 10 to 14 Minutes | 323 (29.4%) | 262 (22.9%) |
| 15 to 19 Minutes | 161 (14.6%) | 97 (8.5%) |
| 20 to 24 Minutes | 47 (4.3%) | 127 (11.1%) |
| 25 to 29 Minutes | 68 (6.2%) | 31 (2.7%) |
| 30 to 34 Minutes | 67 (6.1%) | 62 (5.4%) |
| 35 to 39 Minutes | 14 (1.3%) | 5 (0.4%) |
| 40 to 44 Minutes | 14 (1.3%) | 47 (4.1%) |
| 45 to 59 Minutes | 18 (1.6%) | 44 (3.8%) |
| 60 to 89 Minutes | 22 (2.0%) | 0 (0.0%) |
| 90 or more Minutes | 25 (2.3%) | 51 (4.4%) |
Time of Departure to Work by Sex in Covington city
The most frequent times of departure to work in Covington city are 5:00 AM to 5:29 AM (203, 18.4%) for males and 8:00 AM to 8:29 AM (314, 27.4%) for females.
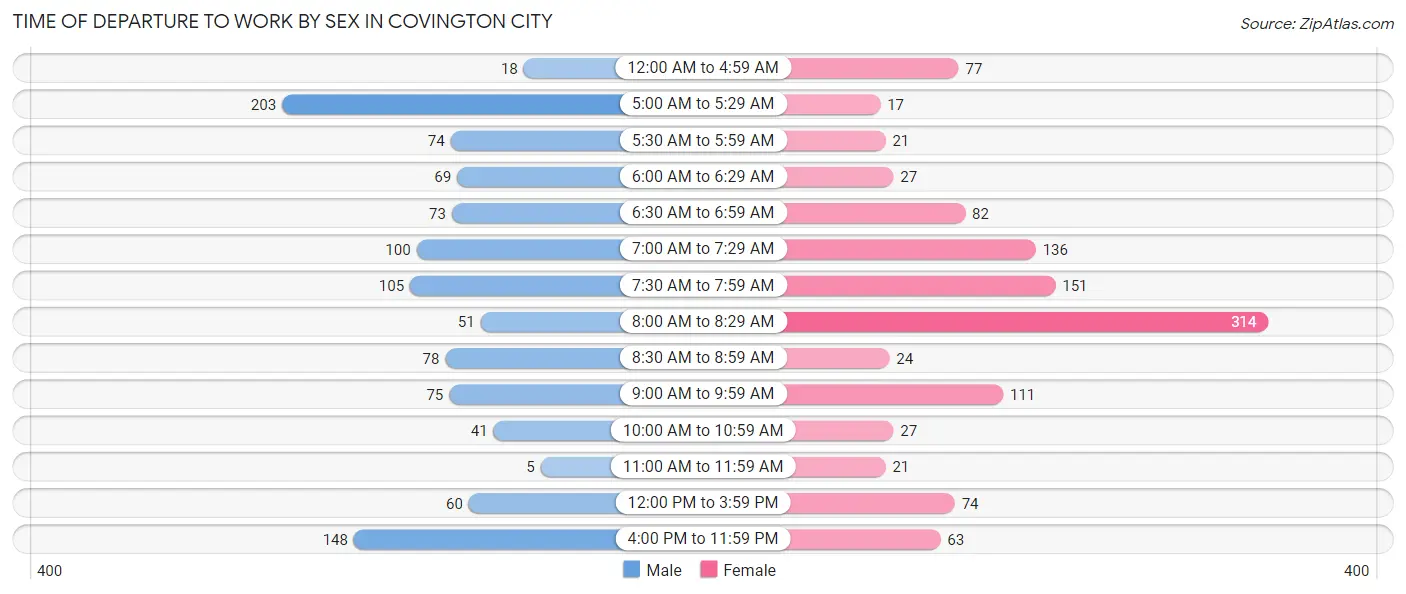
| Time of Departure | Male | Female |
| 12:00 AM to 4:59 AM | 18 (1.6%) | 77 (6.7%) |
| 5:00 AM to 5:29 AM | 203 (18.4%) | 17 (1.5%) |
| 5:30 AM to 5:59 AM | 74 (6.7%) | 21 (1.8%) |
| 6:00 AM to 6:29 AM | 69 (6.3%) | 27 (2.4%) |
| 6:30 AM to 6:59 AM | 73 (6.6%) | 82 (7.2%) |
| 7:00 AM to 7:29 AM | 100 (9.1%) | 136 (11.9%) |
| 7:30 AM to 7:59 AM | 105 (9.6%) | 151 (13.2%) |
| 8:00 AM to 8:29 AM | 51 (4.6%) | 314 (27.4%) |
| 8:30 AM to 8:59 AM | 78 (7.1%) | 24 (2.1%) |
| 9:00 AM to 9:59 AM | 75 (6.8%) | 111 (9.7%) |
| 10:00 AM to 10:59 AM | 41 (3.7%) | 27 (2.4%) |
| 11:00 AM to 11:59 AM | 5 (0.4%) | 21 (1.8%) |
| 12:00 PM to 3:59 PM | 60 (5.4%) | 74 (6.5%) |
| 4:00 PM to 11:59 PM | 148 (13.5%) | 63 (5.5%) |
| Total | 1,100 (100.0%) | 1,145 (100.0%) |
Housing Occupancy in Covington city
Occupancy by Ownership in Covington city
Of the total 2,503 dwellings in Covington city, owner-occupied units account for 1,883 (75.2%), while renter-occupied units make up 620 (24.8%).
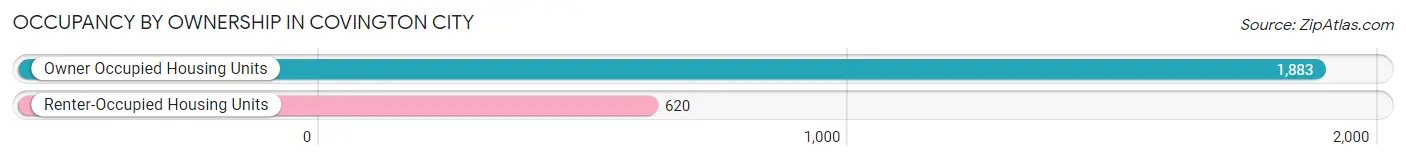
| Occupancy | # Housing Units | % Housing Units |
| Owner Occupied Housing Units | 1,883 | 75.2% |
| Renter-Occupied Housing Units | 620 | 24.8% |
| Total Occupied Housing Units | 2,503 | 100.0% |
Occupancy by Household Size in Covington city
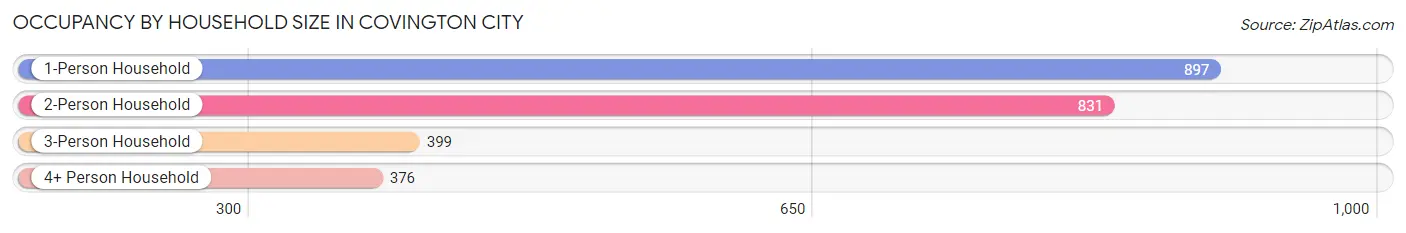
| Household Size | # Housing Units | % Housing Units |
| 1-Person Household | 897 | 35.8% |
| 2-Person Household | 831 | 33.2% |
| 3-Person Household | 399 | 15.9% |
| 4+ Person Household | 376 | 15.0% |
| Total Housing Units | 2,503 | 100.0% |
Occupancy by Ownership by Household Size in Covington city
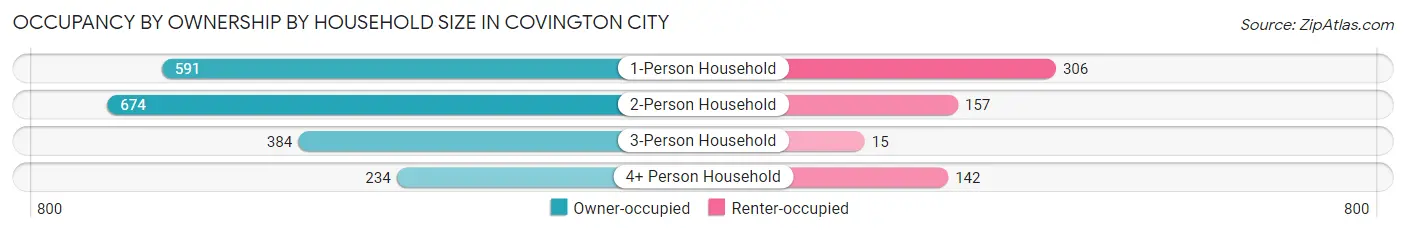
| Household Size | Owner-occupied | Renter-occupied |
| 1-Person Household | 591 (65.9%) | 306 (34.1%) |
| 2-Person Household | 674 (81.1%) | 157 (18.9%) |
| 3-Person Household | 384 (96.2%) | 15 (3.8%) |
| 4+ Person Household | 234 (62.2%) | 142 (37.8%) |
| Total Housing Units | 1,883 (75.2%) | 620 (24.8%) |
Occupancy by Educational Attainment in Covington city
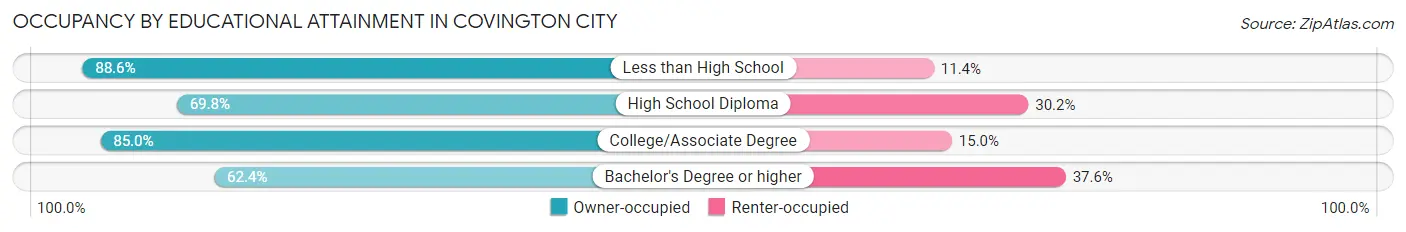
| Household Size | Owner-occupied | Renter-occupied |
| Less than High School | 240 (88.6%) | 31 (11.4%) |
| High School Diploma | 836 (69.8%) | 361 (30.2%) |
| College/Associate Degree | 606 (85.0%) | 107 (15.0%) |
| Bachelor's Degree or higher | 201 (62.4%) | 121 (37.6%) |
Occupancy by Age of Householder in Covington city
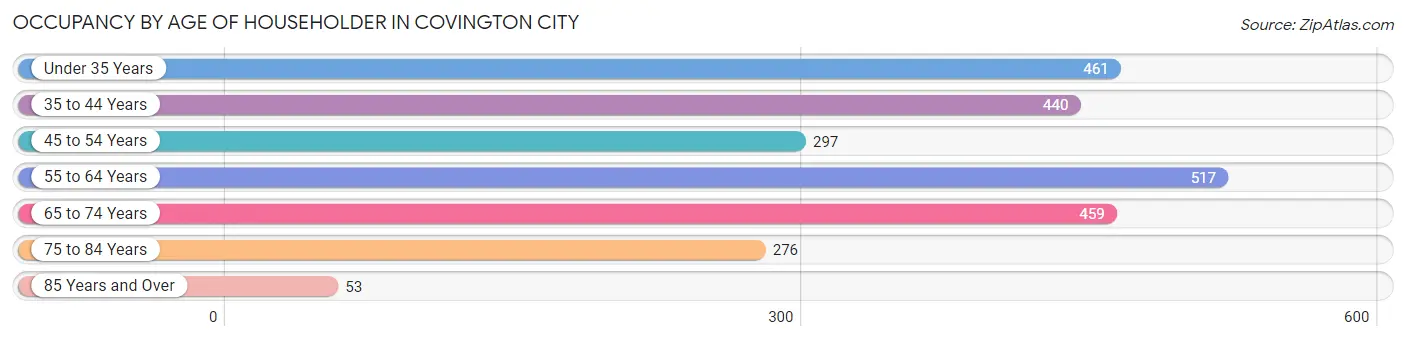
| Age Bracket | # Households | % Households |
| Under 35 Years | 461 | 18.4% |
| 35 to 44 Years | 440 | 17.6% |
| 45 to 54 Years | 297 | 11.9% |
| 55 to 64 Years | 517 | 20.7% |
| 65 to 74 Years | 459 | 18.3% |
| 75 to 84 Years | 276 | 11.0% |
| 85 Years and Over | 53 | 2.1% |
| Total | 2,503 | 100.0% |
Housing Finances in Covington city
Median Income by Occupancy in Covington city
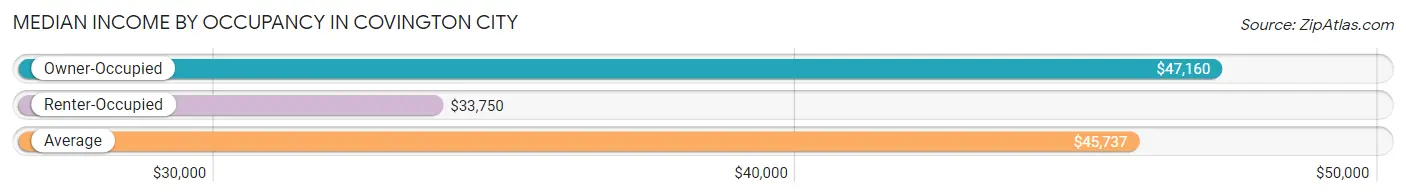
| Occupancy Type | # Households | Median Income |
| Owner-Occupied | 1,883 (75.2%) | $47,160 |
| Renter-Occupied | 620 (24.8%) | $33,750 |
| Average | 2,503 (100.0%) | $45,737 |
Occupancy by Householder Income Bracket in Covington city
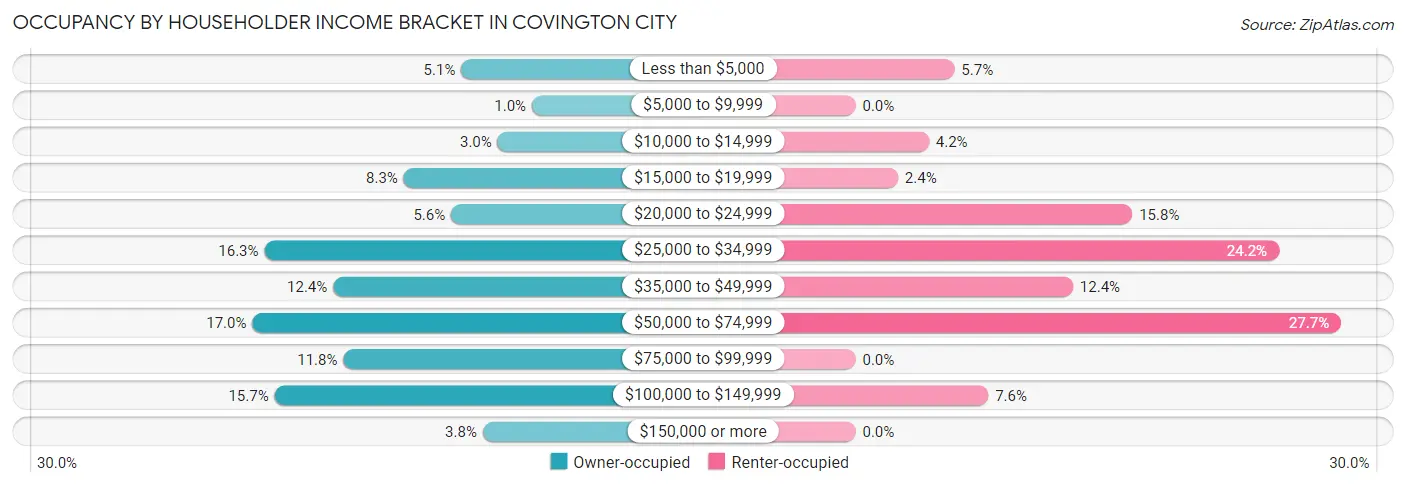
| Income Bracket | Owner-occupied | Renter-occupied |
| Less than $5,000 | 95 (5.1%) | 35 (5.7%) |
| $5,000 to $9,999 | 19 (1.0%) | 0 (0.0%) |
| $10,000 to $14,999 | 56 (3.0%) | 26 (4.2%) |
| $15,000 to $19,999 | 157 (8.3%) | 15 (2.4%) |
| $20,000 to $24,999 | 106 (5.6%) | 98 (15.8%) |
| $25,000 to $34,999 | 307 (16.3%) | 150 (24.2%) |
| $35,000 to $49,999 | 233 (12.4%) | 77 (12.4%) |
| $50,000 to $74,999 | 320 (17.0%) | 172 (27.7%) |
| $75,000 to $99,999 | 222 (11.8%) | 0 (0.0%) |
| $100,000 to $149,999 | 296 (15.7%) | 47 (7.6%) |
| $150,000 or more | 72 (3.8%) | 0 (0.0%) |
| Total | 1,883 (100.0%) | 620 (100.0%) |
Monthly Housing Cost Tiers in Covington city
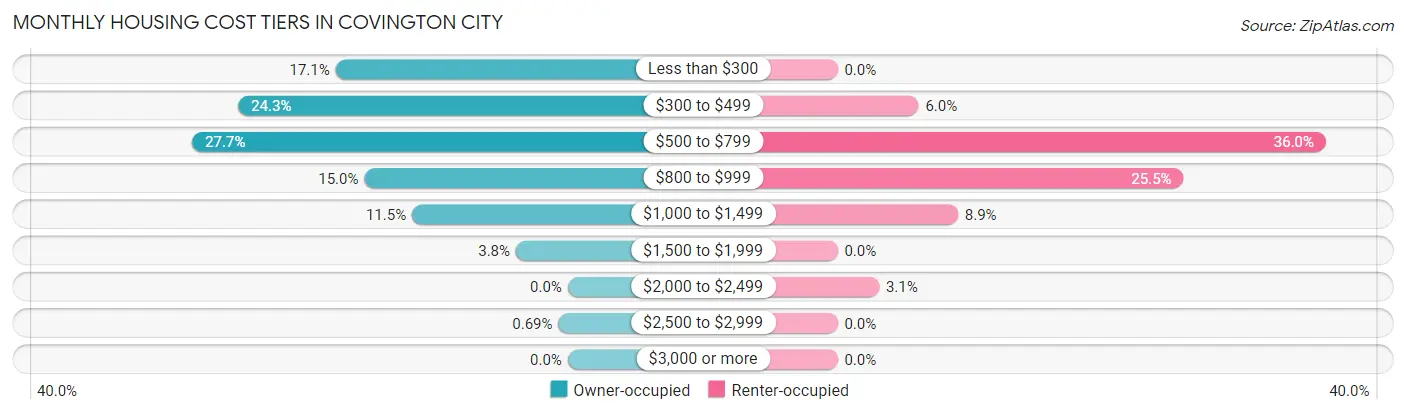
| Monthly Cost | Owner-occupied | Renter-occupied |
| Less than $300 | 322 (17.1%) | 0 (0.0%) |
| $300 to $499 | 457 (24.3%) | 37 (6.0%) |
| $500 to $799 | 521 (27.7%) | 223 (36.0%) |
| $800 to $999 | 282 (15.0%) | 158 (25.5%) |
| $1,000 to $1,499 | 216 (11.5%) | 55 (8.9%) |
| $1,500 to $1,999 | 72 (3.8%) | 0 (0.0%) |
| $2,000 to $2,499 | 0 (0.0%) | 19 (3.1%) |
| $2,500 to $2,999 | 13 (0.7%) | 0 (0.0%) |
| $3,000 or more | 0 (0.0%) | 0 (0.0%) |
| Total | 1,883 (100.0%) | 620 (100.0%) |
Physical Housing Characteristics in Covington city
Housing Structures in Covington city
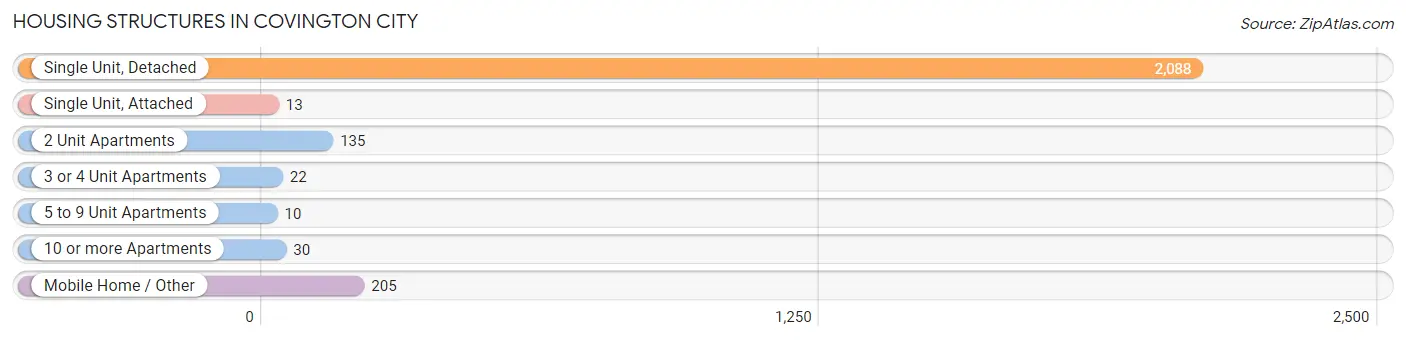
| Structure Type | # Housing Units | % Housing Units |
| Single Unit, Detached | 2,088 | 83.4% |
| Single Unit, Attached | 13 | 0.5% |
| 2 Unit Apartments | 135 | 5.4% |
| 3 or 4 Unit Apartments | 22 | 0.9% |
| 5 to 9 Unit Apartments | 10 | 0.4% |
| 10 or more Apartments | 30 | 1.2% |
| Mobile Home / Other | 205 | 8.2% |
| Total | 2,503 | 100.0% |
Housing Structures by Occupancy in Covington city
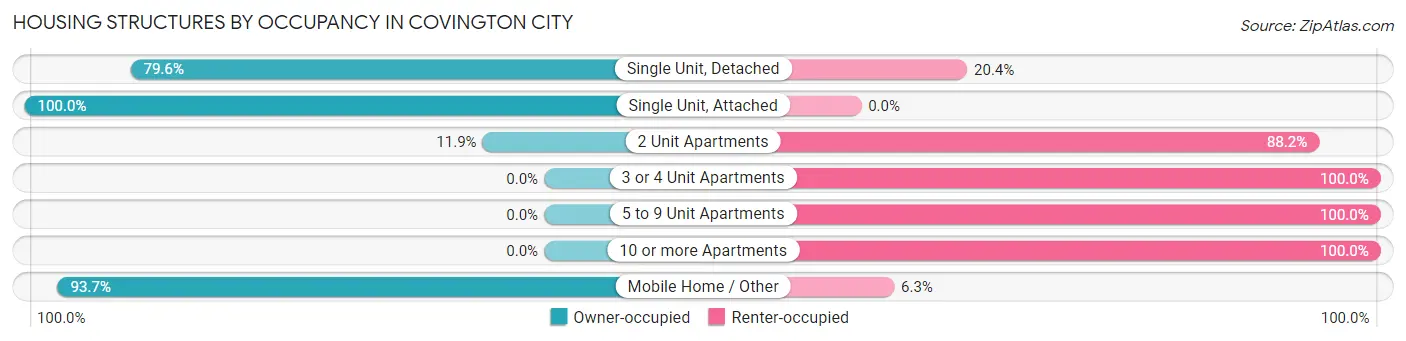
| Structure Type | Owner-occupied | Renter-occupied |
| Single Unit, Detached | 1,662 (79.6%) | 426 (20.4%) |
| Single Unit, Attached | 13 (100.0%) | 0 (0.0%) |
| 2 Unit Apartments | 16 (11.8%) | 119 (88.1%) |
| 3 or 4 Unit Apartments | 0 (0.0%) | 22 (100.0%) |
| 5 to 9 Unit Apartments | 0 (0.0%) | 10 (100.0%) |
| 10 or more Apartments | 0 (0.0%) | 30 (100.0%) |
| Mobile Home / Other | 192 (93.7%) | 13 (6.3%) |
| Total | 1,883 (75.2%) | 620 (24.8%) |
Housing Structures by Number of Rooms in Covington city
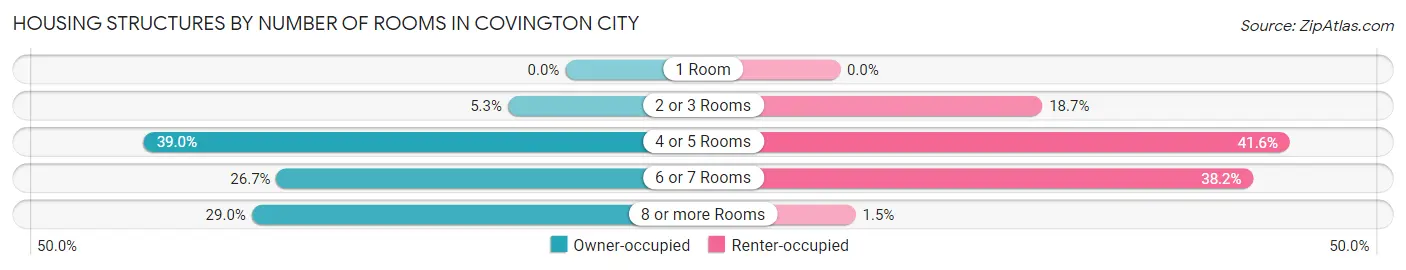
| Number of Rooms | Owner-occupied | Renter-occupied |
| 1 Room | 0 (0.0%) | 0 (0.0%) |
| 2 or 3 Rooms | 100 (5.3%) | 116 (18.7%) |
| 4 or 5 Rooms | 734 (39.0%) | 258 (41.6%) |
| 6 or 7 Rooms | 503 (26.7%) | 237 (38.2%) |
| 8 or more Rooms | 546 (29.0%) | 9 (1.5%) |
| Total | 1,883 (100.0%) | 620 (100.0%) |
Housing Structure by Heating Type in Covington city
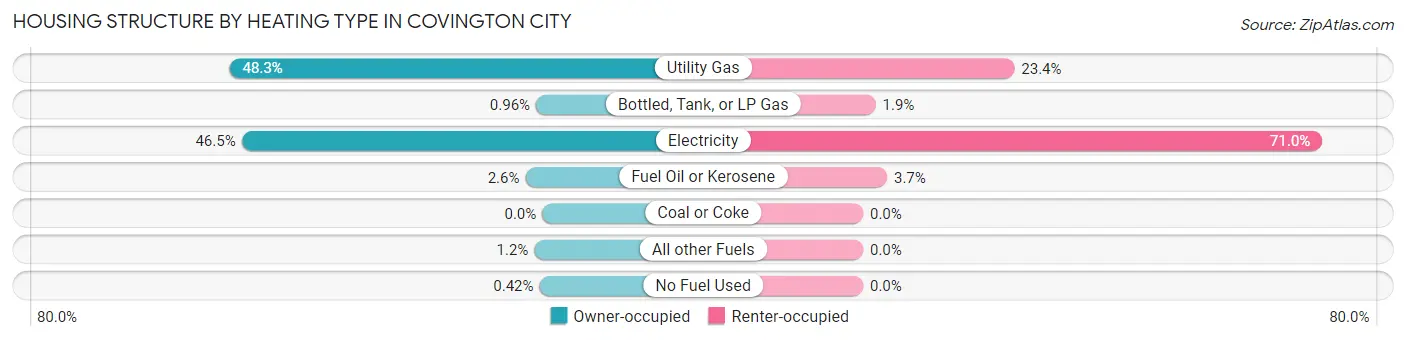
| Heating Type | Owner-occupied | Renter-occupied |
| Utility Gas | 910 (48.3%) | 145 (23.4%) |
| Bottled, Tank, or LP Gas | 18 (1.0%) | 12 (1.9%) |
| Electricity | 875 (46.5%) | 440 (71.0%) |
| Fuel Oil or Kerosene | 49 (2.6%) | 23 (3.7%) |
| Coal or Coke | 0 (0.0%) | 0 (0.0%) |
| All other Fuels | 23 (1.2%) | 0 (0.0%) |
| No Fuel Used | 8 (0.4%) | 0 (0.0%) |
| Total | 1,883 (100.0%) | 620 (100.0%) |
Household Vehicle Usage in Covington city
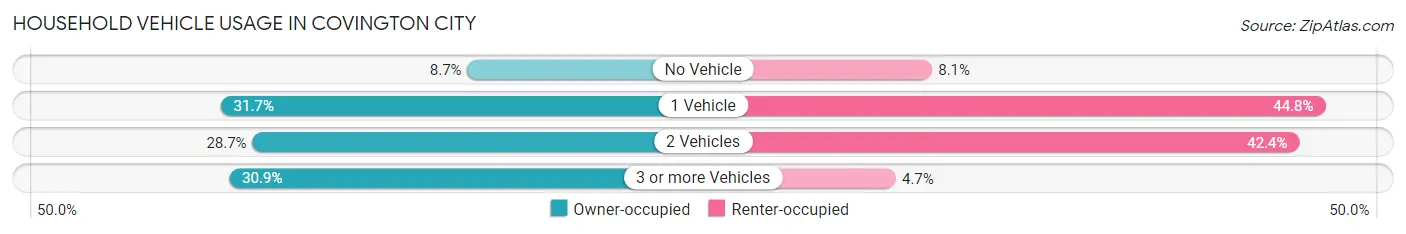
| Vehicles per Household | Owner-occupied | Renter-occupied |
| No Vehicle | 163 (8.7%) | 50 (8.1%) |
| 1 Vehicle | 597 (31.7%) | 278 (44.8%) |
| 2 Vehicles | 541 (28.7%) | 263 (42.4%) |
| 3 or more Vehicles | 582 (30.9%) | 29 (4.7%) |
| Total | 1,883 (100.0%) | 620 (100.0%) |
Real Estate & Mortgages in Covington city
Real Estate and Mortgage Overview in Covington city
| Characteristic | Without Mortgage | With Mortgage |
| Housing Units | 1,105 | 778 |
| Median Property Value | $57,400 | $86,300 |
| Median Household Income | $33,618 | $35 |
| Monthly Housing Costs | $405 | $0 |
| Real Estate Taxes | $551 | $96 |
Property Value by Mortgage Status in Covington city
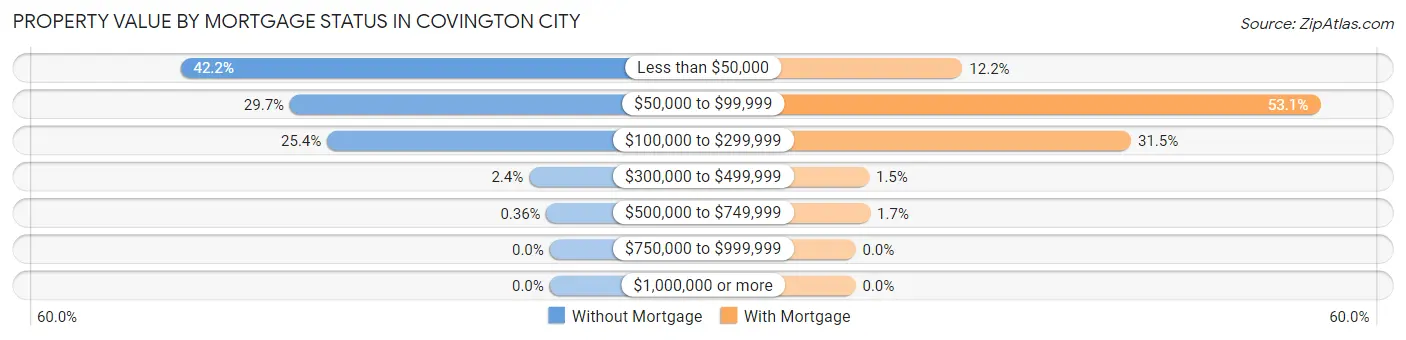
| Property Value | Without Mortgage | With Mortgage |
| Less than $50,000 | 466 (42.2%) | 95 (12.2%) |
| $50,000 to $99,999 | 328 (29.7%) | 413 (53.1%) |
| $100,000 to $299,999 | 281 (25.4%) | 245 (31.5%) |
| $300,000 to $499,999 | 26 (2.4%) | 12 (1.5%) |
| $500,000 to $749,999 | 4 (0.4%) | 13 (1.7%) |
| $750,000 to $999,999 | 0 (0.0%) | 0 (0.0%) |
| $1,000,000 or more | 0 (0.0%) | 0 (0.0%) |
| Total | 1,105 (100.0%) | 778 (100.0%) |
Household Income by Mortgage Status in Covington city
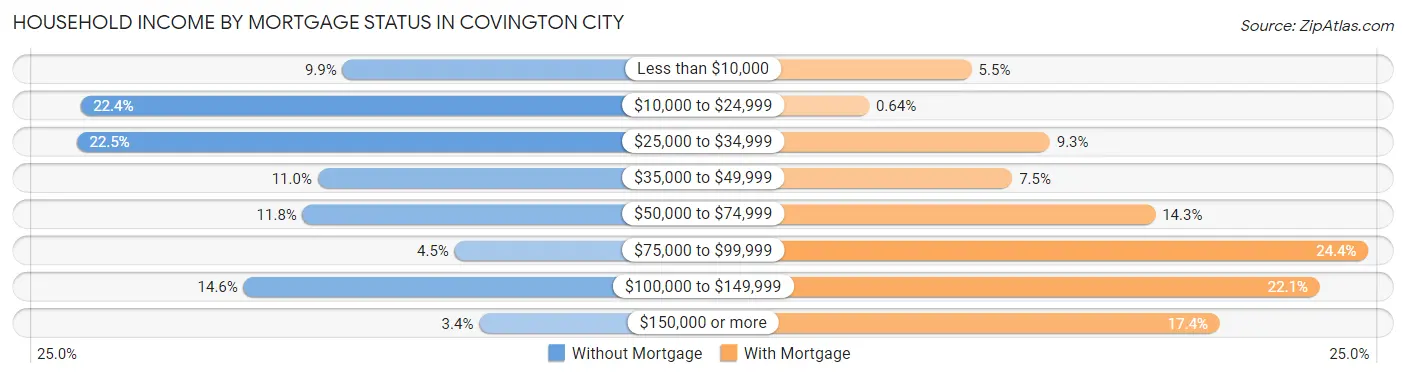
| Household Income | Without Mortgage | With Mortgage |
| Less than $10,000 | 109 (9.9%) | 43 (5.5%) |
| $10,000 to $24,999 | 247 (22.4%) | 5 (0.6%) |
| $25,000 to $34,999 | 249 (22.5%) | 72 (9.2%) |
| $35,000 to $49,999 | 122 (11.0%) | 58 (7.5%) |
| $50,000 to $74,999 | 130 (11.8%) | 111 (14.3%) |
| $75,000 to $99,999 | 50 (4.5%) | 190 (24.4%) |
| $100,000 to $149,999 | 161 (14.6%) | 172 (22.1%) |
| $150,000 or more | 37 (3.4%) | 135 (17.3%) |
| Total | 1,105 (100.0%) | 778 (100.0%) |
Property Value to Household Income Ratio in Covington city
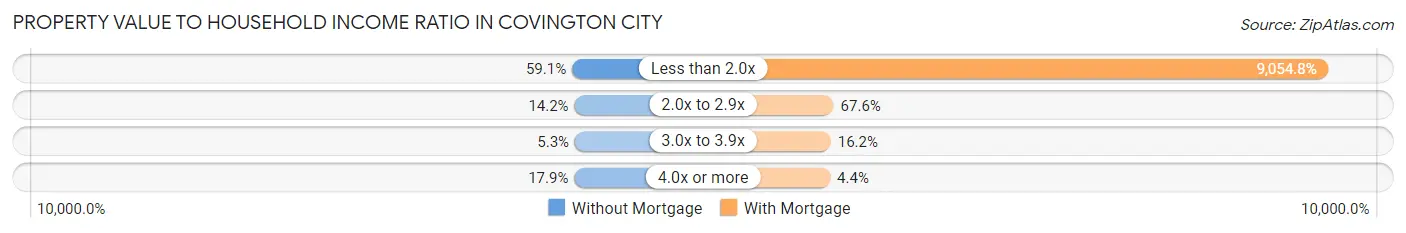
| Value-to-Income Ratio | Without Mortgage | With Mortgage |
| Less than 2.0x | 653 (59.1%) | 70,446 (9,054.8%) |
| 2.0x to 2.9x | 157 (14.2%) | 526 (67.6%) |
| 3.0x to 3.9x | 59 (5.3%) | 126 (16.2%) |
| 4.0x or more | 198 (17.9%) | 34 (4.4%) |
| Total | 1,105 (100.0%) | 778 (100.0%) |
Real Estate Taxes by Mortgage Status in Covington city
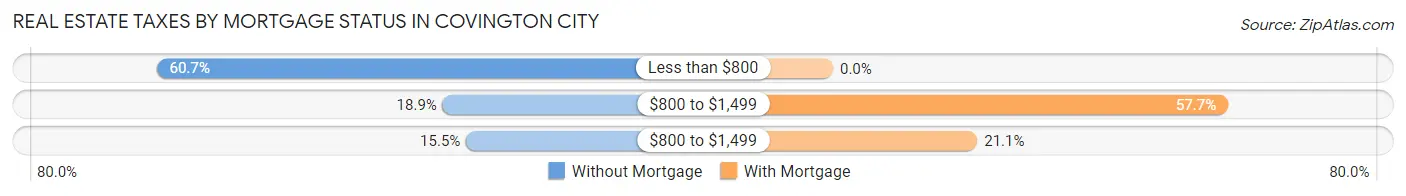
| Property Taxes | Without Mortgage | With Mortgage |
| Less than $800 | 671 (60.7%) | 0 (0.0%) |
| $800 to $1,499 | 209 (18.9%) | 449 (57.7%) |
| $800 to $1,499 | 171 (15.5%) | 164 (21.1%) |
| Total | 1,105 (100.0%) | 778 (100.0%) |
Health & Disability in Covington city
Health Insurance Coverage by Age in Covington city
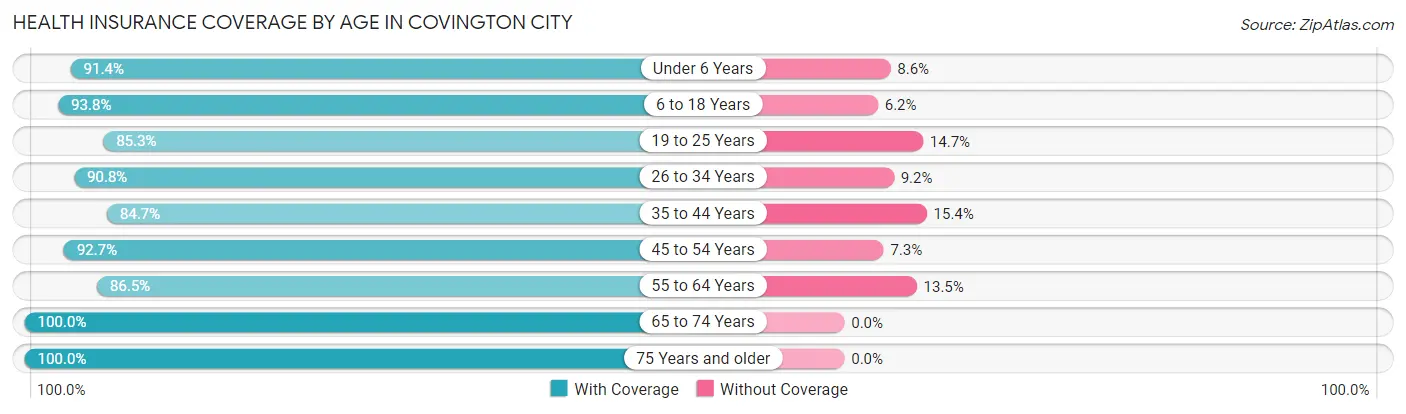
| Age Bracket | With Coverage | Without Coverage |
| Under 6 Years | 383 (91.4%) | 36 (8.6%) |
| 6 to 18 Years | 961 (93.8%) | 64 (6.2%) |
| 19 to 25 Years | 297 (85.3%) | 51 (14.7%) |
| 26 to 34 Years | 552 (90.8%) | 56 (9.2%) |
| 35 to 44 Years | 590 (84.7%) | 107 (15.3%) |
| 45 to 54 Years | 508 (92.7%) | 40 (7.3%) |
| 55 to 64 Years | 776 (86.5%) | 121 (13.5%) |
| 65 to 74 Years | 642 (100.0%) | 0 (0.0%) |
| 75 Years and older | 450 (100.0%) | 0 (0.0%) |
| Total | 5,159 (91.6%) | 475 (8.4%) |
Health Insurance Coverage by Citizenship Status in Covington city
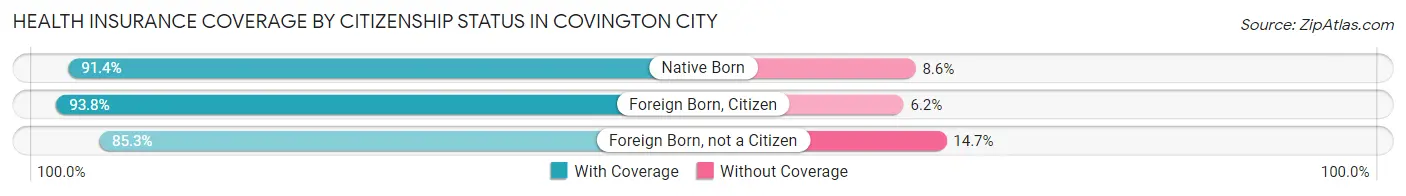
| Citizenship Status | With Coverage | Without Coverage |
| Native Born | 383 (91.4%) | 36 (8.6%) |
| Foreign Born, Citizen | 961 (93.8%) | 64 (6.2%) |
| Foreign Born, not a Citizen | 297 (85.3%) | 51 (14.7%) |
Health Insurance Coverage by Household Income in Covington city
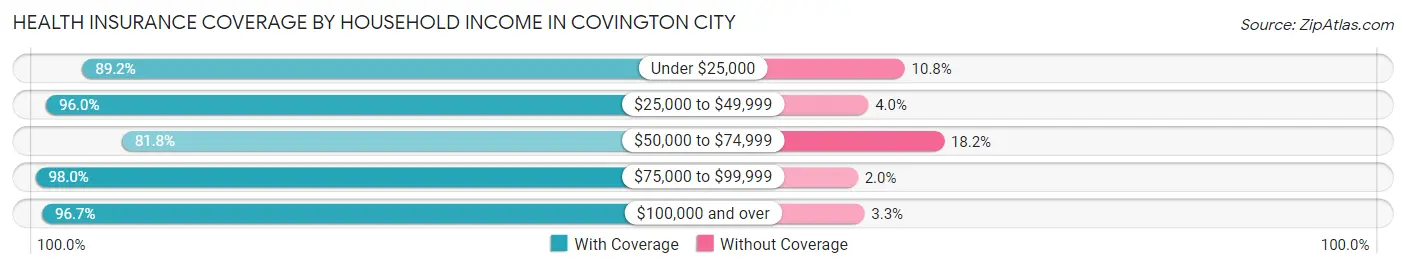
| Household Income | With Coverage | Without Coverage |
| Under $25,000 | 963 (89.2%) | 117 (10.8%) |
| $25,000 to $49,999 | 1,171 (96.0%) | 49 (4.0%) |
| $50,000 to $74,999 | 1,137 (81.8%) | 253 (18.2%) |
| $75,000 to $99,999 | 623 (98.0%) | 13 (2.0%) |
| $100,000 and over | 1,265 (96.7%) | 43 (3.3%) |
Public vs Private Health Insurance Coverage by Age in Covington city
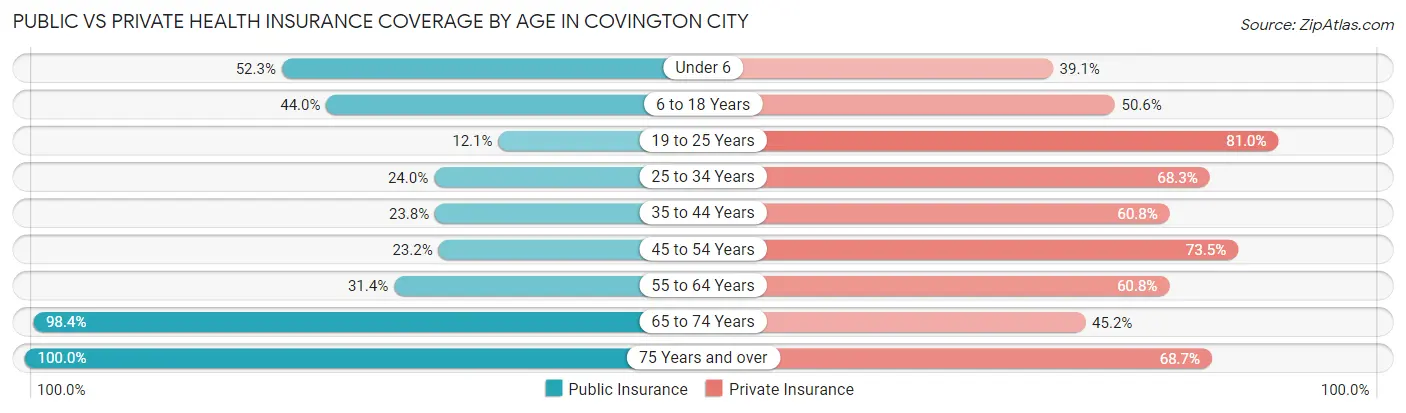
| Age Bracket | Public Insurance | Private Insurance |
| Under 6 | 219 (52.3%) | 164 (39.1%) |
| 6 to 18 Years | 451 (44.0%) | 519 (50.6%) |
| 19 to 25 Years | 42 (12.1%) | 282 (81.0%) |
| 25 to 34 Years | 146 (24.0%) | 415 (68.3%) |
| 35 to 44 Years | 166 (23.8%) | 424 (60.8%) |
| 45 to 54 Years | 127 (23.2%) | 403 (73.5%) |
| 55 to 64 Years | 282 (31.4%) | 545 (60.8%) |
| 65 to 74 Years | 632 (98.4%) | 290 (45.2%) |
| 75 Years and over | 450 (100.0%) | 309 (68.7%) |
| Total | 2,515 (44.6%) | 3,351 (59.5%) |
Disability Status by Sex by Age in Covington city
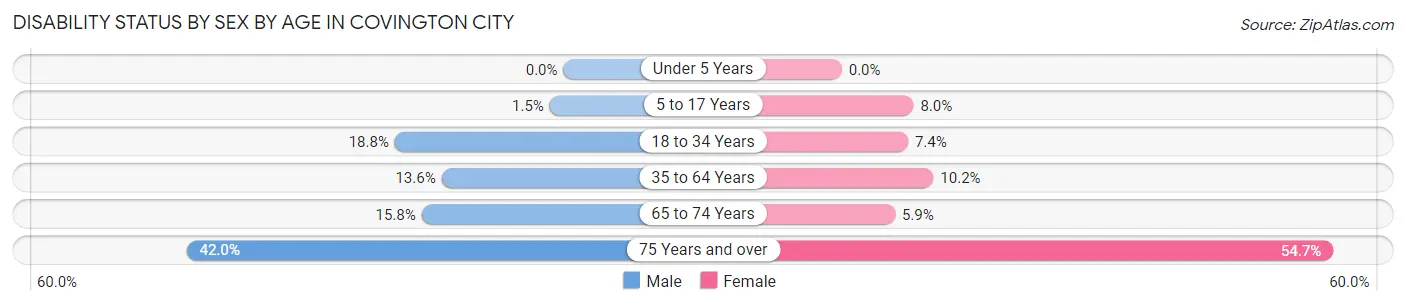
| Age Bracket | Male | Female |
| Under 5 Years | 0 (0.0%) | 0 (0.0%) |
| 5 to 17 Years | 7 (1.5%) | 38 (8.0%) |
| 18 to 34 Years | 105 (18.8%) | 41 (7.4%) |
| 35 to 64 Years | 139 (13.6%) | 114 (10.2%) |
| 65 to 74 Years | 48 (15.8%) | 20 (5.9%) |
| 75 Years and over | 60 (42.0%) | 168 (54.7%) |
Disability Class by Sex by Age in Covington city
Disability Class: Hearing Difficulty
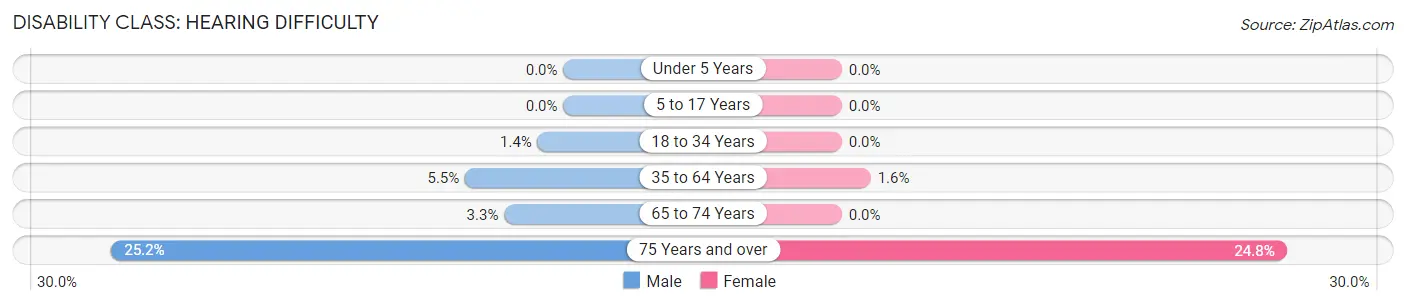
| Age Bracket | Male | Female |
| Under 5 Years | 0 (0.0%) | 0 (0.0%) |
| 5 to 17 Years | 0 (0.0%) | 0 (0.0%) |
| 18 to 34 Years | 8 (1.4%) | 0 (0.0%) |
| 35 to 64 Years | 56 (5.5%) | 18 (1.6%) |
| 65 to 74 Years | 10 (3.3%) | 0 (0.0%) |
| 75 Years and over | 36 (25.2%) | 76 (24.8%) |
Disability Class: Vision Difficulty
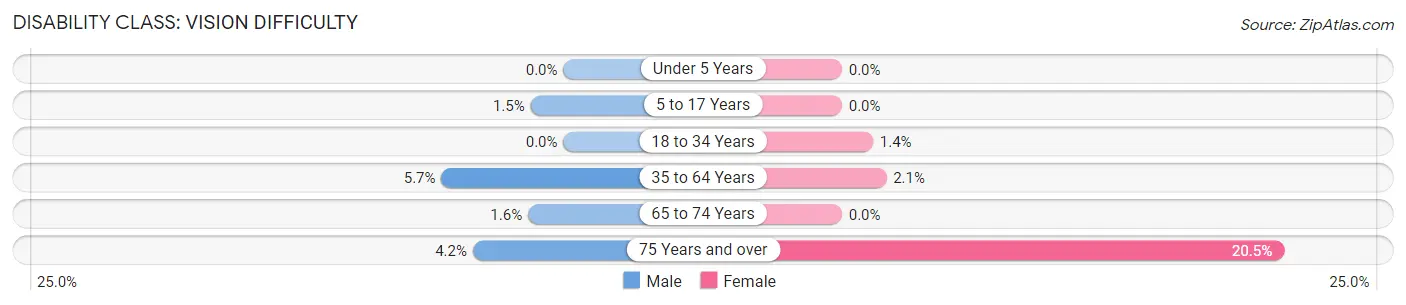
| Age Bracket | Male | Female |
| Under 5 Years | 0 (0.0%) | 0 (0.0%) |
| 5 to 17 Years | 7 (1.5%) | 0 (0.0%) |
| 18 to 34 Years | 0 (0.0%) | 8 (1.4%) |
| 35 to 64 Years | 58 (5.7%) | 23 (2.1%) |
| 65 to 74 Years | 5 (1.6%) | 0 (0.0%) |
| 75 Years and over | 6 (4.2%) | 63 (20.5%) |
Disability Class: Cognitive Difficulty
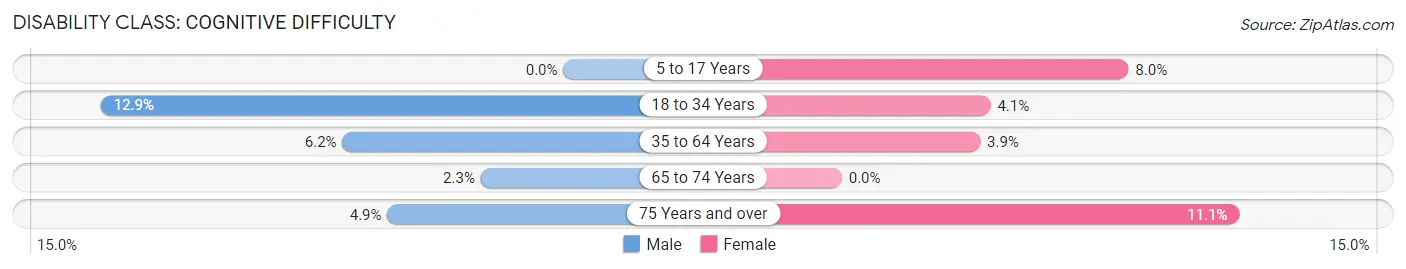
| Age Bracket | Male | Female |
| 5 to 17 Years | 0 (0.0%) | 38 (8.0%) |
| 18 to 34 Years | 72 (12.9%) | 23 (4.1%) |
| 35 to 64 Years | 63 (6.1%) | 43 (3.8%) |
| 65 to 74 Years | 7 (2.3%) | 0 (0.0%) |
| 75 Years and over | 7 (4.9%) | 34 (11.1%) |
Disability Class: Ambulatory Difficulty
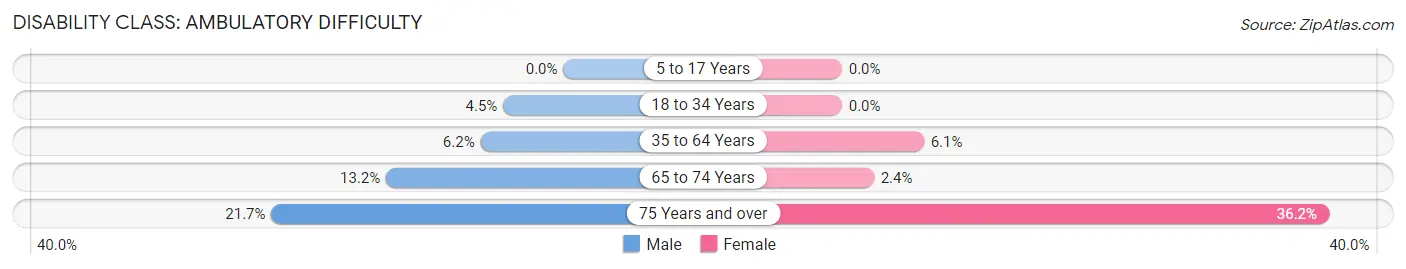
| Age Bracket | Male | Female |
| 5 to 17 Years | 0 (0.0%) | 0 (0.0%) |
| 18 to 34 Years | 25 (4.5%) | 0 (0.0%) |
| 35 to 64 Years | 63 (6.1%) | 68 (6.1%) |
| 65 to 74 Years | 40 (13.2%) | 8 (2.4%) |
| 75 Years and over | 31 (21.7%) | 111 (36.2%) |
Disability Class: Self-Care Difficulty
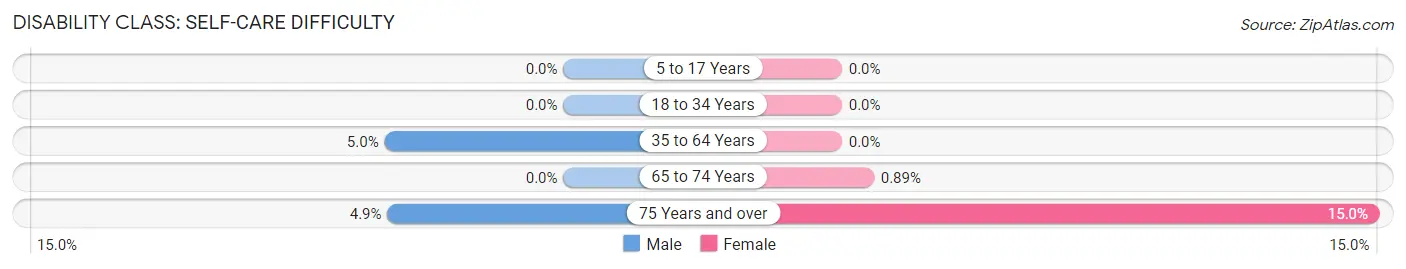
| Age Bracket | Male | Female |
| 5 to 17 Years | 0 (0.0%) | 0 (0.0%) |
| 18 to 34 Years | 0 (0.0%) | 0 (0.0%) |
| 35 to 64 Years | 51 (5.0%) | 0 (0.0%) |
| 65 to 74 Years | 0 (0.0%) | 3 (0.9%) |
| 75 Years and over | 7 (4.9%) | 46 (15.0%) |
Technology Access in Covington city
Computing Device Access in Covington city
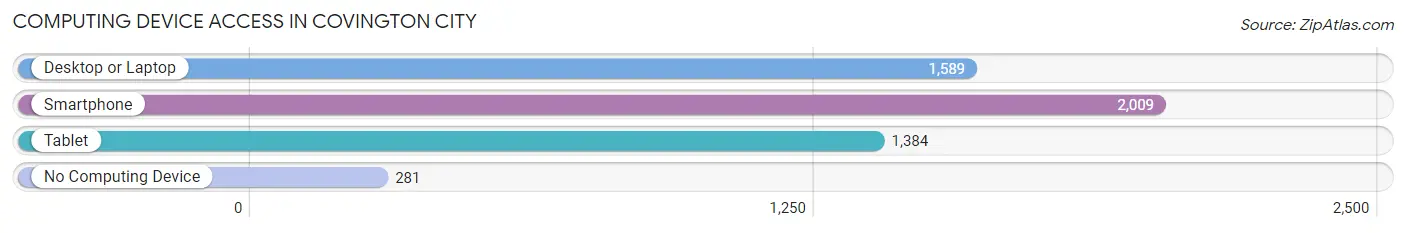
| Device Type | # Households | % Households |
| Desktop or Laptop | 1,589 | 63.5% |
| Smartphone | 2,009 | 80.3% |
| Tablet | 1,384 | 55.3% |
| No Computing Device | 281 | 11.2% |
| Total | 2,503 | 100.0% |
Internet Access in Covington city
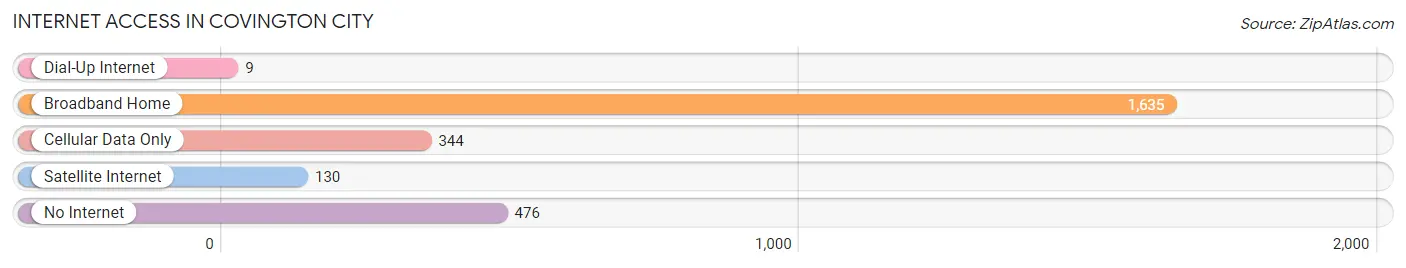
| Internet Type | # Households | % Households |
| Dial-Up Internet | 9 | 0.4% |
| Broadband Home | 1,635 | 65.3% |
| Cellular Data Only | 344 | 13.7% |
| Satellite Internet | 130 | 5.2% |
| No Internet | 476 | 19.0% |
| Total | 2,503 | 100.0% |
Covington city Summary
Covington City, Virginia is a small city located in the western part of the state, in Alleghany County. It is situated in the foothills of the Blue Ridge Mountains, and is part of the Roanoke Metropolitan Statistical Area. The city has a population of 5,961, according to the 2010 census.
History
Covington City was founded in 1818, and was originally known as Alleghany. It was named after the Alleghany Mountains, which are located nearby. The city was incorporated in 1874, and was named after General Leonard Covington, a hero of the War of 1812.
The city was an important stop on the Virginia and Tennessee Railroad, which was built in the late 19th century. The railroad connected Covington to the larger cities of Roanoke and Lynchburg. The city was also home to several coal mines, which provided employment for many of the city's residents.
Geography
Covington City is located in the western part of Virginia, in Alleghany County. It is situated in the foothills of the Blue Ridge Mountains, and is part of the Roanoke Metropolitan Statistical Area. The city has a total area of 4.2 square miles, all of which is land.
The city is located at the intersection of Interstate 64 and US Route 220. It is also located near the Jackson River, which is a tributary of the James River.
Economy
Covington City's economy is largely based on the service industry. The city is home to several restaurants, hotels, and other businesses that cater to tourists. The city is also home to several manufacturing companies, including a paper mill and a furniture factory.
The city is also home to several educational institutions, including Dabney S. Lancaster Community College and the University of Virginia's College at Wise.
Demographics
According to the 2010 census, Covington City has a population of 5,961. The racial makeup of the city is 87.3% White, 8.2% African American, 0.3% Native American, 0.7% Asian, 0.1% Pacific Islander, 1.2% from other races, and 2.4% from two or more races. Hispanic or Latino of any race were 2.7% of the population.
The median household income in Covington City is $35,938, and the median family income is $41,944. The per capita income is $19,945. About 17.2% of the population is below the poverty line.
Conclusion
Covington City, Virginia is a small city located in the western part of the state, in Alleghany County. It was founded in 1818, and was originally known as Alleghany. The city has a population of 5,961, according to the 2010 census. The city's economy is largely based on the service industry, and it is home to several educational institutions. The median household income in Covington City is $35,938, and the median family income is $41,944. About 17.2% of the population is below the poverty line.
Common Questions
What is Per Capita Income in Covington city?
Per Capita income in Covington city is $24,657.
What is the Median Family Income in Covington city?
Median Family Income in Covington city is $57,125.
What is the Median Household income in Covington city?
Median Household Income in Covington city is $45,737.
What is Income or Wage Gap in Covington city?
Income or Wage Gap in Covington city is 53.9%.
Women in Covington city earn 46.1 cents for every dollar earned by a man.
What is Family Income Deficit in Covington city?
Family Income Deficit in Covington city is $8,627.
Families that are below poverty line in Covington city earn $8,627 less on average than the poverty threshold level.
What is Inequality or Gini Index in Covington city?
Inequality or Gini Index in Covington city is 0.40.
What is the Total Population of Covington city?
Total Population of Covington city is 5,722.
What is the Total Male Population of Covington city?
Total Male Population of Covington city is 2,716.
What is the Total Female Population of Covington city?
Total Female Population of Covington city is 3,006.
What is the Ratio of Males per 100 Females in Covington city?
There are 90.35 Males per 100 Females in Covington city.
What is the Ratio of Females per 100 Males in Covington city?
There are 110.68 Females per 100 Males in Covington city.
What is the Median Population Age in Covington city?
Median Population Age in Covington city is 41.9 Years.
What is the Average Family Size in Covington city
Average Family Size in Covington city is 2.9 People.
What is the Average Household Size in Covington city
Average Household Size in Covington city is 2.2 People.
How Large is the Labor Force in Covington city?
There are 2,421 People in the Labor Forcein in Covington city.
What is the Percentage of People in the Labor Force in Covington city?
53.9% of People are in the Labor Force in Covington city.
What is the Unemployment Rate in Covington city?
Unemployment Rate in Covington city is 2.6%.