Manderson White Horse Creek, SD Map & Demographics
Manderson White Horse Creek Map
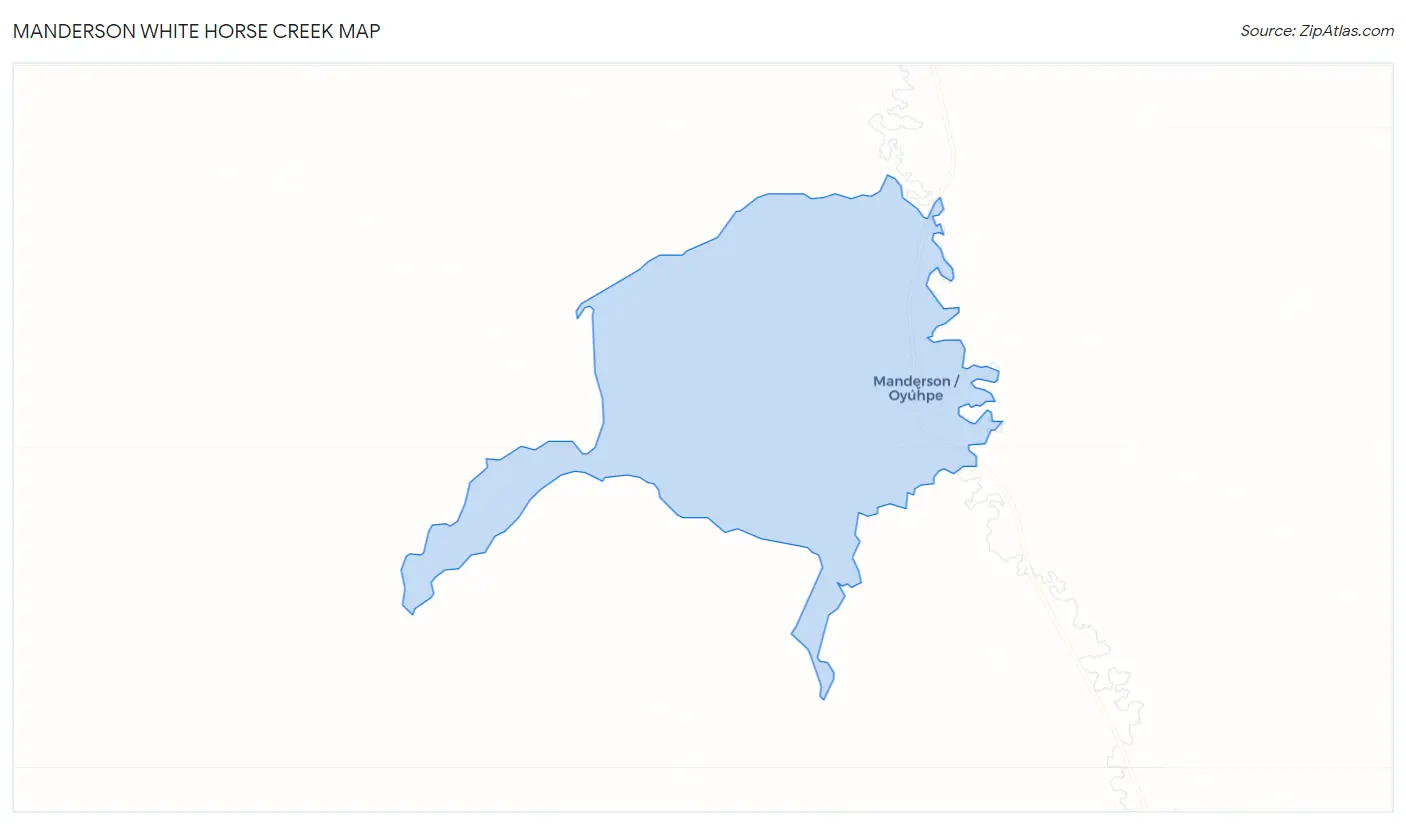
Manderson White Horse Creek Overview
$3,332
PER CAPITA INCOME
$23,261
AVG FAMILY INCOME
0.41
INEQUALITY / GINI INDEX
641
TOTAL POPULATION
281
MALE POPULATION
360
FEMALE POPULATION
78.06
MALES / 100 FEMALES
128.11
FEMALES / 100 MALES
32.3
MEDIAN AGE
6.2
AVG FAMILY SIZE
5.4
AVG HOUSEHOLD SIZE
60
LABOR FORCE [ PEOPLE ]
14.0%
PERCENT IN LABOR FORCE
8.3%
UNEMPLOYMENT RATE
Income in Manderson White Horse Creek
Income Overview in Manderson White Horse Creek
| Characteristic | Number | Measure |
| Per Capita Income | 641 | $3,332 |
| Median Family Income | 100 | $23,261 |
| Mean Family Income | 100 | $19,715 |
| Median Household Income | 119 | $0 |
| Mean Household Income | 119 | $16,567 |
| Income Deficit | 100 | $0 |
| Wage / Income Gap (%) | 641 | 0.00% |
| Wage / Income Gap ($) | 641 | 100.00¢ per $1 |
| Gini / Inequality Index | 641 | 0.41 |
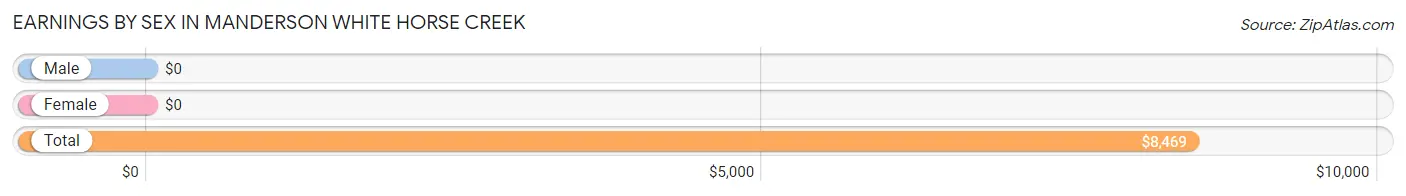
Earnings by Sex in Manderson White Horse Creek
| Sex | Number | Average Earnings |
| Male | 30 (50.0%) | $0 |
| Female | 30 (50.0%) | $0 |
| Total | 60 (100.0%) | $8,469 |
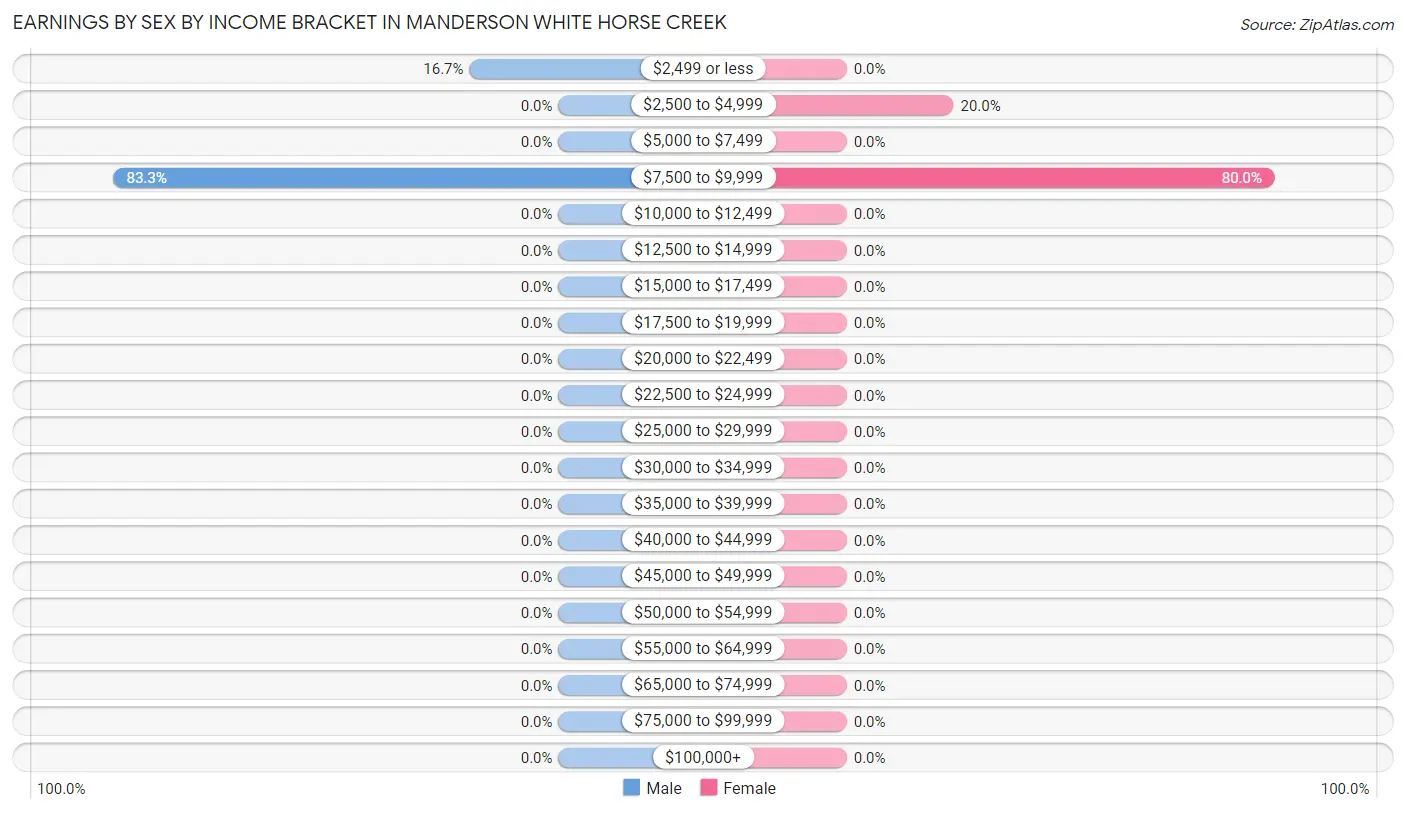
Earnings by Sex by Income Bracket in Manderson White Horse Creek
The most common earnings brackets in Manderson White Horse Creek are $7,500 to $9,999 for men (25 | 83.3%) and $7,500 to $9,999 for women (24 | 80.0%).
| Income | Male | Female |
| $2,499 or less | 5 (16.7%) | 0 (0.0%) |
| $2,500 to $4,999 | 0 (0.0%) | 6 (20.0%) |
| $5,000 to $7,499 | 0 (0.0%) | 0 (0.0%) |
| $7,500 to $9,999 | 25 (83.3%) | 24 (80.0%) |
| $10,000 to $12,499 | 0 (0.0%) | 0 (0.0%) |
| $12,500 to $14,999 | 0 (0.0%) | 0 (0.0%) |
| $15,000 to $17,499 | 0 (0.0%) | 0 (0.0%) |
| $17,500 to $19,999 | 0 (0.0%) | 0 (0.0%) |
| $20,000 to $22,499 | 0 (0.0%) | 0 (0.0%) |
| $22,500 to $24,999 | 0 (0.0%) | 0 (0.0%) |
| $25,000 to $29,999 | 0 (0.0%) | 0 (0.0%) |
| $30,000 to $34,999 | 0 (0.0%) | 0 (0.0%) |
| $35,000 to $39,999 | 0 (0.0%) | 0 (0.0%) |
| $40,000 to $44,999 | 0 (0.0%) | 0 (0.0%) |
| $45,000 to $49,999 | 0 (0.0%) | 0 (0.0%) |
| $50,000 to $54,999 | 0 (0.0%) | 0 (0.0%) |
| $55,000 to $64,999 | 0 (0.0%) | 0 (0.0%) |
| $65,000 to $74,999 | 0 (0.0%) | 0 (0.0%) |
| $75,000 to $99,999 | 0 (0.0%) | 0 (0.0%) |
| $100,000+ | 0 (0.0%) | 0 (0.0%) |
| Total | 30 (100.0%) | 30 (100.0%) |
Earnings by Sex by Educational Attainment in Manderson White Horse Creek
| Educational Attainment | Male Income | Female Income |
| Less than High School | - | - |
| High School Diploma | - | - |
| College or Associate's Degree | - | - |
| Bachelor's Degree | - | - |
| Graduate Degree | - | - |
| Total | - | - |
Family Income in Manderson White Horse Creek
Family Income Brackets in Manderson White Horse Creek
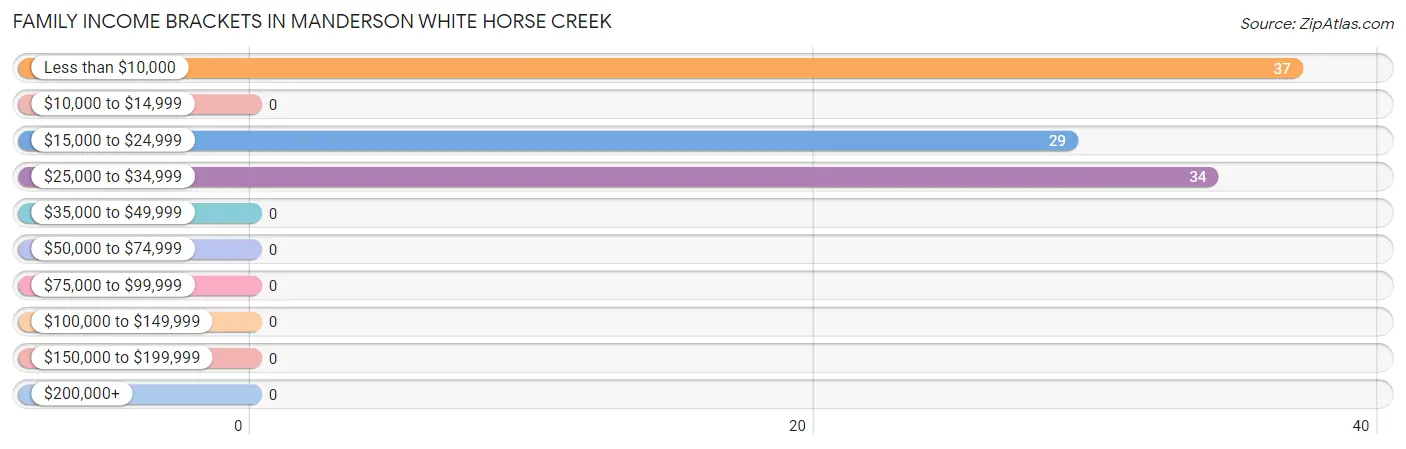
According to the Manderson White Horse Creek family income data, there are 37 families falling into the less than $10,000 income range, which is the most common income bracket and makes up 37.0% of all families.
| Income Bracket | # Families | % Families |
| Less than $10,000 | 37 | 37.0% |
| $10,000 to $14,999 | 0 | 0.0% |
| $15,000 to $24,999 | 29 | 29.0% |
| $25,000 to $34,999 | 34 | 34.0% |
| $35,000 to $49,999 | 0 | 0.0% |
| $50,000 to $74,999 | 0 | 0.0% |
| $75,000 to $99,999 | 0 | 0.0% |
| $100,000 to $149,999 | 0 | 0.0% |
| $150,000 to $199,999 | 0 | 0.0% |
| $200,000+ | 0 | 0.0% |
Family Income by Famaliy Size in Manderson White Horse Creek
| Income Bracket | # Families | Median Income |
| 2-Person Families | 0 (0.0%) | $0 |
| 3-Person Families | 0 (0.0%) | $0 |
| 4-Person Families | 6 (6.0%) | $0 |
| 5-Person Families | 46 (46.0%) | $0 |
| 6-Person Families | 14 (14.0%) | $0 |
| 7+ Person Families | 34 (34.0%) | $0 |
| Total | 100 (100.0%) | $23,261 |
Family Income by Number of Earners in Manderson White Horse Creek
| Number of Earners | # Families | Median Income |
| No Earners | 46 (46.0%) | $0 |
| 1 Earner | 48 (48.0%) | $0 |
| 2 Earners | 6 (6.0%) | $0 |
| 3+ Earners | 0 (0.0%) | $0 |
| Total | 100 (100.0%) | $23,261 |
Household Income in Manderson White Horse Creek
Household Income Brackets in Manderson White Horse Creek
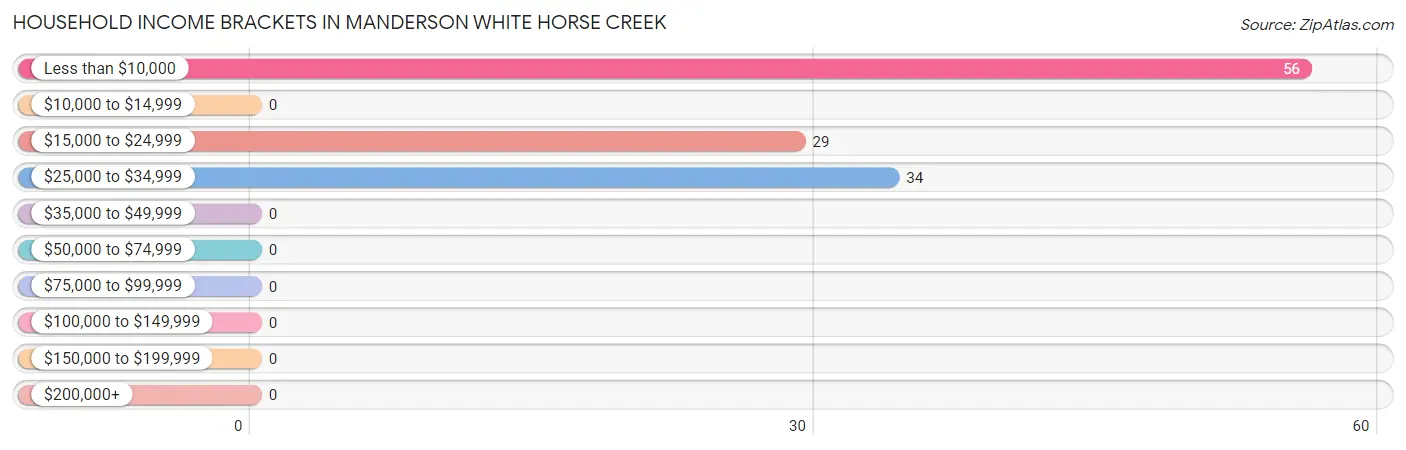
With 56 households falling in the category, the less than $10,000 income range is the most frequent in Manderson White Horse Creek, accounting for 47.1% of all households.
| Income Bracket | # Households | % Households |
| Less than $10,000 | 56 | 47.1% |
| $10,000 to $14,999 | 0 | 0.0% |
| $15,000 to $24,999 | 29 | 24.4% |
| $25,000 to $34,999 | 34 | 28.6% |
| $35,000 to $49,999 | 0 | 0.0% |
| $50,000 to $74,999 | 0 | 0.0% |
| $75,000 to $99,999 | 0 | 0.0% |
| $100,000 to $149,999 | 0 | 0.0% |
| $150,000 to $199,999 | 0 | 0.0% |
| $200,000+ | 0 | 0.0% |
Household Income by Householder Age in Manderson White Horse Creek
The median household income in Manderson White Horse Creek is $0, with the highest median household income of $24,348 found in the 65+ years age bracket for the primary householder. A total of 80 households (67.2%) fall into this category.
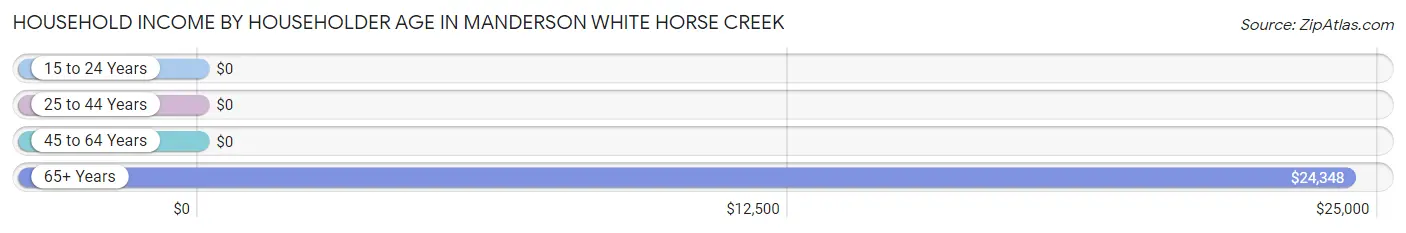
| Income Bracket | # Households | Median Income |
| 15 to 24 Years | 0 (0.0%) | $0 |
| 25 to 44 Years | 39 (32.8%) | $0 |
| 45 to 64 Years | 0 (0.0%) | $0 |
| 65+ Years | 80 (67.2%) | $24,348 |
| Total | 119 (100.0%) | $0 |
Poverty in Manderson White Horse Creek
Income Below Poverty by Sex and Age in Manderson White Horse Creek
With 100.0% poverty level for males and 100.0% for females among the residents of Manderson White Horse Creek, under 5 year old males and under 5 year old females are the most vulnerable to poverty, with 28 males (100.0%) and 110 females (100.0%) in their respective age groups living below the poverty level.
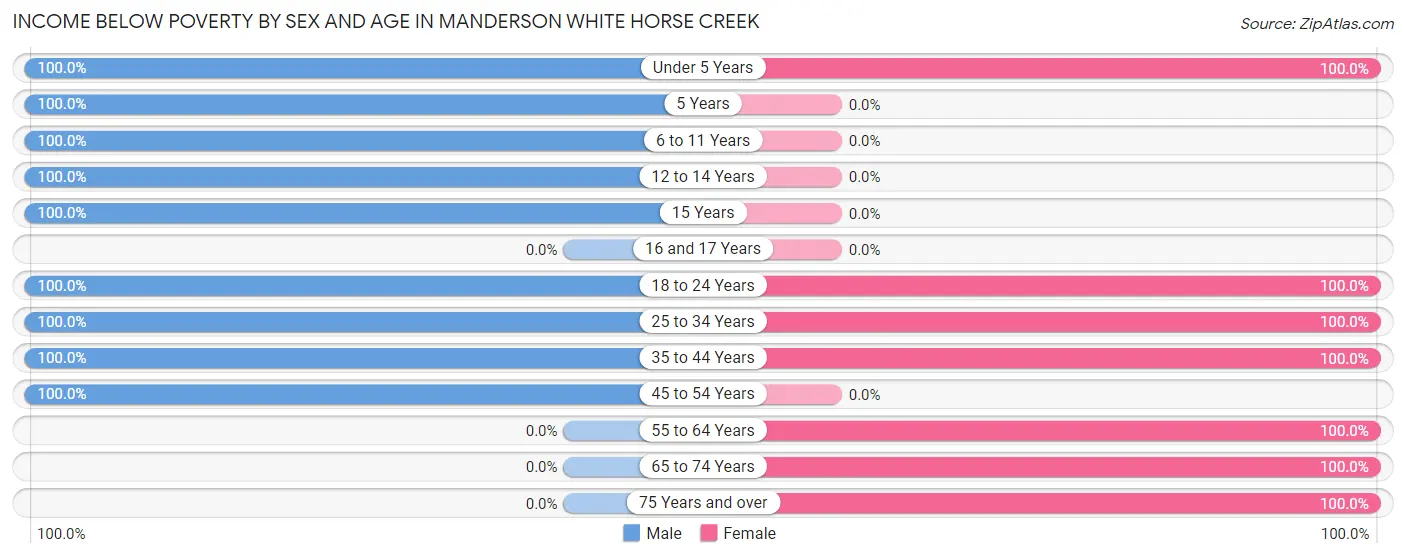
| Age Bracket | Male | Female |
| Under 5 Years | 28 (100.0%) | 110 (100.0%) |
| 5 Years | 19 (100.0%) | 0 (0.0%) |
| 6 to 11 Years | 18 (100.0%) | 0 (0.0%) |
| 12 to 14 Years | 32 (100.0%) | 0 (0.0%) |
| 15 Years | 5 (100.0%) | 0 (0.0%) |
| 16 and 17 Years | 0 (0.0%) | 0 (0.0%) |
| 18 to 24 Years | 32 (100.0%) | 44 (100.0%) |
| 25 to 34 Years | 36 (100.0%) | 59 (100.0%) |
| 35 to 44 Years | 64 (100.0%) | 43 (100.0%) |
| 45 to 54 Years | 47 (100.0%) | 0 (0.0%) |
| 55 to 64 Years | 0 (0.0%) | 24 (100.0%) |
| 65 to 74 Years | 0 (0.0%) | 57 (100.0%) |
| 75 Years and over | 0 (0.0%) | 23 (100.0%) |
| Total | 281 (100.0%) | 360 (100.0%) |
Income Above Poverty by Sex and Age in Manderson White Horse Creek
| Age Bracket | Male | Female |
| Under 5 Years | 0 (0.0%) | 0 (0.0%) |
| 5 Years | 0 (0.0%) | 0 (0.0%) |
| 6 to 11 Years | 0 (0.0%) | 0 (0.0%) |
| 12 to 14 Years | 0 (0.0%) | 0 (0.0%) |
| 15 Years | 0 (0.0%) | 0 (0.0%) |
| 16 and 17 Years | 0 (0.0%) | 0 (0.0%) |
| 18 to 24 Years | 0 (0.0%) | 0 (0.0%) |
| 25 to 34 Years | 0 (0.0%) | 0 (0.0%) |
| 35 to 44 Years | 0 (0.0%) | 0 (0.0%) |
| 45 to 54 Years | 0 (0.0%) | 0 (0.0%) |
| 55 to 64 Years | 0 (0.0%) | 0 (0.0%) |
| 65 to 74 Years | 0 (0.0%) | 0 (0.0%) |
| 75 Years and over | 0 (0.0%) | 0 (0.0%) |
| Total | 0 (0.0%) | 0 (0.0%) |
Income Below Poverty Among Married-Couple Families in Manderson White Horse Creek
The poverty statistics for married-couple families in Manderson White Horse Creek show that 100.0% or 6 of the total 6 families live below the poverty line. Families with 1 or 2 children have the highest poverty rate of 100.0%, comprising of 6 families. On the other hand, families with 1 or 2 children have the lowest poverty rate of 100.0%, which includes 6 families.
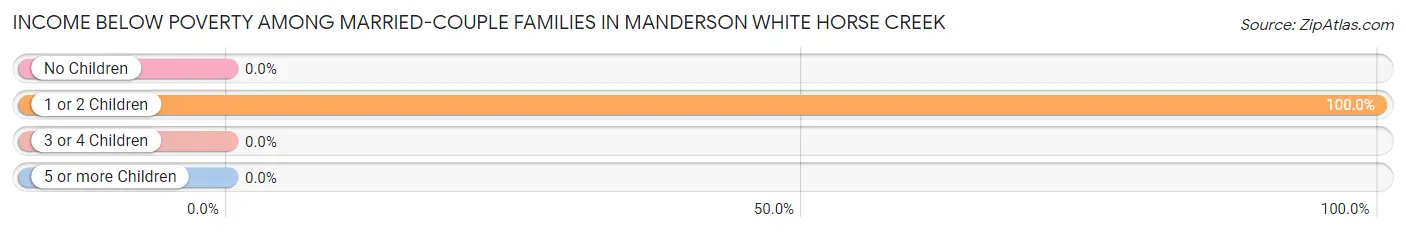
| Children | Above Poverty | Below Poverty |
| No Children | 0 (0.0%) | 0 (0.0%) |
| 1 or 2 Children | 0 (0.0%) | 6 (100.0%) |
| 3 or 4 Children | 0 (0.0%) | 0 (0.0%) |
| 5 or more Children | 0 (0.0%) | 0 (0.0%) |
| Total | 0 (0.0%) | 6 (100.0%) |
Income Below Poverty Among Single-Parent Households in Manderson White Horse Creek
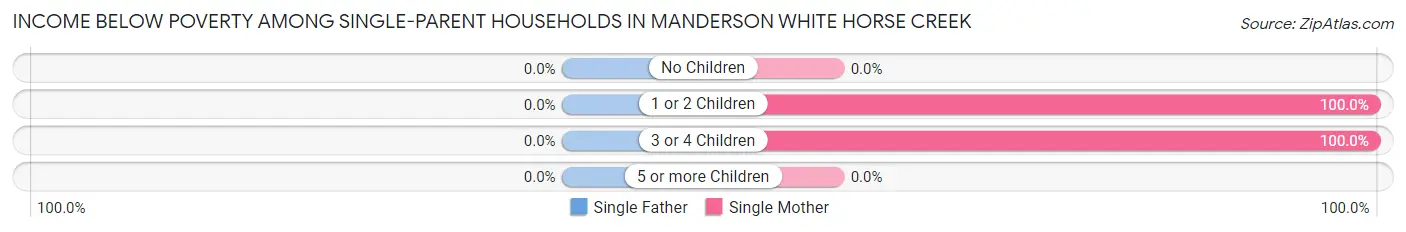
| Children | Single Father | Single Mother |
| No Children | 0 (0.0%) | 0 (0.0%) |
| 1 or 2 Children | 0 (0.0%) | 46 (100.0%) |
| 3 or 4 Children | 0 (0.0%) | 48 (100.0%) |
| 5 or more Children | 0 (0.0%) | 0 (0.0%) |
| Total | 0 (0.0%) | 94 (100.0%) |
Income Below Poverty Among Married-Couple vs Single-Parent Households in Manderson White Horse Creek
The poverty data for Manderson White Horse Creek shows that 6 of the married-couple family households (100.0%) and 94 of the single-parent households (100.0%) are living below the poverty level. Within the married-couple family households, those with 1 or 2 children have the highest poverty rate, with 6 households (100.0%) falling below the poverty line. Among the single-parent households, those with 1 or 2 children have the highest poverty rate, with 46 household (100.0%) living below poverty.
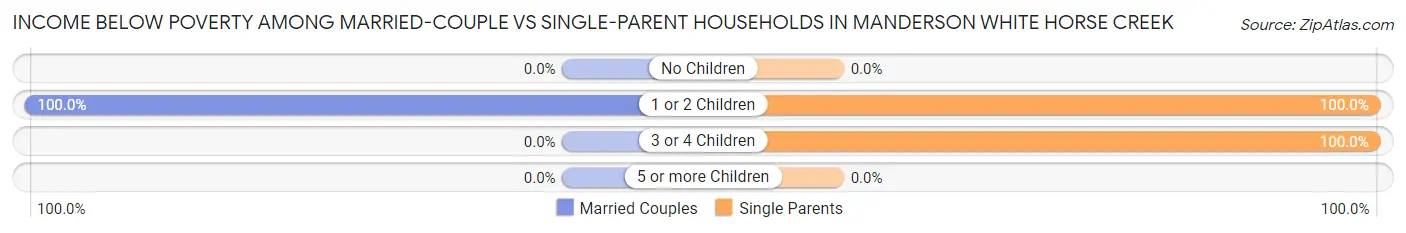
| Children | Married-Couple Families | Single-Parent Households |
| No Children | 0 (0.0%) | 0 (0.0%) |
| 1 or 2 Children | 6 (100.0%) | 46 (100.0%) |
| 3 or 4 Children | 0 (0.0%) | 48 (100.0%) |
| 5 or more Children | 0 (0.0%) | 0 (0.0%) |
| Total | 6 (100.0%) | 94 (100.0%) |
Race in Manderson White Horse Creek
The most populous races in Manderson White Horse Creek are , and Native / Alaskan (641 | 100.0%).
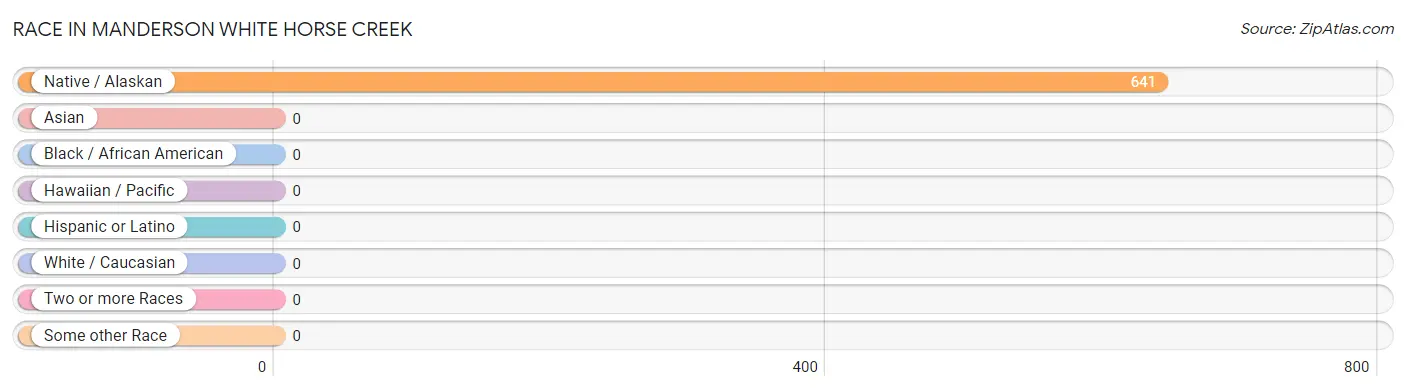
| Race | # Population | % Population |
| Asian | 0 | 0.0% |
| Black / African American | 0 | 0.0% |
| Hawaiian / Pacific | 0 | 0.0% |
| Hispanic or Latino | 0 | 0.0% |
| Native / Alaskan | 641 | 100.0% |
| White / Caucasian | 0 | 0.0% |
| Two or more Races | 0 | 0.0% |
| Some other Race | 0 | 0.0% |
| Total | 641 | 100.0% |
Ancestry in Manderson White Horse Creek
The most populous ancestries reported in Manderson White Horse Creek are Sioux (557 | 86.9%), and Apache (46 | 7.2%), together accounting for 94.1% of all Manderson White Horse Creek residents.
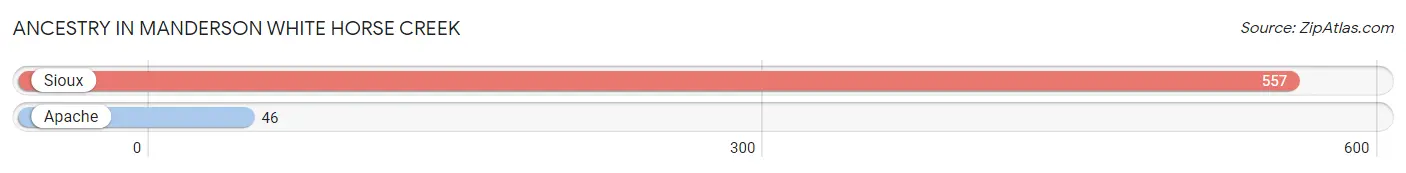
| Ancestry | # Population | % Population |
| Apache | 46 | 7.2% |
| Sioux | 557 | 86.9% | View All 2 Rows |
Immigrants in Manderson White Horse Creek

| Immigration Origin | # Population | % Population | View All 0 Rows |
Sex and Age in Manderson White Horse Creek
Sex and Age in Manderson White Horse Creek
The most populous age groups in Manderson White Horse Creek are 35 to 39 Years (64 | 22.8%) for men and Under 5 Years (110 | 30.6%) for women.
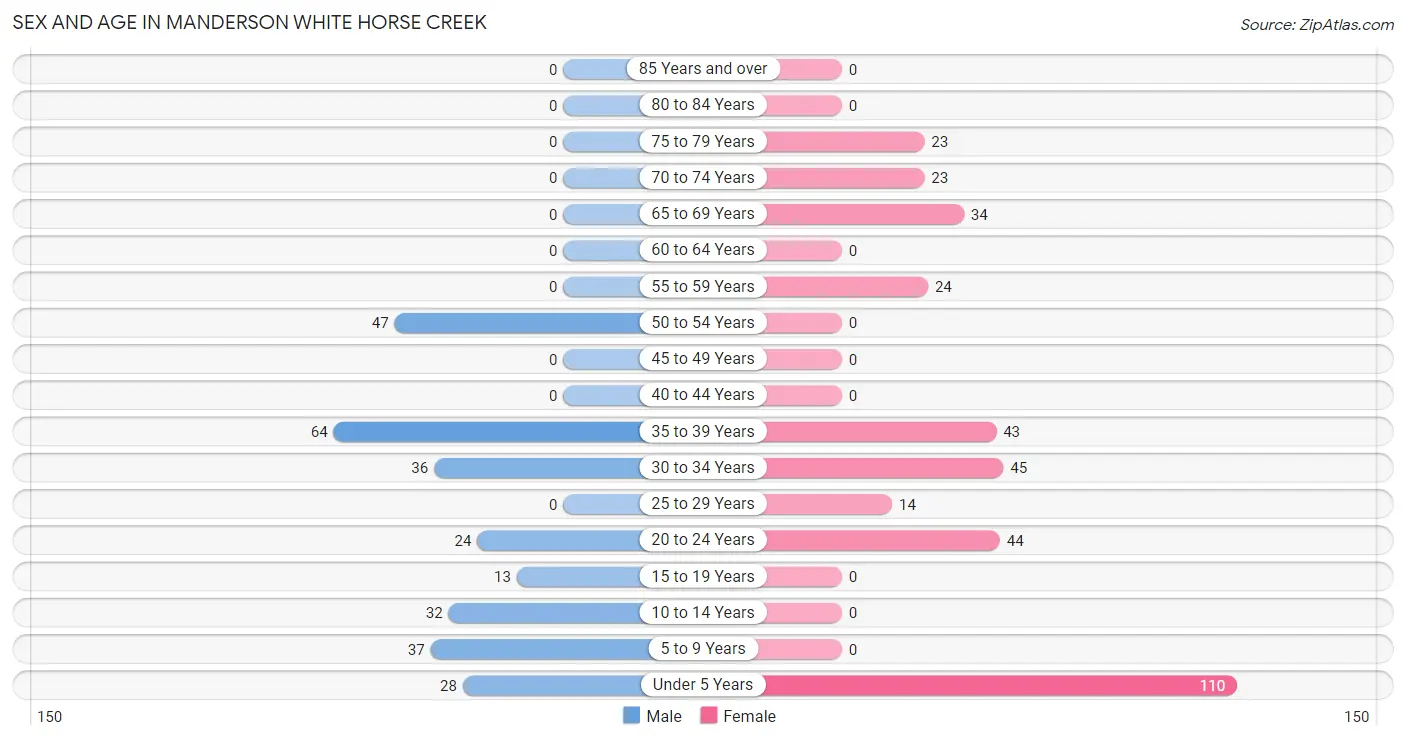
| Age Bracket | Male | Female |
| Under 5 Years | 28 (10.0%) | 110 (30.6%) |
| 5 to 9 Years | 37 (13.2%) | 0 (0.0%) |
| 10 to 14 Years | 32 (11.4%) | 0 (0.0%) |
| 15 to 19 Years | 13 (4.6%) | 0 (0.0%) |
| 20 to 24 Years | 24 (8.5%) | 44 (12.2%) |
| 25 to 29 Years | 0 (0.0%) | 14 (3.9%) |
| 30 to 34 Years | 36 (12.8%) | 45 (12.5%) |
| 35 to 39 Years | 64 (22.8%) | 43 (11.9%) |
| 40 to 44 Years | 0 (0.0%) | 0 (0.0%) |
| 45 to 49 Years | 0 (0.0%) | 0 (0.0%) |
| 50 to 54 Years | 47 (16.7%) | 0 (0.0%) |
| 55 to 59 Years | 0 (0.0%) | 24 (6.7%) |
| 60 to 64 Years | 0 (0.0%) | 0 (0.0%) |
| 65 to 69 Years | 0 (0.0%) | 34 (9.4%) |
| 70 to 74 Years | 0 (0.0%) | 23 (6.4%) |
| 75 to 79 Years | 0 (0.0%) | 23 (6.4%) |
| 80 to 84 Years | 0 (0.0%) | 0 (0.0%) |
| 85 Years and over | 0 (0.0%) | 0 (0.0%) |
| Total | 281 (100.0%) | 360 (100.0%) |
Families and Households in Manderson White Horse Creek
Median Family Size in Manderson White Horse Creek
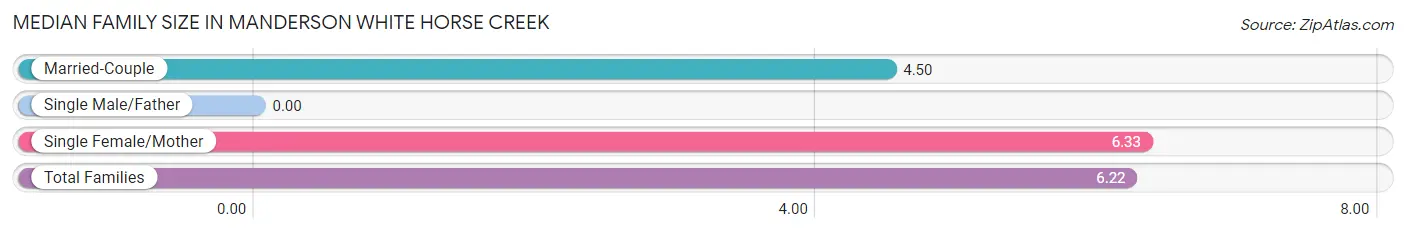
| Family Type | # Families | Family Size |
| Married-Couple | 6 (6.0%) | 4.50 |
| Single Male/Father | 0 (0.0%) | - |
| Single Female/Mother | 94 (94.0%) | 6.33 |
| Total Families | 100 (100.0%) | 6.22 |
Median Household Size in Manderson White Horse Creek
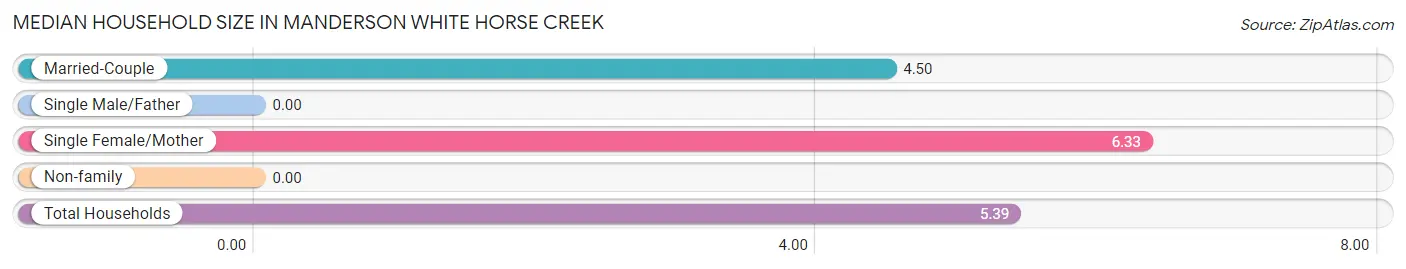
| Household Type | # Households | Household Size |
| Married-Couple | 6 (5.0%) | 4.50 |
| Single Male/Father | 0 (0.0%) | - |
| Single Female/Mother | 94 (79.0%) | 6.33 |
| Non-family | 19 (16.0%) | - |
| Total Households | 119 (100.0%) | 5.39 |
Household Size by Marriage Status in Manderson White Horse Creek
Out of a total of 119 households in Manderson White Horse Creek, 100 (84.0%) are family households, while 19 (16.0%) are nonfamily households. The most numerous type of family households are 5-person households, comprising 46, and the most common type of nonfamily households are 1-person households, comprising 19.
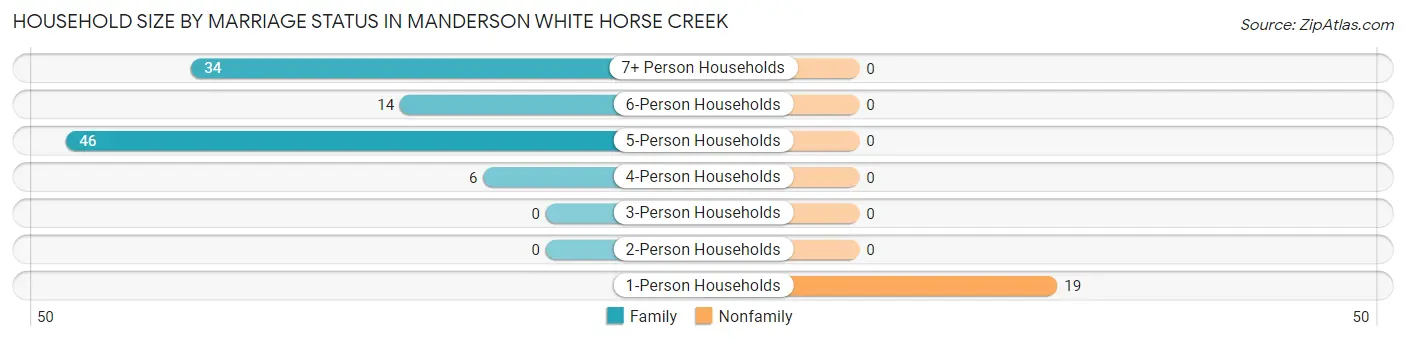
| Household Size | Family Households | Nonfamily Households |
| 1-Person Households | - | 19 (16.0%) |
| 2-Person Households | 0 (0.0%) | 0 (0.0%) |
| 3-Person Households | 0 (0.0%) | 0 (0.0%) |
| 4-Person Households | 6 (5.0%) | 0 (0.0%) |
| 5-Person Households | 46 (38.7%) | 0 (0.0%) |
| 6-Person Households | 14 (11.8%) | 0 (0.0%) |
| 7+ Person Households | 34 (28.6%) | 0 (0.0%) |
| Total | 100 (84.0%) | 19 (16.0%) |
Female Fertility in Manderson White Horse Creek
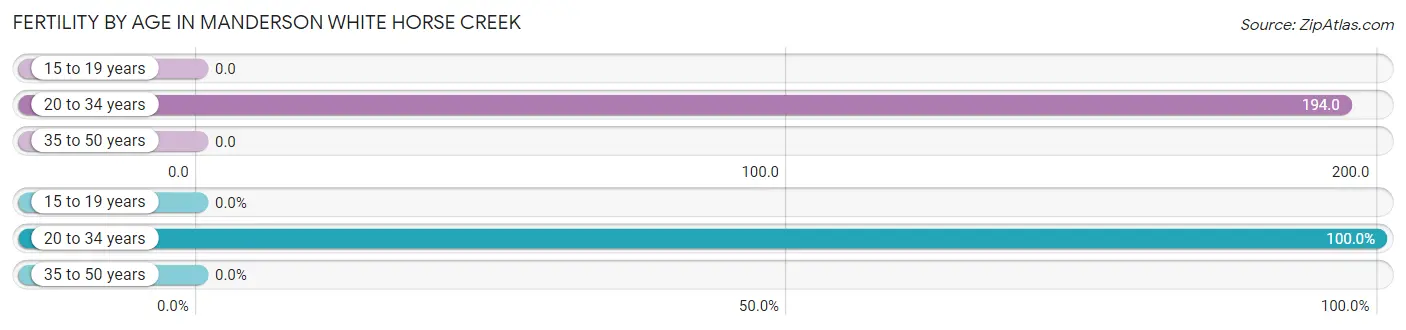
Fertility by Age in Manderson White Horse Creek
Average fertility rate in Manderson White Horse Creek is 137.0 births per 1,000 women. Women in the age bracket of 20 to 34 years have the highest fertility rate with 194.0 births per 1,000 women. Women in the age bracket of 20 to 34 years acount for 100.0% of all women with births.
| Age Bracket | Women with Births | Births / 1,000 Women |
| 15 to 19 years | 0 (0.0%) | 0.0 |
| 20 to 34 years | 20 (100.0%) | 194.0 |
| 35 to 50 years | 0 (0.0%) | 0.0 |
| Total | 20 (100.0%) | 137.0 |
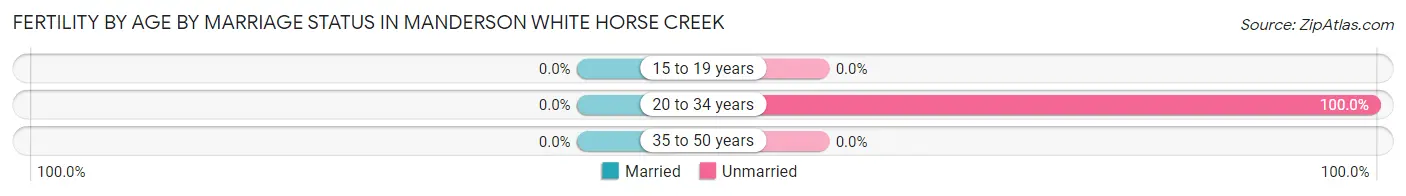
Fertility by Age by Marriage Status in Manderson White Horse Creek
| Age Bracket | Married | Unmarried |
| 15 to 19 years | 0 (0.0%) | 0 (0.0%) |
| 20 to 34 years | 0 (0.0%) | 20 (100.0%) |
| 35 to 50 years | 0 (0.0%) | 0 (0.0%) |
| Total | 0 (0.0%) | 20 (100.0%) |
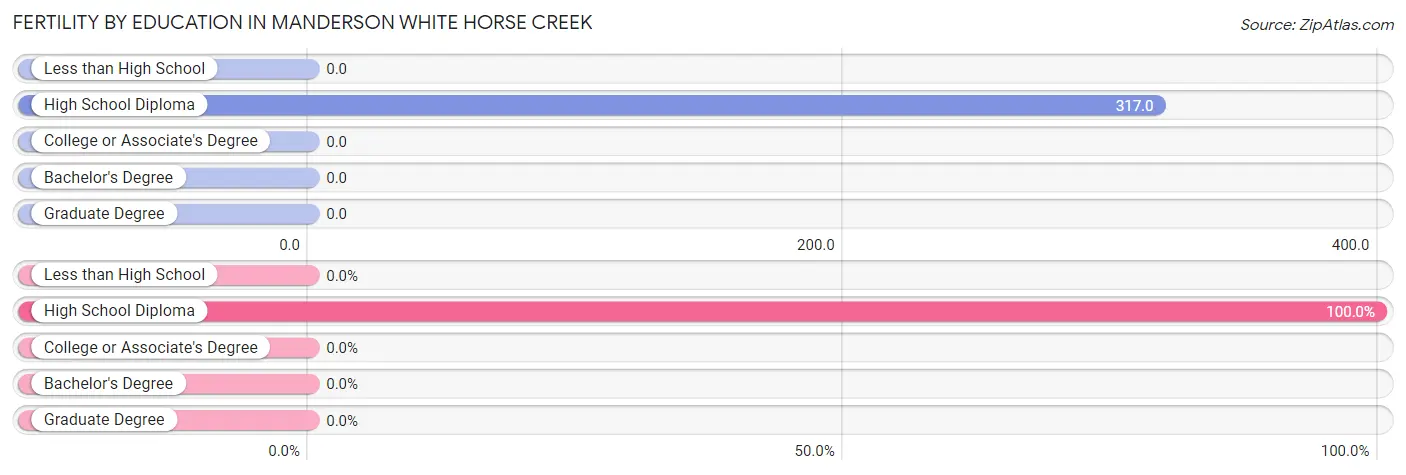
Fertility by Education in Manderson White Horse Creek
| Educational Attainment | Women with Births | Births / 1,000 Women |
| Less than High School | 0 (0.0%) | 0.0 |
| High School Diploma | 20 (100.0%) | 317.0 |
| College or Associate's Degree | 0 (0.0%) | 0.0 |
| Bachelor's Degree | 0 (0.0%) | 0.0 |
| Graduate Degree | 0 (0.0%) | 0.0 |
| Total | 20 (100.0%) | 137.0 |
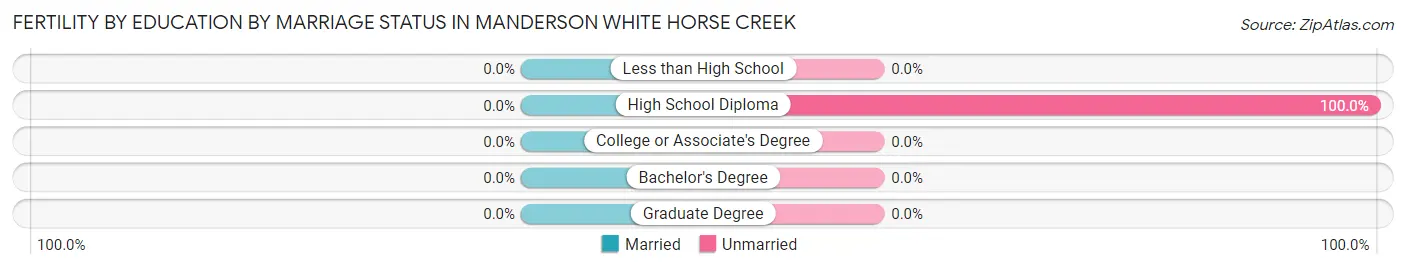
Fertility by Education by Marriage Status in Manderson White Horse Creek
| Educational Attainment | Married | Unmarried |
| Less than High School | 0 (0.0%) | 0 (0.0%) |
| High School Diploma | 0 (0.0%) | 20 (100.0%) |
| College or Associate's Degree | 0 (0.0%) | 0 (0.0%) |
| Bachelor's Degree | 0 (0.0%) | 0 (0.0%) |
| Graduate Degree | 0 (0.0%) | 0 (0.0%) |
| Total | 0 (0.0%) | 20 (100.0%) |
Employment Characteristics in Manderson White Horse Creek
Employment by Class of Employer in Manderson White Horse Creek
Among the 55 employed individuals in Manderson White Horse Creek, federal government employees (25 | 45.5%), local government employees (24 | 43.6%), and not-for-profit organizations (6 | 10.9%) make up the most common classes of employment.
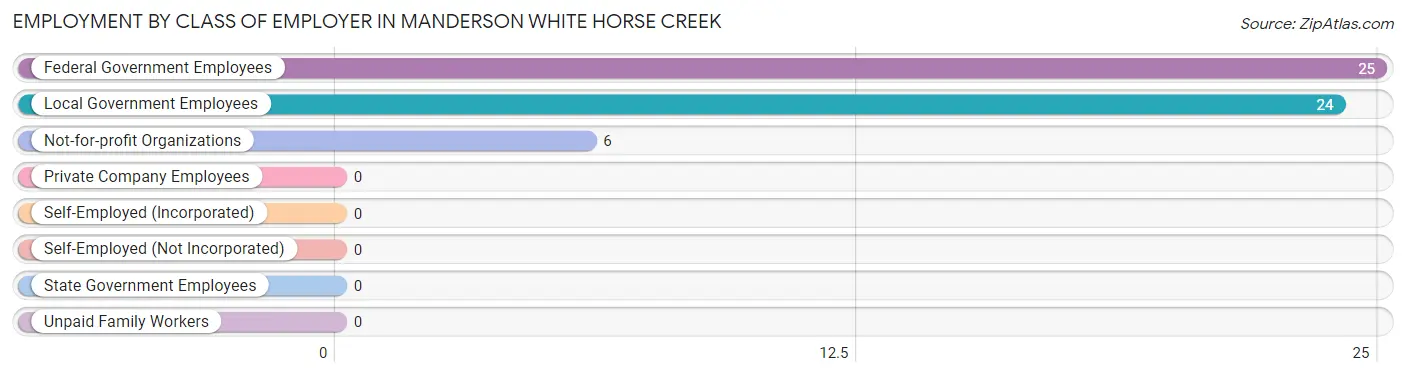
| Employer Class | # Employees | % Employees |
| Private Company Employees | 0 | 0.0% |
| Self-Employed (Incorporated) | 0 | 0.0% |
| Self-Employed (Not Incorporated) | 0 | 0.0% |
| Not-for-profit Organizations | 6 | 10.9% |
| Local Government Employees | 24 | 43.6% |
| State Government Employees | 0 | 0.0% |
| Federal Government Employees | 25 | 45.5% |
| Unpaid Family Workers | 0 | 0.0% |
| Total | 55 | 100.0% |
Employment Status by Age in Manderson White Horse Creek
According to the labor force statistics for Manderson White Horse Creek, out of the total population over 16 years of age (429), 14.0% or 60 individuals are in the labor force, with 8.3% or 5 of them unemployed. The age group with the highest labor force participation rate is 55 to 59 years, with 100.0% or 24 individuals in the labor force. Within the labor force, the 35 to 44 years age range has the highest percentage of unemployed individuals, with 100.0% or 5 of them being unemployed.
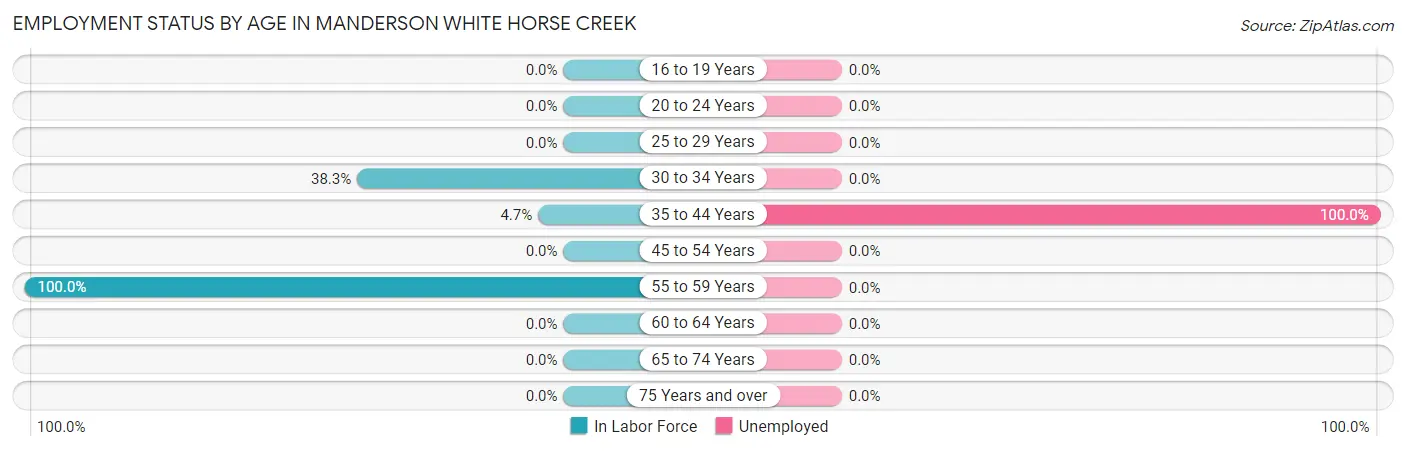
| Age Bracket | In Labor Force | Unemployed |
| 16 to 19 Years | 0 (0.0%) | 0 (0.0%) |
| 20 to 24 Years | 0 (0.0%) | 0 (0.0%) |
| 25 to 29 Years | 0 (0.0%) | 0 (0.0%) |
| 30 to 34 Years | 31 (38.3%) | 0 (0.0%) |
| 35 to 44 Years | 5 (4.7%) | 5 (100.0%) |
| 45 to 54 Years | 0 (0.0%) | 0 (0.0%) |
| 55 to 59 Years | 24 (100.0%) | 0 (0.0%) |
| 60 to 64 Years | 0 (0.0%) | 0 (0.0%) |
| 65 to 74 Years | 0 (0.0%) | 0 (0.0%) |
| 75 Years and over | 0 (0.0%) | 0 (0.0%) |
| Total | 60 (14.0%) | 5 (8.3%) |
Employment Status by Educational Attainment in Manderson White Horse Creek
According to labor force statistics for Manderson White Horse Creek, 22.0% of individuals (60) out of the total population between 25 and 64 years of age (273) are in the labor force, with 8.3% or 5 of them being unemployed. The group with the highest labor force participation rate are those with the educational attainment of high school diploma, with 34.5% or 49 individuals in the labor force. Within the labor force, individuals with college / associate degree education have the highest percentage of unemployment, with 100.0% or 5 of them being unemployed.
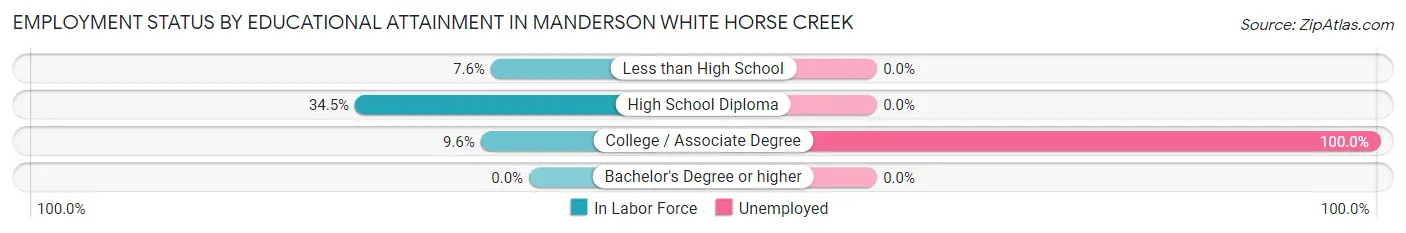
| Educational Attainment | In Labor Force | Unemployed |
| Less than High School | 6 (7.6%) | 0 (0.0%) |
| High School Diploma | 49 (34.5%) | 0 (0.0%) |
| College / Associate Degree | 5 (9.6%) | 52 (100.0%) |
| Bachelor's Degree or higher | 0 (0.0%) | 0 (0.0%) |
| Total | 60 (22.0%) | 23 (8.3%) |
Employment Occupations by Sex in Manderson White Horse Creek
Management, Business, Science and Arts Occupations
Management, Business, Science and Arts Occupations by Sex
| Occupation | Male | Female |
| Management | 0 (0.0%) | 0 (0.0%) |
| Business & Financial | 0 (0.0%) | 0 (0.0%) |
| Computers, Engineering & Science | 0 (0.0%) | 0 (0.0%) |
| Computers & Mathematics | 0 (0.0%) | 0 (0.0%) |
| Architecture & Engineering | 0 (0.0%) | 0 (0.0%) |
| Life, Physical & Social Science | 0 (0.0%) | 0 (0.0%) |
| Community & Social Service | 0 (0.0%) | 0 (0.0%) |
| Education, Arts & Media | 0 (0.0%) | 0 (0.0%) |
| Legal Services & Support | 0 (0.0%) | 0 (0.0%) |
| Education Instruction & Library | 0 (0.0%) | 0 (0.0%) |
| Arts, Media & Entertainment | 0 (0.0%) | 0 (0.0%) |
| Health Diagnosing & Treating | 0 (0.0%) | 0 (0.0%) |
| Health Technologists | 0 (0.0%) | 0 (0.0%) |
| Total (Category) | 0 (0.0%) | 0 (0.0%) |
| Total (Overall) | 25 (45.5%) | 30 (54.5%) |
Services Occupations
The most common Services occupations in Manderson White Horse Creek are , and Healthcare Support (6 | 10.9%).
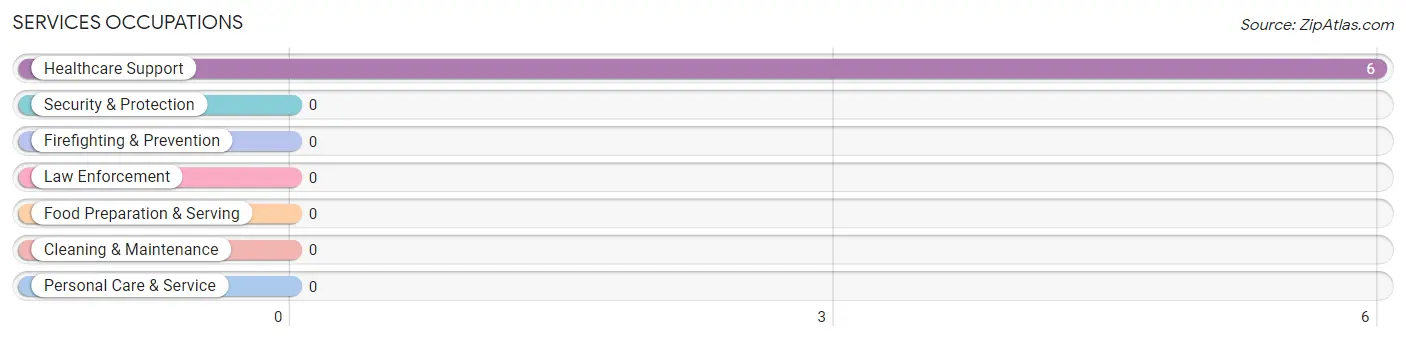
Services Occupations by Sex
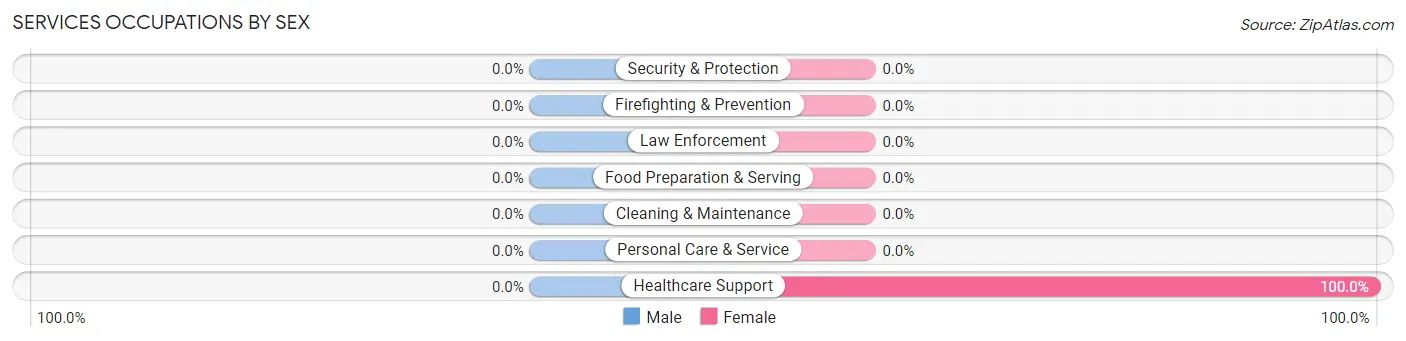
| Occupation | Male | Female |
| Healthcare Support | 0 (0.0%) | 6 (100.0%) |
| Security & Protection | 0 (0.0%) | 0 (0.0%) |
| Firefighting & Prevention | 0 (0.0%) | 0 (0.0%) |
| Law Enforcement | 0 (0.0%) | 0 (0.0%) |
| Food Preparation & Serving | 0 (0.0%) | 0 (0.0%) |
| Cleaning & Maintenance | 0 (0.0%) | 0 (0.0%) |
| Personal Care & Service | 0 (0.0%) | 0 (0.0%) |
| Total (Category) | 0 (0.0%) | 6 (100.0%) |
| Total (Overall) | 25 (45.5%) | 30 (54.5%) |
Sales and Office Occupations
The most common Sales and Office occupations in Manderson White Horse Creek are , and Office & Administration (24 | 43.6%).
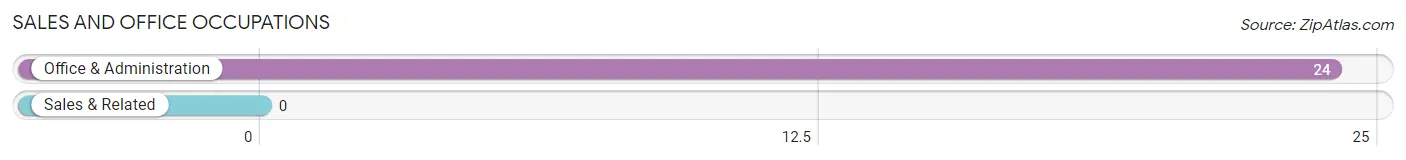
Sales and Office Occupations by Sex
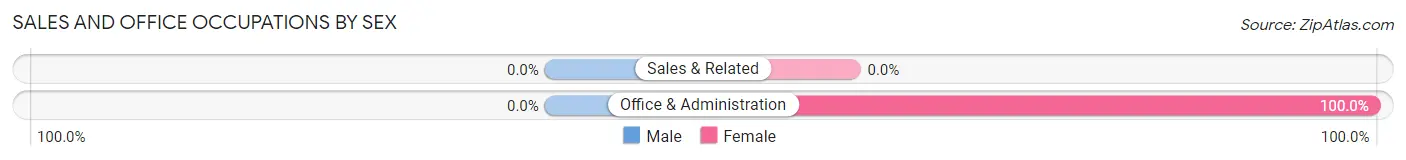
| Occupation | Male | Female |
| Sales & Related | 0 (0.0%) | 0 (0.0%) |
| Office & Administration | 0 (0.0%) | 24 (100.0%) |
| Total (Category) | 0 (0.0%) | 24 (100.0%) |
| Total (Overall) | 25 (45.5%) | 30 (54.5%) |
Natural Resources, Construction and Maintenance Occupations
Natural Resources, Construction and Maintenance Occupations by Sex
| Occupation | Male | Female |
| Farming, Fishing & Forestry | 0 (0.0%) | 0 (0.0%) |
| Construction & Extraction | 0 (0.0%) | 0 (0.0%) |
| Installation, Maintenance & Repair | 0 (0.0%) | 0 (0.0%) |
| Total (Category) | 0 (0.0%) | 0 (0.0%) |
| Total (Overall) | 25 (45.5%) | 30 (54.5%) |
Production, Transportation and Moving Occupations
The most common Production, Transportation and Moving occupations in Manderson White Horse Creek are , and Transportation (25 | 45.5%).
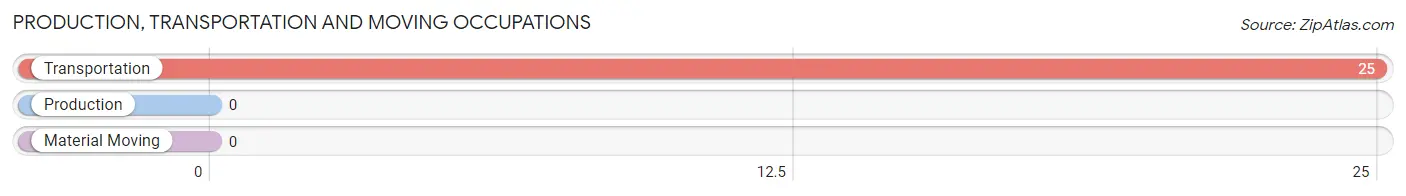
Production, Transportation and Moving Occupations by Sex
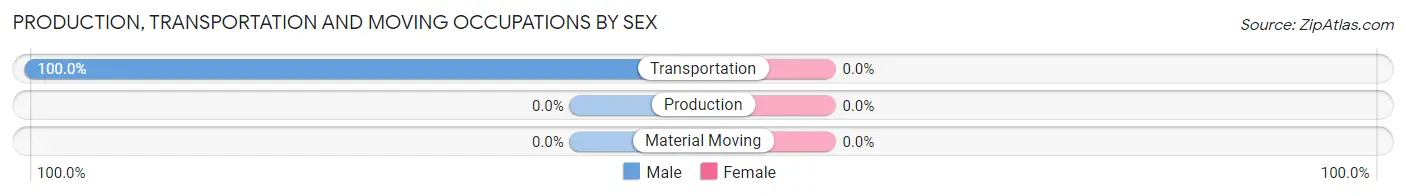
| Occupation | Male | Female |
| Production | 0 (0.0%) | 0 (0.0%) |
| Transportation | 25 (100.0%) | 0 (0.0%) |
| Material Moving | 0 (0.0%) | 0 (0.0%) |
| Total (Category) | 25 (100.0%) | 0 (0.0%) |
| Total (Overall) | 25 (45.5%) | 30 (54.5%) |
Employment Industries by Sex in Manderson White Horse Creek
Employment Industries in Manderson White Horse Creek
The major employment industries in Manderson White Horse Creek include Public Administration (49 | 89.1%), and Health Care & Social Assistance (6 | 10.9%).
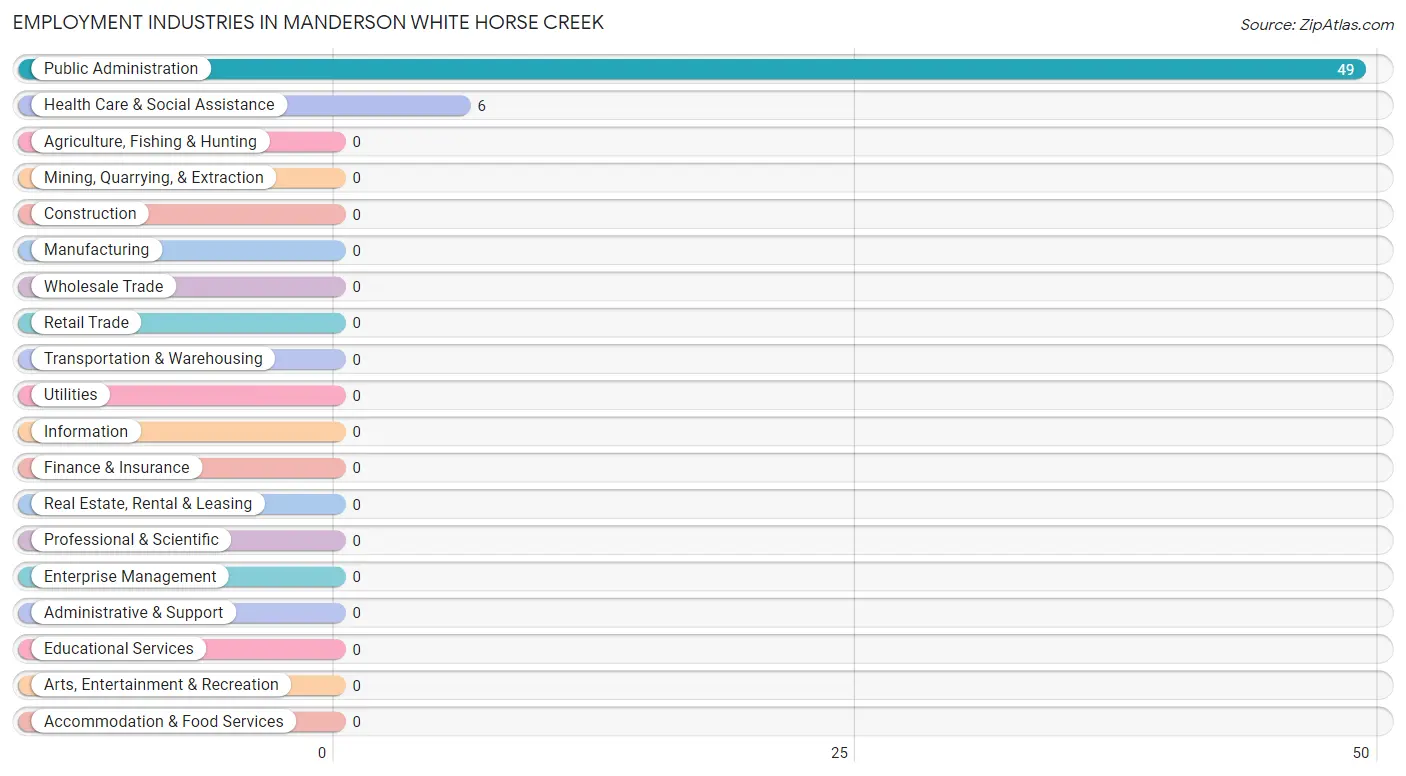
Employment Industries by Sex in Manderson White Horse Creek
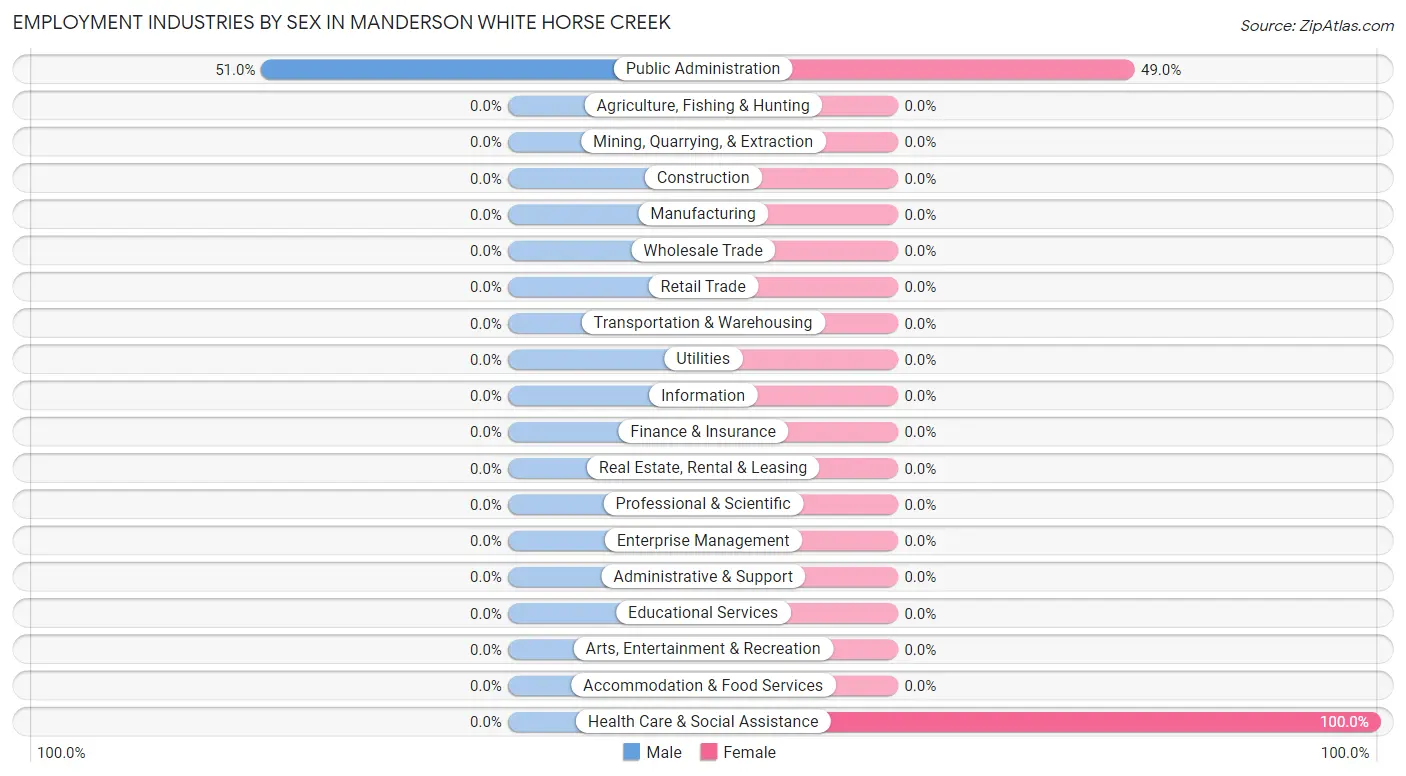
| Industry | Male | Female |
| Agriculture, Fishing & Hunting | 0 (0.0%) | 0 (0.0%) |
| Mining, Quarrying, & Extraction | 0 (0.0%) | 0 (0.0%) |
| Construction | 0 (0.0%) | 0 (0.0%) |
| Manufacturing | 0 (0.0%) | 0 (0.0%) |
| Wholesale Trade | 0 (0.0%) | 0 (0.0%) |
| Retail Trade | 0 (0.0%) | 0 (0.0%) |
| Transportation & Warehousing | 0 (0.0%) | 0 (0.0%) |
| Utilities | 0 (0.0%) | 0 (0.0%) |
| Information | 0 (0.0%) | 0 (0.0%) |
| Finance & Insurance | 0 (0.0%) | 0 (0.0%) |
| Real Estate, Rental & Leasing | 0 (0.0%) | 0 (0.0%) |
| Professional & Scientific | 0 (0.0%) | 0 (0.0%) |
| Enterprise Management | 0 (0.0%) | 0 (0.0%) |
| Administrative & Support | 0 (0.0%) | 0 (0.0%) |
| Educational Services | 0 (0.0%) | 0 (0.0%) |
| Health Care & Social Assistance | 0 (0.0%) | 6 (100.0%) |
| Arts, Entertainment & Recreation | 0 (0.0%) | 0 (0.0%) |
| Accommodation & Food Services | 0 (0.0%) | 0 (0.0%) |
| Public Administration | 25 (51.0%) | 24 (49.0%) |
| Total | 25 (45.5%) | 30 (54.5%) |
Education in Manderson White Horse Creek
School Enrollment in Manderson White Horse Creek
The most common levels of schooling among the 92 students in Manderson White Horse Creek are nursery / preschool (28 | 30.4%), high school (25 | 27.2%), and college / undergraduate (24 | 26.1%).
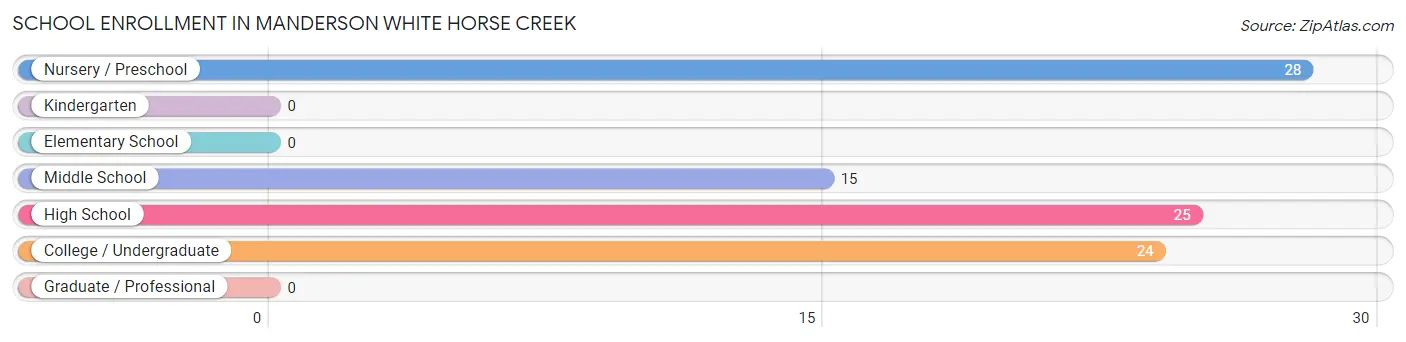
| School Level | # Students | % Students |
| Nursery / Preschool | 28 | 30.4% |
| Kindergarten | 0 | 0.0% |
| Elementary School | 0 | 0.0% |
| Middle School | 15 | 16.3% |
| High School | 25 | 27.2% |
| College / Undergraduate | 24 | 26.1% |
| Graduate / Professional | 0 | 0.0% |
| Total | 92 | 100.0% |
School Enrollment by Age by Funding Source in Manderson White Horse Creek
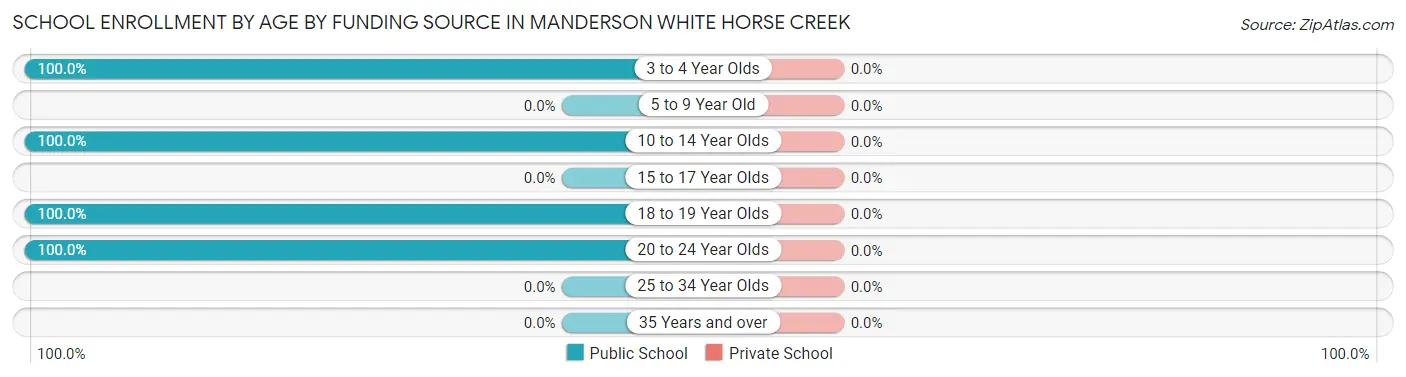
| Age Bracket | Public School | Private School |
| 3 to 4 Year Olds | 28 (100.0%) | 0 (0.0%) |
| 5 to 9 Year Old | 0 (0.0%) | 0 (0.0%) |
| 10 to 14 Year Olds | 32 (100.0%) | 0 (0.0%) |
| 15 to 17 Year Olds | 0 (0.0%) | 0 (0.0%) |
| 18 to 19 Year Olds | 8 (100.0%) | 0 (0.0%) |
| 20 to 24 Year Olds | 24 (100.0%) | 0 (0.0%) |
| 25 to 34 Year Olds | 0 (0.0%) | 0 (0.0%) |
| 35 Years and over | 0 (0.0%) | 0 (0.0%) |
| Total | 92 (100.0%) | 0 (0.0%) |
Educational Attainment by Field of Study in Manderson White Horse Creek
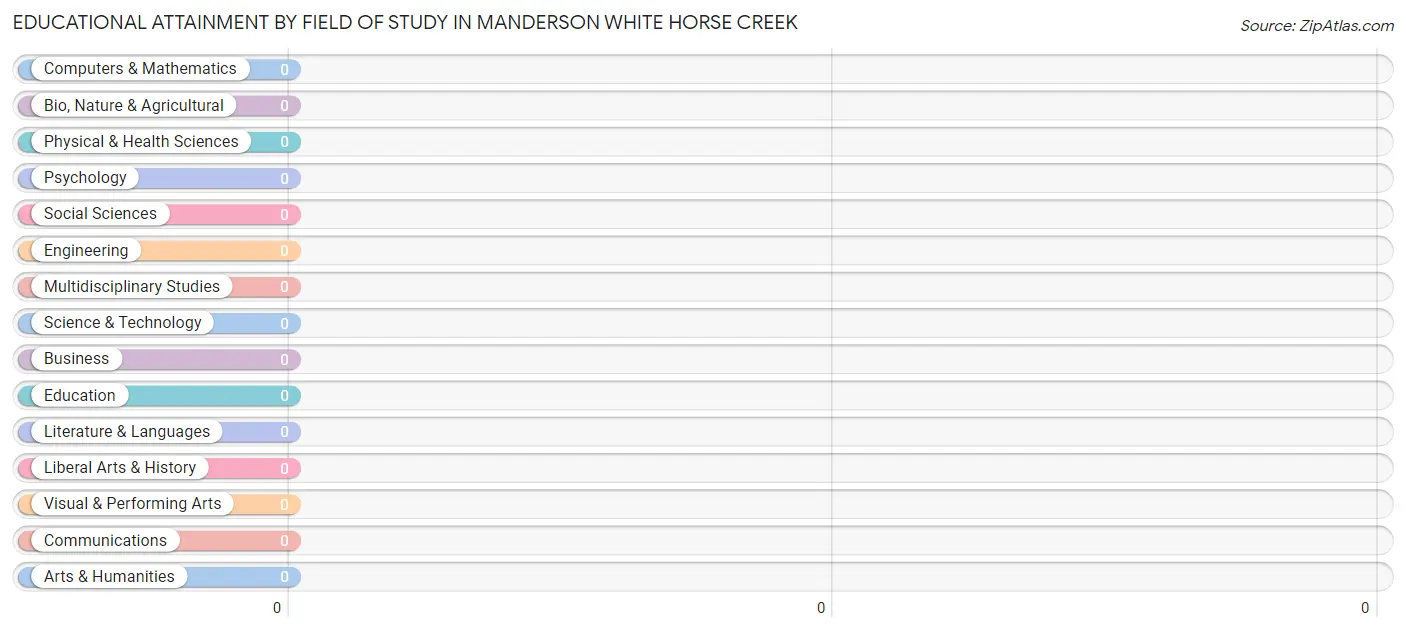
| Field of Study | # Graduates | % Graduates |
| Computers & Mathematics | 0 | 0.0% |
| Bio, Nature & Agricultural | 0 | 0.0% |
| Physical & Health Sciences | 0 | 0.0% |
| Psychology | 0 | 0.0% |
| Social Sciences | 0 | 0.0% |
| Engineering | 0 | 0.0% |
| Multidisciplinary Studies | 0 | 0.0% |
| Science & Technology | 0 | 0.0% |
| Business | 0 | 0.0% |
| Education | 0 | 0.0% |
| Literature & Languages | 0 | 0.0% |
| Liberal Arts & History | 0 | 0.0% |
| Visual & Performing Arts | 0 | 0.0% |
| Communications | 0 | 0.0% |
| Arts & Humanities | 0 | 0.0% |
| Total | 0 | 0.0% |
Transportation & Commute in Manderson White Horse Creek
Vehicle Availability by Sex in Manderson White Horse Creek
The most prevalent vehicle ownership categories in Manderson White Horse Creek are males with 1 vehicle (25, accounting for 100.0%) and females with 1 vehicle (0, making up 83.3%).
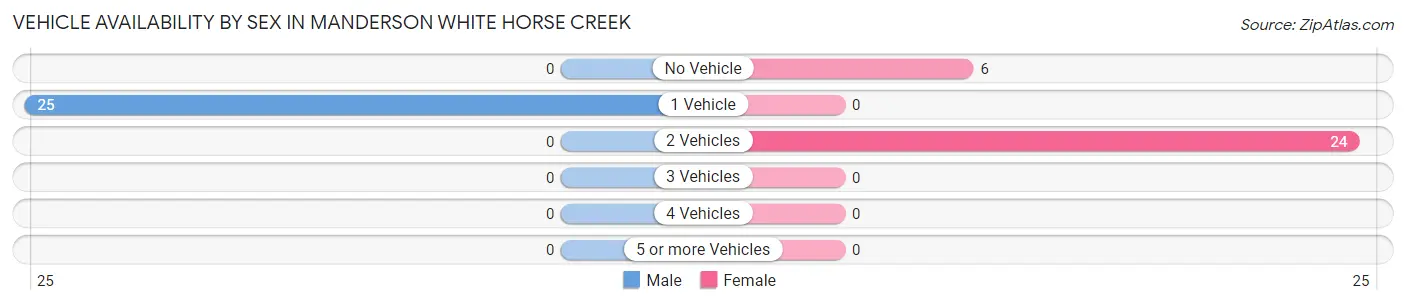
| Vehicles Available | Male | Female |
| No Vehicle | 0 (0.0%) | 6 (20.0%) |
| 1 Vehicle | 25 (100.0%) | 0 (0.0%) |
| 2 Vehicles | 0 (0.0%) | 24 (80.0%) |
| 3 Vehicles | 0 (0.0%) | 0 (0.0%) |
| 4 Vehicles | 0 (0.0%) | 0 (0.0%) |
| 5 or more Vehicles | 0 (0.0%) | 0 (0.0%) |
| Total | 25 (100.0%) | 30 (100.0%) |
Commute Time in Manderson White Horse Creek
The most frequently occuring commute durations in Manderson White Horse Creek are 15 to 19 minutes (25 commuters, 51.0%), 30 to 34 minutes (24 commuters, 49.0%), and less than 5 minutes (0 commuters, 0.0%).
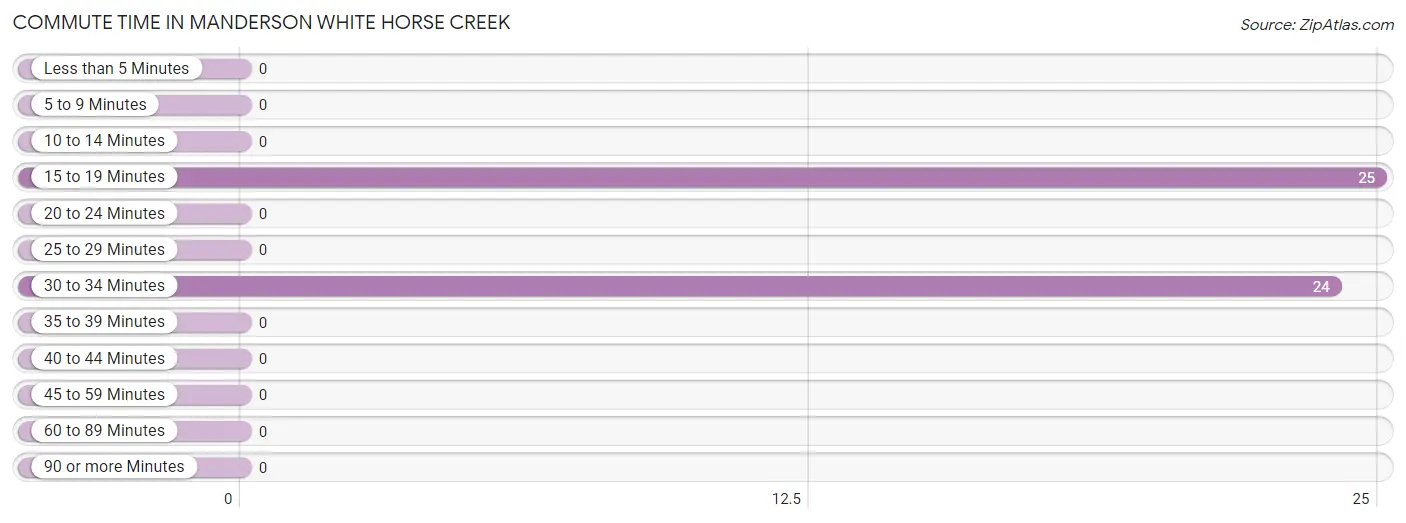
| Commute Time | # Commuters | % Commuters |
| Less than 5 Minutes | 0 | 0.0% |
| 5 to 9 Minutes | 0 | 0.0% |
| 10 to 14 Minutes | 0 | 0.0% |
| 15 to 19 Minutes | 25 | 51.0% |
| 20 to 24 Minutes | 0 | 0.0% |
| 25 to 29 Minutes | 0 | 0.0% |
| 30 to 34 Minutes | 24 | 49.0% |
| 35 to 39 Minutes | 0 | 0.0% |
| 40 to 44 Minutes | 0 | 0.0% |
| 45 to 59 Minutes | 0 | 0.0% |
| 60 to 89 Minutes | 0 | 0.0% |
| 90 or more Minutes | 0 | 0.0% |
Commute Time by Sex in Manderson White Horse Creek
The most common commute times in Manderson White Horse Creek are 15 to 19 minutes (25 commuters, 100.0%) for males and 30 to 34 minutes (24 commuters, 100.0%) for females.
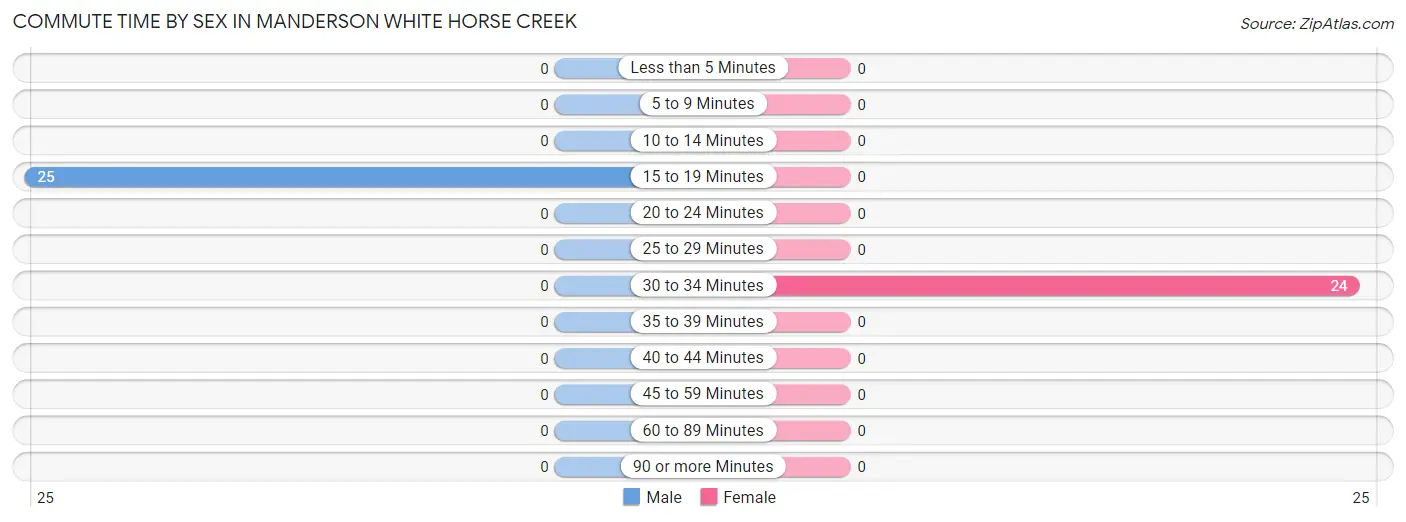
| Commute Time | Male | Female |
| Less than 5 Minutes | 0 (0.0%) | 0 (0.0%) |
| 5 to 9 Minutes | 0 (0.0%) | 0 (0.0%) |
| 10 to 14 Minutes | 0 (0.0%) | 0 (0.0%) |
| 15 to 19 Minutes | 25 (100.0%) | 0 (0.0%) |
| 20 to 24 Minutes | 0 (0.0%) | 0 (0.0%) |
| 25 to 29 Minutes | 0 (0.0%) | 0 (0.0%) |
| 30 to 34 Minutes | 0 (0.0%) | 24 (100.0%) |
| 35 to 39 Minutes | 0 (0.0%) | 0 (0.0%) |
| 40 to 44 Minutes | 0 (0.0%) | 0 (0.0%) |
| 45 to 59 Minutes | 0 (0.0%) | 0 (0.0%) |
| 60 to 89 Minutes | 0 (0.0%) | 0 (0.0%) |
| 90 or more Minutes | 0 (0.0%) | 0 (0.0%) |
Time of Departure to Work by Sex in Manderson White Horse Creek
The most frequent times of departure to work in Manderson White Horse Creek are 6:30 AM to 6:59 AM (25, 100.0%) for males and 7:00 AM to 7:29 AM (24, 100.0%) for females.
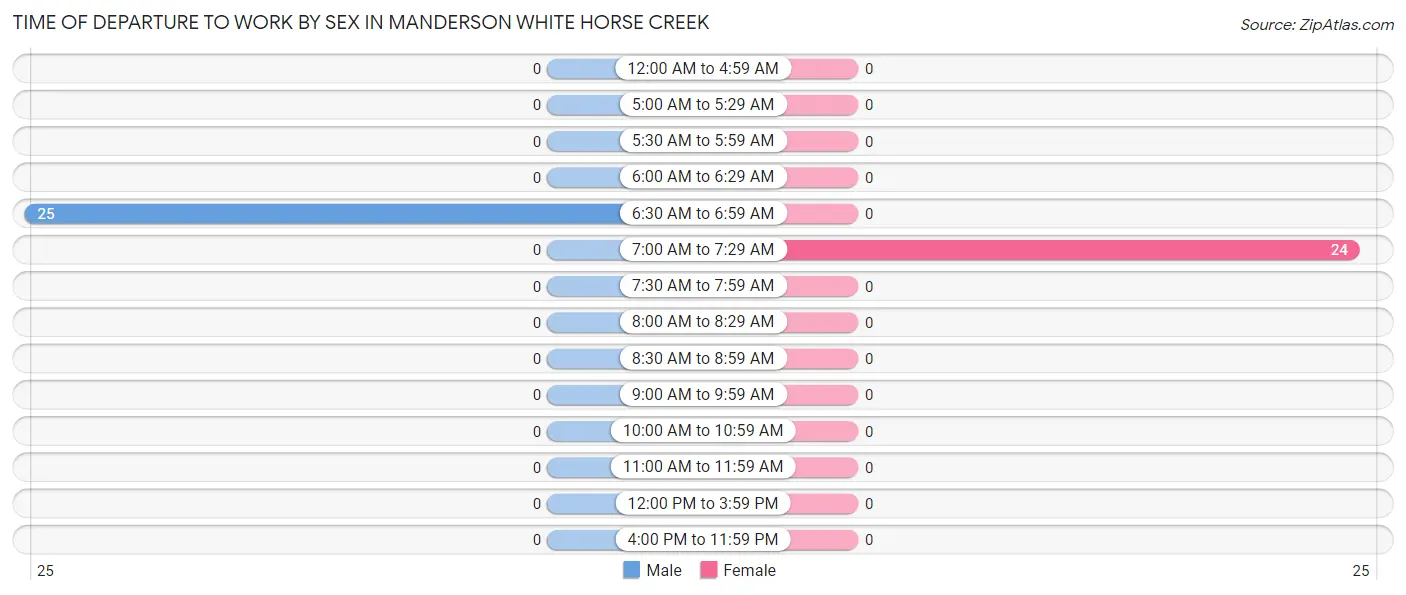
| Time of Departure | Male | Female |
| 12:00 AM to 4:59 AM | 0 (0.0%) | 0 (0.0%) |
| 5:00 AM to 5:29 AM | 0 (0.0%) | 0 (0.0%) |
| 5:30 AM to 5:59 AM | 0 (0.0%) | 0 (0.0%) |
| 6:00 AM to 6:29 AM | 0 (0.0%) | 0 (0.0%) |
| 6:30 AM to 6:59 AM | 25 (100.0%) | 0 (0.0%) |
| 7:00 AM to 7:29 AM | 0 (0.0%) | 24 (100.0%) |
| 7:30 AM to 7:59 AM | 0 (0.0%) | 0 (0.0%) |
| 8:00 AM to 8:29 AM | 0 (0.0%) | 0 (0.0%) |
| 8:30 AM to 8:59 AM | 0 (0.0%) | 0 (0.0%) |
| 9:00 AM to 9:59 AM | 0 (0.0%) | 0 (0.0%) |
| 10:00 AM to 10:59 AM | 0 (0.0%) | 0 (0.0%) |
| 11:00 AM to 11:59 AM | 0 (0.0%) | 0 (0.0%) |
| 12:00 PM to 3:59 PM | 0 (0.0%) | 0 (0.0%) |
| 4:00 PM to 11:59 PM | 0 (0.0%) | 0 (0.0%) |
| Total | 25 (100.0%) | 24 (100.0%) |
Housing Occupancy in Manderson White Horse Creek
Occupancy by Ownership in Manderson White Horse Creek
Of the total 119 dwellings in Manderson White Horse Creek, owner-occupied units account for 0 (0.0%), while renter-occupied units make up 119 (100.0%).
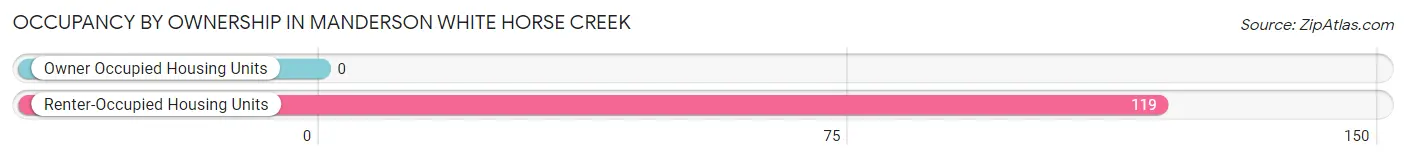
| Occupancy | # Housing Units | % Housing Units |
| Owner Occupied Housing Units | 0 | 0.0% |
| Renter-Occupied Housing Units | 119 | 100.0% |
| Total Occupied Housing Units | 119 | 100.0% |
Occupancy by Household Size in Manderson White Horse Creek
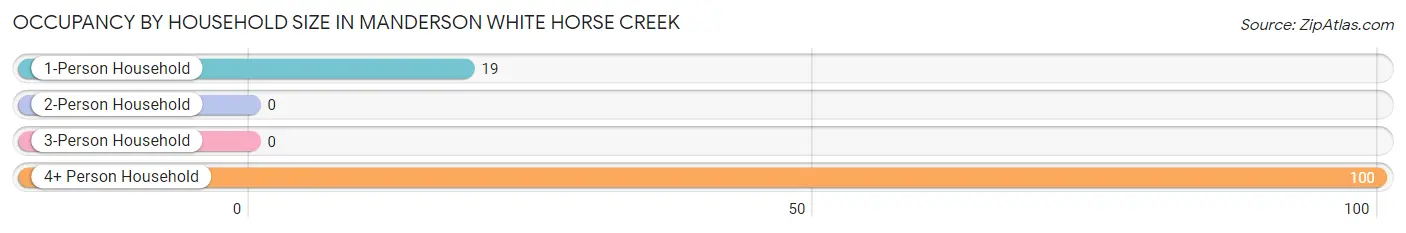
| Household Size | # Housing Units | % Housing Units |
| 1-Person Household | 19 | 16.0% |
| 2-Person Household | 0 | 0.0% |
| 3-Person Household | 0 | 0.0% |
| 4+ Person Household | 100 | 84.0% |
| Total Housing Units | 119 | 100.0% |
Occupancy by Ownership by Household Size in Manderson White Horse Creek
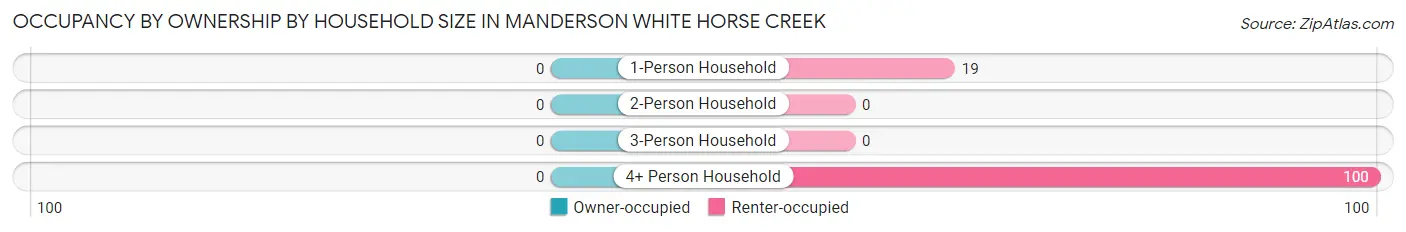
| Household Size | Owner-occupied | Renter-occupied |
| 1-Person Household | 0 (0.0%) | 19 (100.0%) |
| 2-Person Household | 0 (0.0%) | 0 (0.0%) |
| 3-Person Household | 0 (0.0%) | 0 (0.0%) |
| 4+ Person Household | 0 (0.0%) | 100 (100.0%) |
| Total Housing Units | 0 (0.0%) | 119 (100.0%) |
Occupancy by Educational Attainment in Manderson White Horse Creek
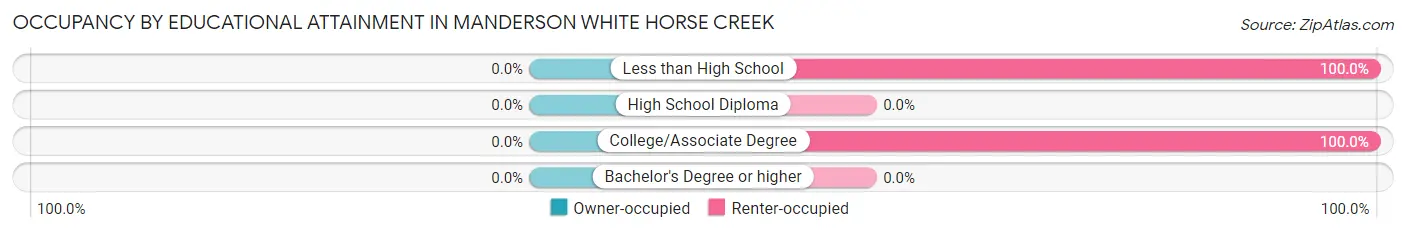
| Household Size | Owner-occupied | Renter-occupied |
| Less than High School | 0 (0.0%) | 39 (100.0%) |
| High School Diploma | 0 (0.0%) | 0 (0.0%) |
| College/Associate Degree | 0 (0.0%) | 80 (100.0%) |
| Bachelor's Degree or higher | 0 (0.0%) | 0 (0.0%) |
Occupancy by Age of Householder in Manderson White Horse Creek
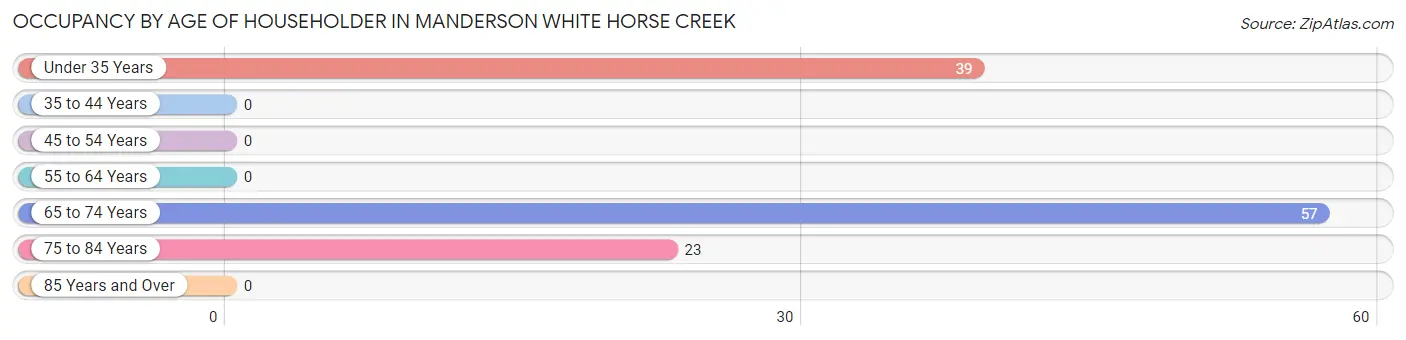
| Age Bracket | # Households | % Households |
| Under 35 Years | 39 | 32.8% |
| 35 to 44 Years | 0 | 0.0% |
| 45 to 54 Years | 0 | 0.0% |
| 55 to 64 Years | 0 | 0.0% |
| 65 to 74 Years | 57 | 47.9% |
| 75 to 84 Years | 23 | 19.3% |
| 85 Years and Over | 0 | 0.0% |
| Total | 119 | 100.0% |
Housing Finances in Manderson White Horse Creek
Median Income by Occupancy in Manderson White Horse Creek
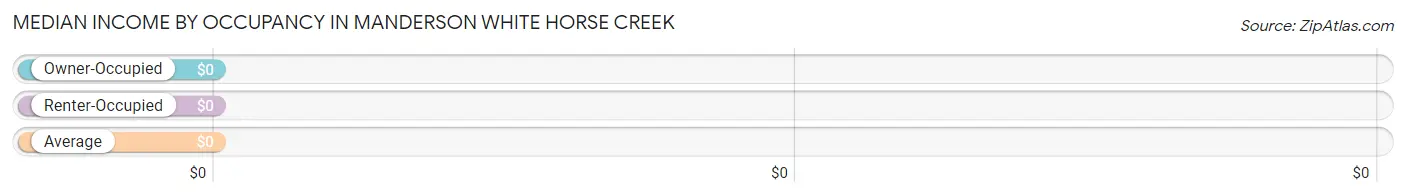
| Occupancy Type | # Households | Median Income |
| Owner-Occupied | 0 (0.0%) | $0 |
| Renter-Occupied | 119 (100.0%) | $0 |
| Average | 119 (100.0%) | $0 |
Occupancy by Householder Income Bracket in Manderson White Horse Creek
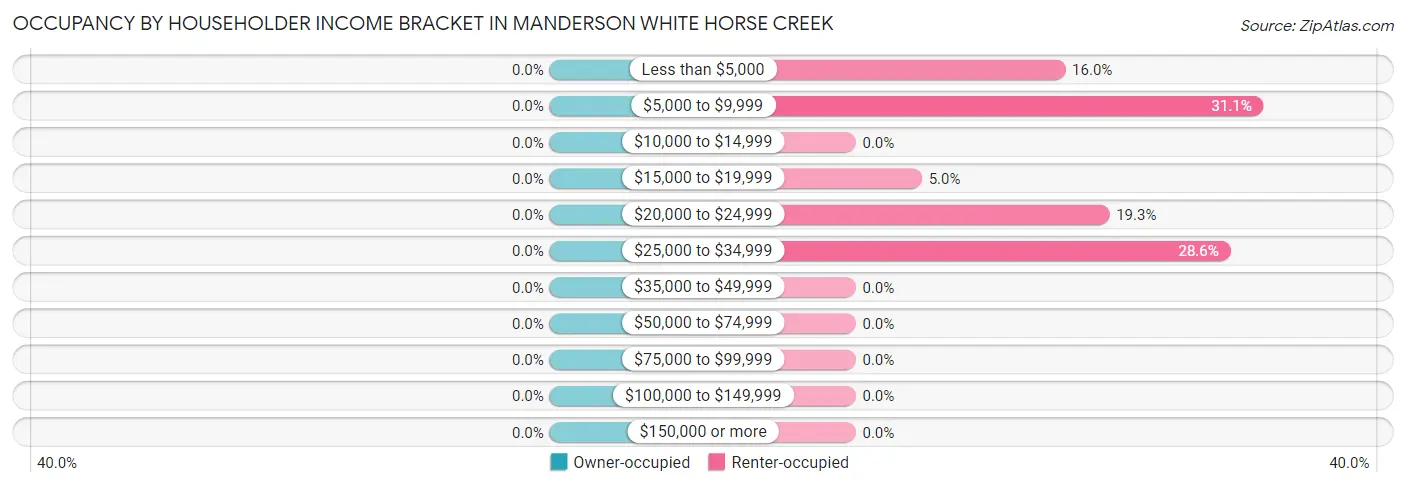
| Income Bracket | Owner-occupied | Renter-occupied |
| Less than $5,000 | 0 (0.0%) | 19 (16.0%) |
| $5,000 to $9,999 | 0 (0.0%) | 37 (31.1%) |
| $10,000 to $14,999 | 0 (0.0%) | 0 (0.0%) |
| $15,000 to $19,999 | 0 (0.0%) | 6 (5.0%) |
| $20,000 to $24,999 | 0 (0.0%) | 23 (19.3%) |
| $25,000 to $34,999 | 0 (0.0%) | 34 (28.6%) |
| $35,000 to $49,999 | 0 (0.0%) | 0 (0.0%) |
| $50,000 to $74,999 | 0 (0.0%) | 0 (0.0%) |
| $75,000 to $99,999 | 0 (0.0%) | 0 (0.0%) |
| $100,000 to $149,999 | 0 (0.0%) | 0 (0.0%) |
| $150,000 or more | 0 (0.0%) | 0 (0.0%) |
| Total | 0 (0.0%) | 119 (100.0%) |
Monthly Housing Cost Tiers in Manderson White Horse Creek
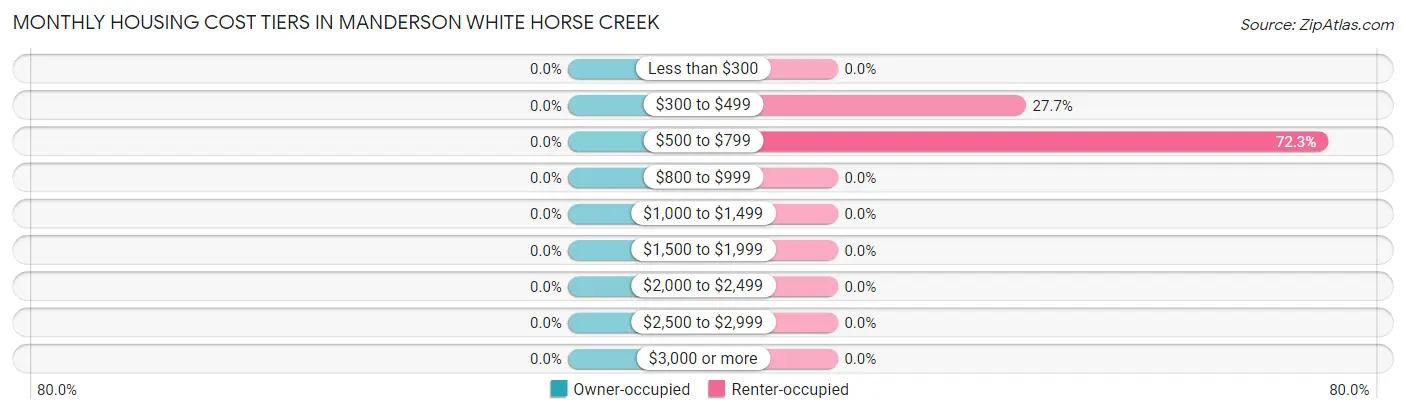
| Monthly Cost | Owner-occupied | Renter-occupied |
| Less than $300 | 0 (0.0%) | 0 (0.0%) |
| $300 to $499 | 0 (0.0%) | 33 (27.7%) |
| $500 to $799 | 0 (0.0%) | 86 (72.3%) |
| $800 to $999 | 0 (0.0%) | 0 (0.0%) |
| $1,000 to $1,499 | 0 (0.0%) | 0 (0.0%) |
| $1,500 to $1,999 | 0 (0.0%) | 0 (0.0%) |
| $2,000 to $2,499 | 0 (0.0%) | 0 (0.0%) |
| $2,500 to $2,999 | 0 (0.0%) | 0 (0.0%) |
| $3,000 or more | 0 (0.0%) | 0 (0.0%) |
| Total | 0 (0.0%) | 119 (100.0%) |
Physical Housing Characteristics in Manderson White Horse Creek
Housing Structures in Manderson White Horse Creek
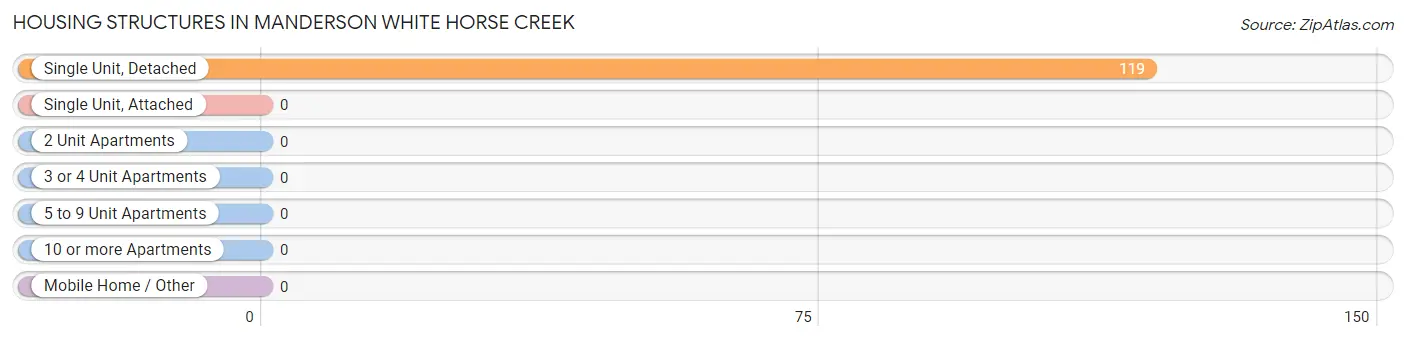
| Structure Type | # Housing Units | % Housing Units |
| Single Unit, Detached | 119 | 100.0% |
| Single Unit, Attached | 0 | 0.0% |
| 2 Unit Apartments | 0 | 0.0% |
| 3 or 4 Unit Apartments | 0 | 0.0% |
| 5 to 9 Unit Apartments | 0 | 0.0% |
| 10 or more Apartments | 0 | 0.0% |
| Mobile Home / Other | 0 | 0.0% |
| Total | 119 | 100.0% |
Housing Structures by Occupancy in Manderson White Horse Creek
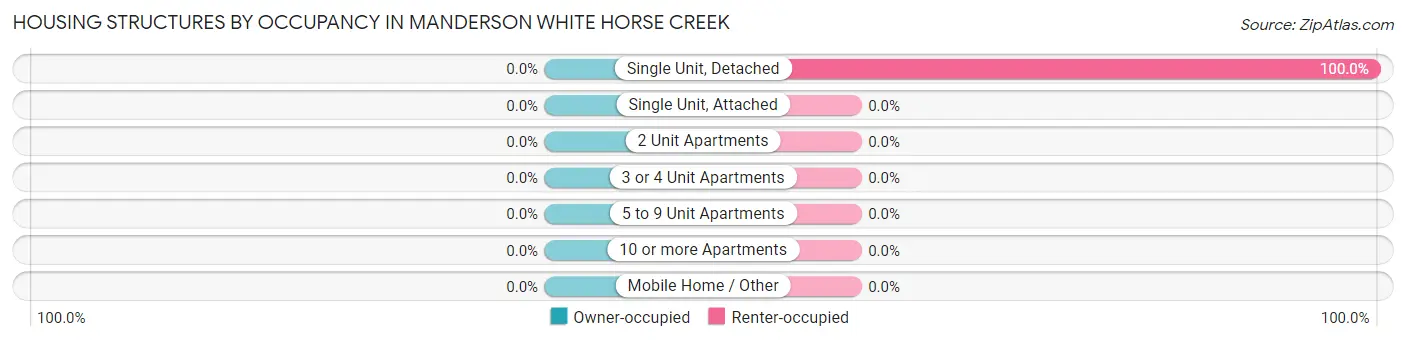
| Structure Type | Owner-occupied | Renter-occupied |
| Single Unit, Detached | 0 (0.0%) | 119 (100.0%) |
| Single Unit, Attached | 0 (0.0%) | 0 (0.0%) |
| 2 Unit Apartments | 0 (0.0%) | 0 (0.0%) |
| 3 or 4 Unit Apartments | 0 (0.0%) | 0 (0.0%) |
| 5 to 9 Unit Apartments | 0 (0.0%) | 0 (0.0%) |
| 10 or more Apartments | 0 (0.0%) | 0 (0.0%) |
| Mobile Home / Other | 0 (0.0%) | 0 (0.0%) |
| Total | 0 (0.0%) | 119 (100.0%) |
Housing Structures by Number of Rooms in Manderson White Horse Creek
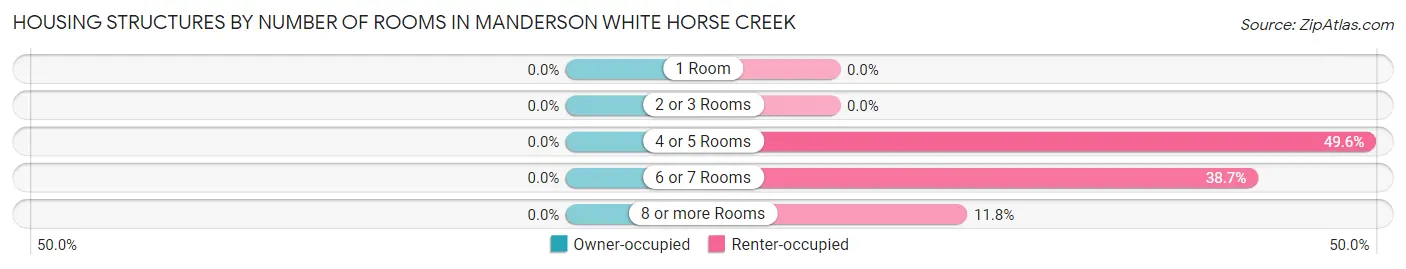
| Number of Rooms | Owner-occupied | Renter-occupied |
| 1 Room | 0 (0.0%) | 0 (0.0%) |
| 2 or 3 Rooms | 0 (0.0%) | 0 (0.0%) |
| 4 or 5 Rooms | 0 (0.0%) | 59 (49.6%) |
| 6 or 7 Rooms | 0 (0.0%) | 46 (38.7%) |
| 8 or more Rooms | 0 (0.0%) | 14 (11.8%) |
| Total | 0 (0.0%) | 119 (100.0%) |
Housing Structure by Heating Type in Manderson White Horse Creek
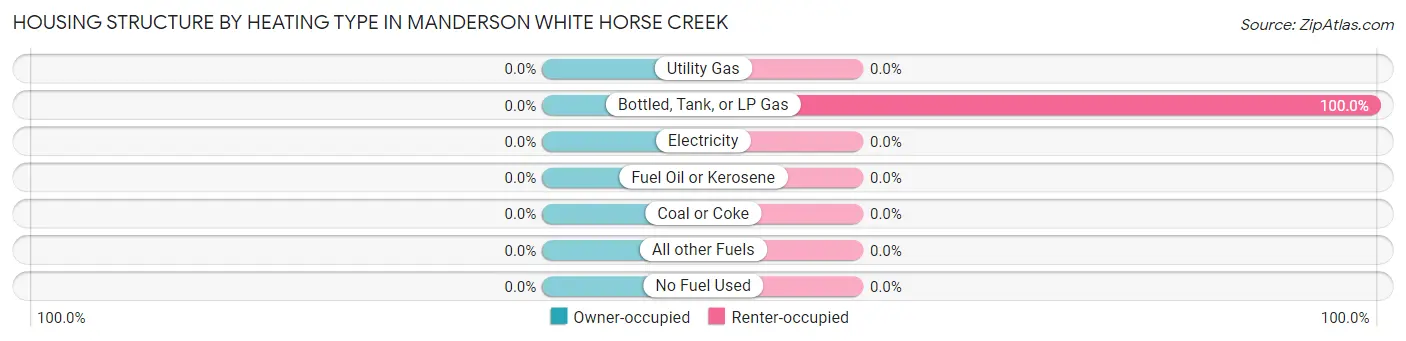
| Heating Type | Owner-occupied | Renter-occupied |
| Utility Gas | 0 (0.0%) | 0 (0.0%) |
| Bottled, Tank, or LP Gas | 0 (0.0%) | 119 (100.0%) |
| Electricity | 0 (0.0%) | 0 (0.0%) |
| Fuel Oil or Kerosene | 0 (0.0%) | 0 (0.0%) |
| Coal or Coke | 0 (0.0%) | 0 (0.0%) |
| All other Fuels | 0 (0.0%) | 0 (0.0%) |
| No Fuel Used | 0 (0.0%) | 0 (0.0%) |
| Total | 0 (0.0%) | 119 (100.0%) |
Household Vehicle Usage in Manderson White Horse Creek
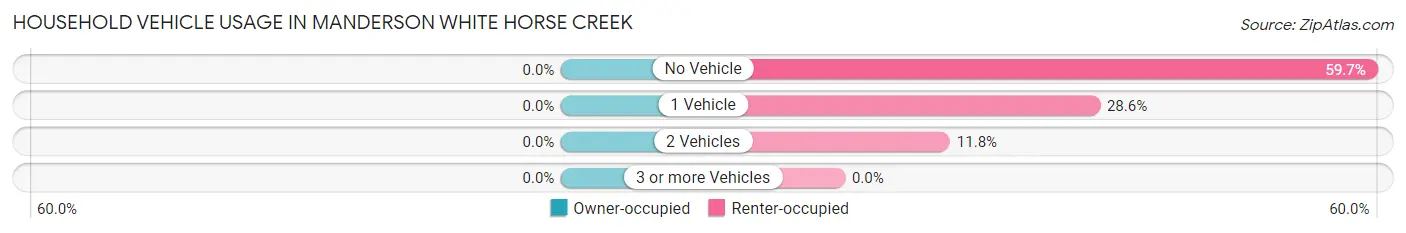
| Vehicles per Household | Owner-occupied | Renter-occupied |
| No Vehicle | 0 (0.0%) | 71 (59.7%) |
| 1 Vehicle | 0 (0.0%) | 34 (28.6%) |
| 2 Vehicles | 0 (0.0%) | 14 (11.8%) |
| 3 or more Vehicles | 0 (0.0%) | 0 (0.0%) |
| Total | 0 (0.0%) | 119 (100.0%) |
Real Estate & Mortgages in Manderson White Horse Creek
Real Estate and Mortgage Overview in Manderson White Horse Creek
| Characteristic | Without Mortgage | With Mortgage |
| Housing Units | 0 | 0 |
| Median Property Value | - | - |
| Median Household Income | - | - |
| Monthly Housing Costs | - | - |
| Real Estate Taxes | - | - |
Property Value by Mortgage Status in Manderson White Horse Creek
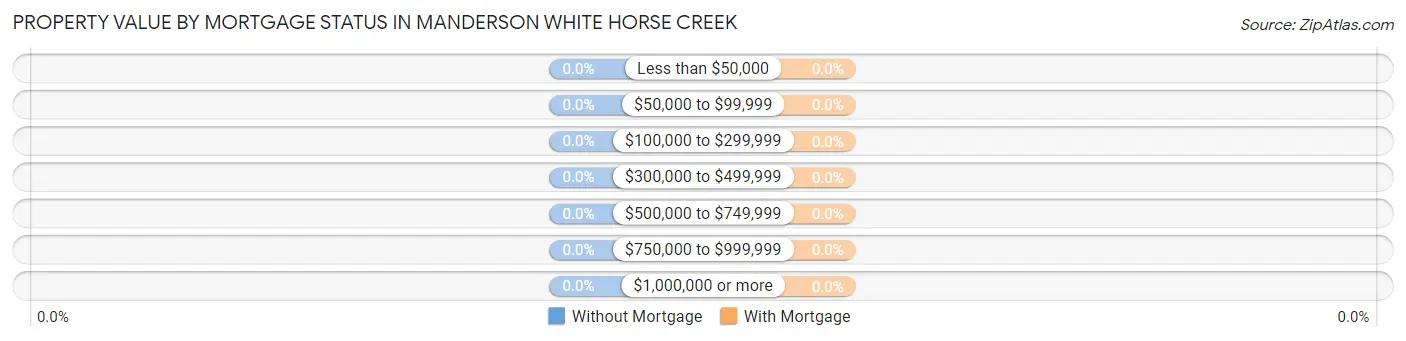
| Property Value | Without Mortgage | With Mortgage |
| Less than $50,000 | 0 (0.0%) | 0 (0.0%) |
| $50,000 to $99,999 | 0 (0.0%) | 0 (0.0%) |
| $100,000 to $299,999 | 0 (0.0%) | 0 (0.0%) |
| $300,000 to $499,999 | 0 (0.0%) | 0 (0.0%) |
| $500,000 to $749,999 | 0 (0.0%) | 0 (0.0%) |
| $750,000 to $999,999 | 0 (0.0%) | 0 (0.0%) |
| $1,000,000 or more | 0 (0.0%) | 0 (0.0%) |
| Total | 0 (0.0%) | 0 (0.0%) |
Household Income by Mortgage Status in Manderson White Horse Creek
| Household Income | Without Mortgage | With Mortgage |
| Less than $10,000 | 0 (0.0%) | 0 (0.0%) |
| $10,000 to $24,999 | 0 (0.0%) | 0 (0.0%) |
| $25,000 to $34,999 | 0 (0.0%) | 0 (0.0%) |
| $35,000 to $49,999 | 0 (0.0%) | 0 (0.0%) |
| $50,000 to $74,999 | 0 (0.0%) | 0 (0.0%) |
| $75,000 to $99,999 | 0 (0.0%) | 0 (0.0%) |
| $100,000 to $149,999 | 0 (0.0%) | 0 (0.0%) |
| $150,000 or more | 0 (0.0%) | 0 (0.0%) |
| Total | 0 (0.0%) | 0 (0.0%) |
Property Value to Household Income Ratio in Manderson White Horse Creek
| Value-to-Income Ratio | Without Mortgage | With Mortgage |
| Less than 2.0x | 0 (0.0%) | 0 (0.0%) |
| 2.0x to 2.9x | 0 (0.0%) | 0 (0.0%) |
| 3.0x to 3.9x | 0 (0.0%) | 0 (0.0%) |
| 4.0x or more | 0 (0.0%) | 0 (0.0%) |
| Total | 0 (0.0%) | 0 (0.0%) |
Real Estate Taxes by Mortgage Status in Manderson White Horse Creek
| Property Taxes | Without Mortgage | With Mortgage |
| Less than $800 | 0 (0.0%) | 0 (0.0%) |
| $800 to $1,499 | 0 (0.0%) | 0 (0.0%) |
| $800 to $1,499 | 0 (0.0%) | 0 (0.0%) |
| Total | 0 (0.0%) | 0 (0.0%) |
Health & Disability in Manderson White Horse Creek
Health Insurance Coverage by Age in Manderson White Horse Creek
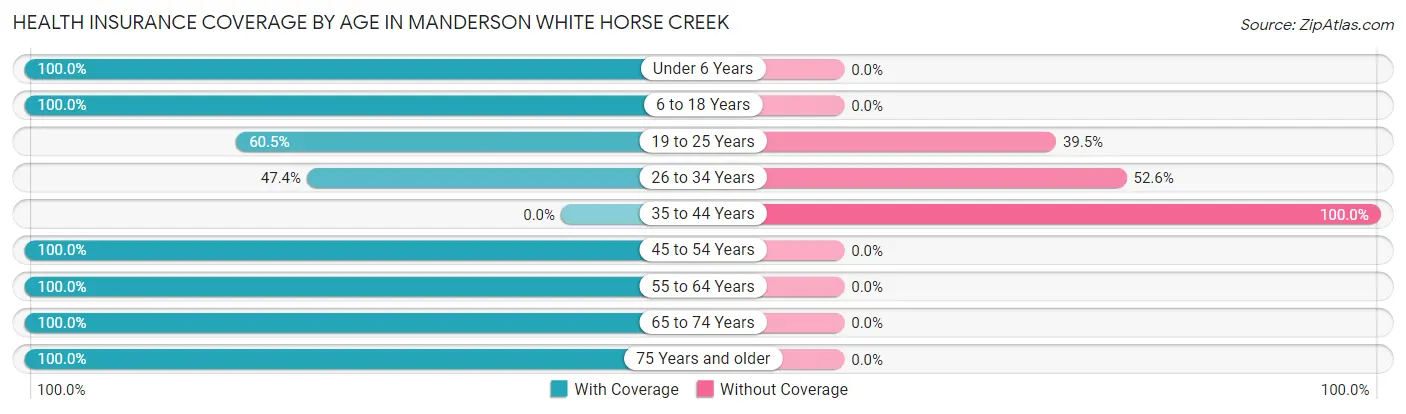
| Age Bracket | With Coverage | Without Coverage |
| Under 6 Years | 157 (100.0%) | 0 (0.0%) |
| 6 to 18 Years | 55 (100.0%) | 0 (0.0%) |
| 19 to 25 Years | 46 (60.5%) | 30 (39.5%) |
| 26 to 34 Years | 45 (47.4%) | 50 (52.6%) |
| 35 to 44 Years | 0 (0.0%) | 107 (100.0%) |
| 45 to 54 Years | 47 (100.0%) | 0 (0.0%) |
| 55 to 64 Years | 24 (100.0%) | 0 (0.0%) |
| 65 to 74 Years | 57 (100.0%) | 0 (0.0%) |
| 75 Years and older | 23 (100.0%) | 0 (0.0%) |
| Total | 454 (70.8%) | 187 (29.2%) |
Health Insurance Coverage by Citizenship Status in Manderson White Horse Creek
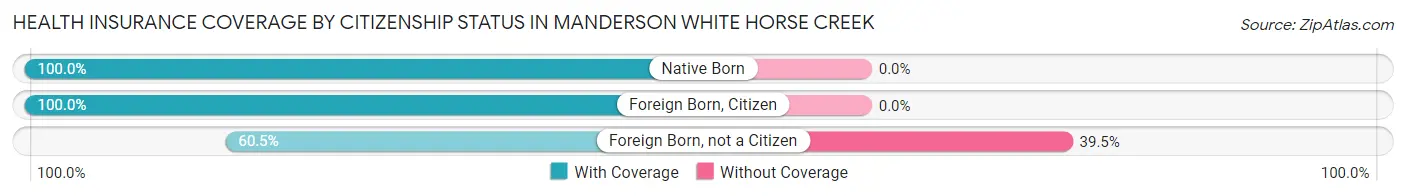
| Citizenship Status | With Coverage | Without Coverage |
| Native Born | 157 (100.0%) | 0 (0.0%) |
| Foreign Born, Citizen | 55 (100.0%) | 0 (0.0%) |
| Foreign Born, not a Citizen | 46 (60.5%) | 30 (39.5%) |
Health Insurance Coverage by Household Income in Manderson White Horse Creek
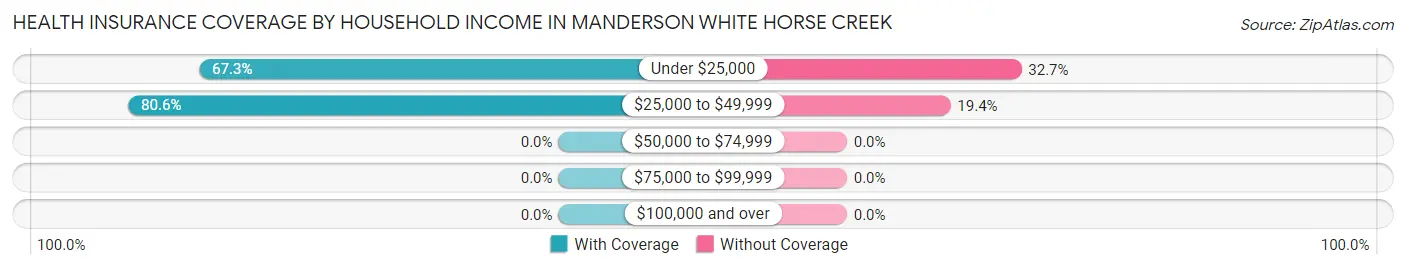
| Household Income | With Coverage | Without Coverage |
| Under $25,000 | 317 (67.3%) | 154 (32.7%) |
| $25,000 to $49,999 | 137 (80.6%) | 33 (19.4%) |
| $50,000 to $74,999 | 0 (0.0%) | 0 (0.0%) |
| $75,000 to $99,999 | 0 (0.0%) | 0 (0.0%) |
| $100,000 and over | 0 (0.0%) | 0 (0.0%) |
Public vs Private Health Insurance Coverage by Age in Manderson White Horse Creek
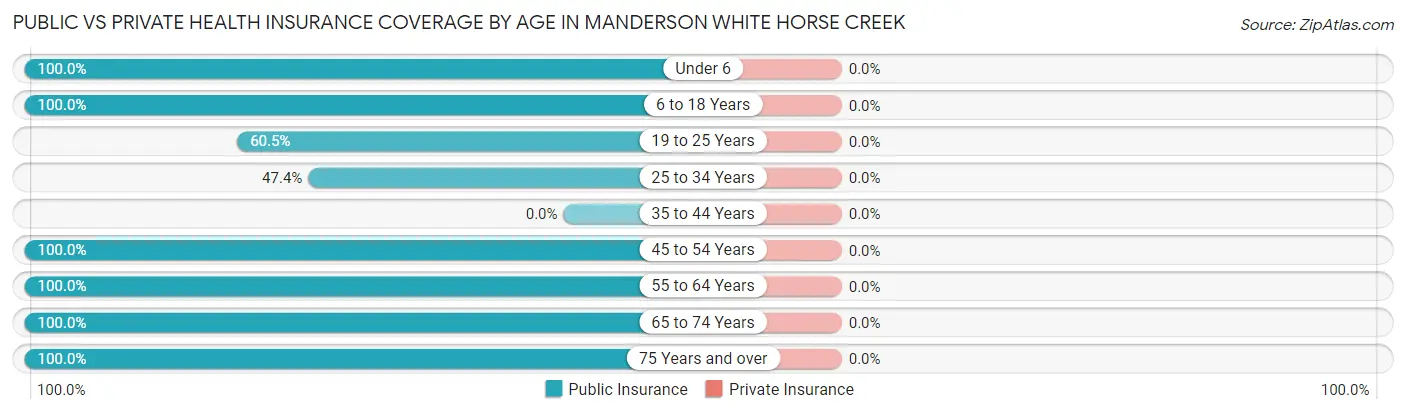
| Age Bracket | Public Insurance | Private Insurance |
| Under 6 | 157 (100.0%) | 0 (0.0%) |
| 6 to 18 Years | 55 (100.0%) | 0 (0.0%) |
| 19 to 25 Years | 46 (60.5%) | 0 (0.0%) |
| 25 to 34 Years | 45 (47.4%) | 0 (0.0%) |
| 35 to 44 Years | 0 (0.0%) | 0 (0.0%) |
| 45 to 54 Years | 47 (100.0%) | 0 (0.0%) |
| 55 to 64 Years | 24 (100.0%) | 0 (0.0%) |
| 65 to 74 Years | 57 (100.0%) | 0 (0.0%) |
| 75 Years and over | 23 (100.0%) | 0 (0.0%) |
| Total | 454 (70.8%) | 0 (0.0%) |
Disability Status by Sex by Age in Manderson White Horse Creek
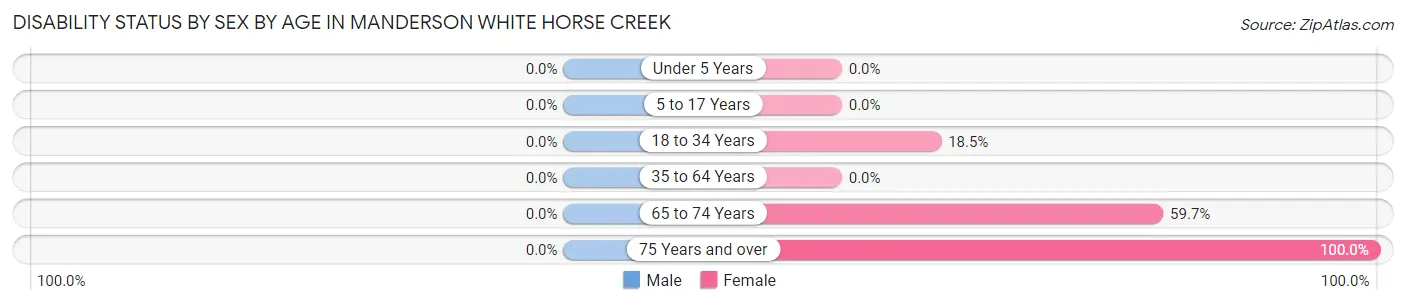
| Age Bracket | Male | Female |
| Under 5 Years | 0 (0.0%) | 0 (0.0%) |
| 5 to 17 Years | 0 (0.0%) | 0 (0.0%) |
| 18 to 34 Years | 0 (0.0%) | 19 (18.4%) |
| 35 to 64 Years | 0 (0.0%) | 0 (0.0%) |
| 65 to 74 Years | 0 (0.0%) | 34 (59.7%) |
| 75 Years and over | 0 (0.0%) | 23 (100.0%) |
Disability Class by Sex by Age in Manderson White Horse Creek
Disability Class: Hearing Difficulty
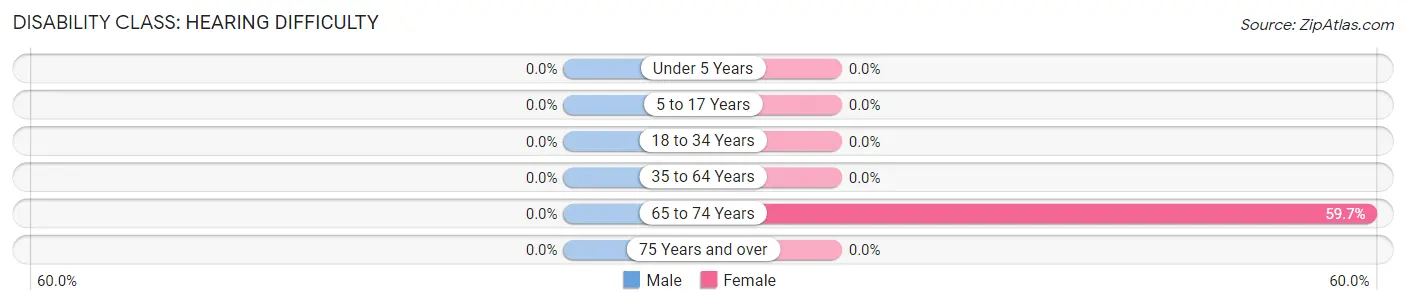
| Age Bracket | Male | Female |
| Under 5 Years | 0 (0.0%) | 0 (0.0%) |
| 5 to 17 Years | 0 (0.0%) | 0 (0.0%) |
| 18 to 34 Years | 0 (0.0%) | 0 (0.0%) |
| 35 to 64 Years | 0 (0.0%) | 0 (0.0%) |
| 65 to 74 Years | 0 (0.0%) | 34 (59.7%) |
| 75 Years and over | 0 (0.0%) | 0 (0.0%) |
Disability Class: Vision Difficulty
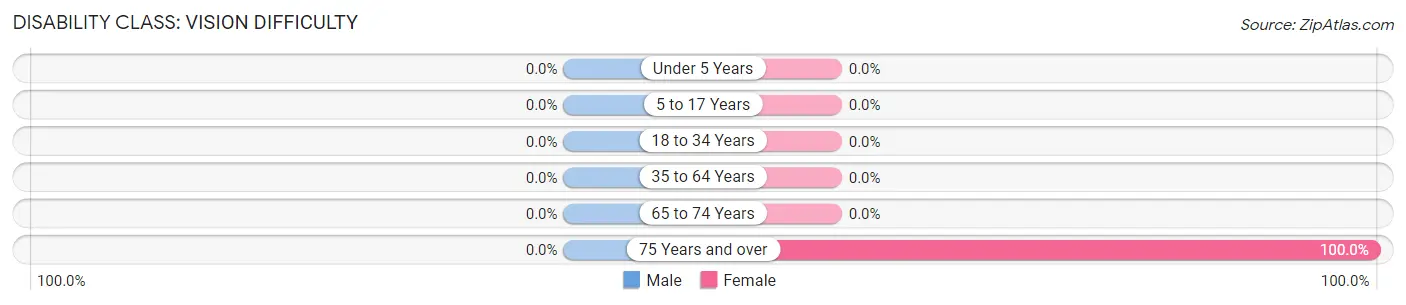
| Age Bracket | Male | Female |
| Under 5 Years | 0 (0.0%) | 0 (0.0%) |
| 5 to 17 Years | 0 (0.0%) | 0 (0.0%) |
| 18 to 34 Years | 0 (0.0%) | 0 (0.0%) |
| 35 to 64 Years | 0 (0.0%) | 0 (0.0%) |
| 65 to 74 Years | 0 (0.0%) | 0 (0.0%) |
| 75 Years and over | 0 (0.0%) | 23 (100.0%) |
Disability Class: Cognitive Difficulty
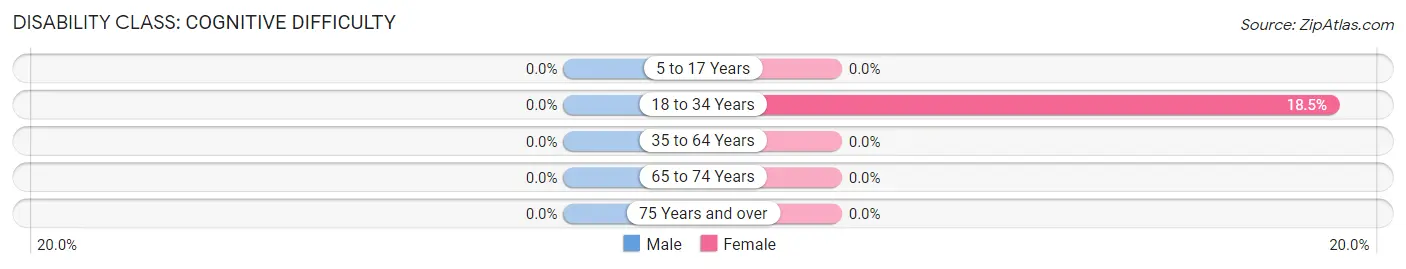
| Age Bracket | Male | Female |
| 5 to 17 Years | 0 (0.0%) | 0 (0.0%) |
| 18 to 34 Years | 0 (0.0%) | 19 (18.4%) |
| 35 to 64 Years | 0 (0.0%) | 0 (0.0%) |
| 65 to 74 Years | 0 (0.0%) | 0 (0.0%) |
| 75 Years and over | 0 (0.0%) | 0 (0.0%) |
Disability Class: Ambulatory Difficulty
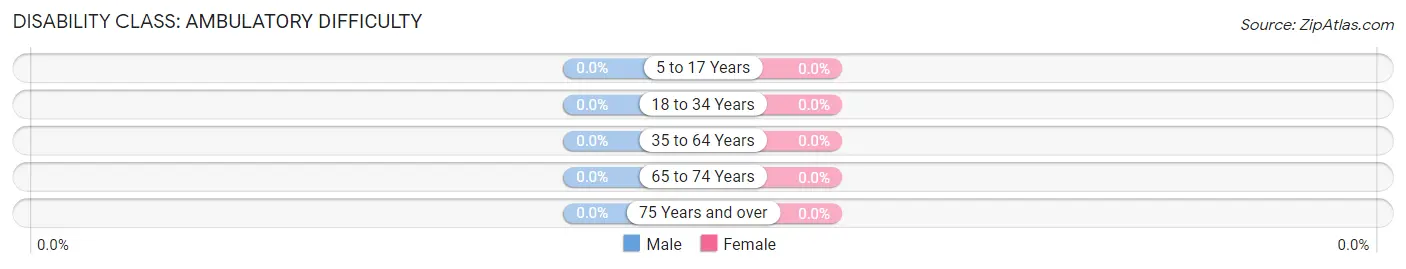
| Age Bracket | Male | Female |
| 5 to 17 Years | 0 (0.0%) | 0 (0.0%) |
| 18 to 34 Years | 0 (0.0%) | 0 (0.0%) |
| 35 to 64 Years | 0 (0.0%) | 0 (0.0%) |
| 65 to 74 Years | 0 (0.0%) | 0 (0.0%) |
| 75 Years and over | 0 (0.0%) | 0 (0.0%) |
Disability Class: Self-Care Difficulty
| Age Bracket | Male | Female |
| 5 to 17 Years | 0 (0.0%) | 0 (0.0%) |
| 18 to 34 Years | 0 (0.0%) | 0 (0.0%) |
| 35 to 64 Years | 0 (0.0%) | 0 (0.0%) |
| 65 to 74 Years | 0 (0.0%) | 0 (0.0%) |
| 75 Years and over | 0 (0.0%) | 0 (0.0%) |
Technology Access in Manderson White Horse Creek
Computing Device Access in Manderson White Horse Creek
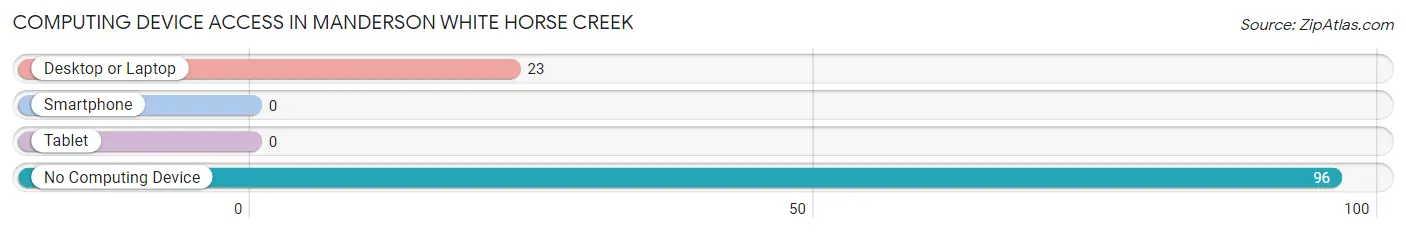
| Device Type | # Households | % Households |
| Desktop or Laptop | 23 | 19.3% |
| Smartphone | 0 | 0.0% |
| Tablet | 0 | 0.0% |
| No Computing Device | 96 | 80.7% |
| Total | 119 | 100.0% |
Internet Access in Manderson White Horse Creek
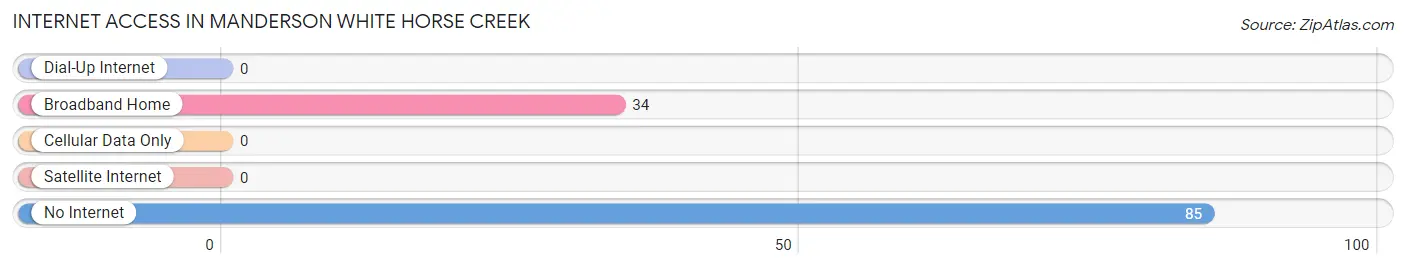
| Internet Type | # Households | % Households |
| Dial-Up Internet | 0 | 0.0% |
| Broadband Home | 34 | 28.6% |
| Cellular Data Only | 0 | 0.0% |
| Satellite Internet | 0 | 0.0% |
| No Internet | 85 | 71.4% |
| Total | 119 | 100.0% |
Manderson White Horse Creek Summary
Manderson White Horse Creek, South Dakota is a small unincorporated community located in the southwestern part of the state. It is situated in the White Horse Creek Valley, which is part of the larger Cheyenne River Valley. The community is located in Shannon County, which is part of the larger Oglala Lakota County. The population of Manderson White Horse Creek was estimated to be around 200 people in 2020.
History
The area that is now Manderson White Horse Creek was originally inhabited by the Lakota Sioux. The area was first settled by white settlers in the late 1800s. The first settlers were ranchers and farmers who were attracted to the area by the abundance of natural resources. The town was officially established in 1887 and was named after the nearby White Horse Creek.
The town grew slowly over the years and by the early 1900s, it had become a thriving community. The town was home to a variety of businesses, including a general store, a blacksmith shop, a hotel, and a saloon. The town also had a school, a post office, and a church.
Geography
Manderson White Horse Creek is located in the southwestern part of South Dakota, in the White Horse Creek Valley. The town is situated in Shannon County, which is part of the larger Oglala Lakota County. The town is located at an elevation of 3,400 feet above sea level.
The town is surrounded by rolling hills and grasslands. The nearby White Horse Creek is a tributary of the Cheyenne River. The town is located about 30 miles from the nearest major city, Rapid City.
Economy
The economy of Manderson White Horse Creek is largely based on agriculture. The town is home to several farms and ranches, which produce a variety of crops and livestock. The town is also home to a few small businesses, including a general store, a gas station, and a restaurant.
Demographics
The population of Manderson White Horse Creek was estimated to be around 200 people in 2020. The town is predominantly white, with a small Native American population. The median household income in the town is around $30,000. The town has a high poverty rate, with around 30% of the population living below the poverty line.
Conclusion
Manderson White Horse Creek is a small unincorporated community located in the southwestern part of South Dakota. The town has a long history, dating back to the late 1800s. The town is predominantly white, with a small Native American population. The economy of the town is largely based on agriculture, with several farms and ranches in the area. The population of the town was estimated to be around 200 people in 2020.
Common Questions
What is Per Capita Income in Manderson White Horse Creek?
Per Capita income in Manderson White Horse Creek is $3,332.
What is the Median Family Income in Manderson White Horse Creek?
Median Family Income in Manderson White Horse Creek is $23,261.
What is Inequality or Gini Index in Manderson White Horse Creek?
Inequality or Gini Index in Manderson White Horse Creek is 0.41.
What is the Total Population of Manderson White Horse Creek?
Total Population of Manderson White Horse Creek is 641.
What is the Total Male Population of Manderson White Horse Creek?
Total Male Population of Manderson White Horse Creek is 281.
What is the Total Female Population of Manderson White Horse Creek?
Total Female Population of Manderson White Horse Creek is 360.
What is the Ratio of Males per 100 Females in Manderson White Horse Creek?
There are 78.06 Males per 100 Females in Manderson White Horse Creek.
What is the Ratio of Females per 100 Males in Manderson White Horse Creek?
There are 128.11 Females per 100 Males in Manderson White Horse Creek.
What is the Median Population Age in Manderson White Horse Creek?
Median Population Age in Manderson White Horse Creek is 32.3 Years.
What is the Average Family Size in Manderson White Horse Creek
Average Family Size in Manderson White Horse Creek is 6.2 People.
What is the Average Household Size in Manderson White Horse Creek
Average Household Size in Manderson White Horse Creek is 5.4 People.
How Large is the Labor Force in Manderson White Horse Creek?
There are 60 People in the Labor Forcein in Manderson White Horse Creek.
What is the Percentage of People in the Labor Force in Manderson White Horse Creek?
14.0% of People are in the Labor Force in Manderson White Horse Creek.
What is the Unemployment Rate in Manderson White Horse Creek?
Unemployment Rate in Manderson White Horse Creek is 8.3%.