Zip Codes with the Highest Percentage of Families with Income Below $10,000 in South Dakota
RELATED REPORTS & OPTIONS
Family Income | $0-10k
South Dakota
Compare Zip Codes
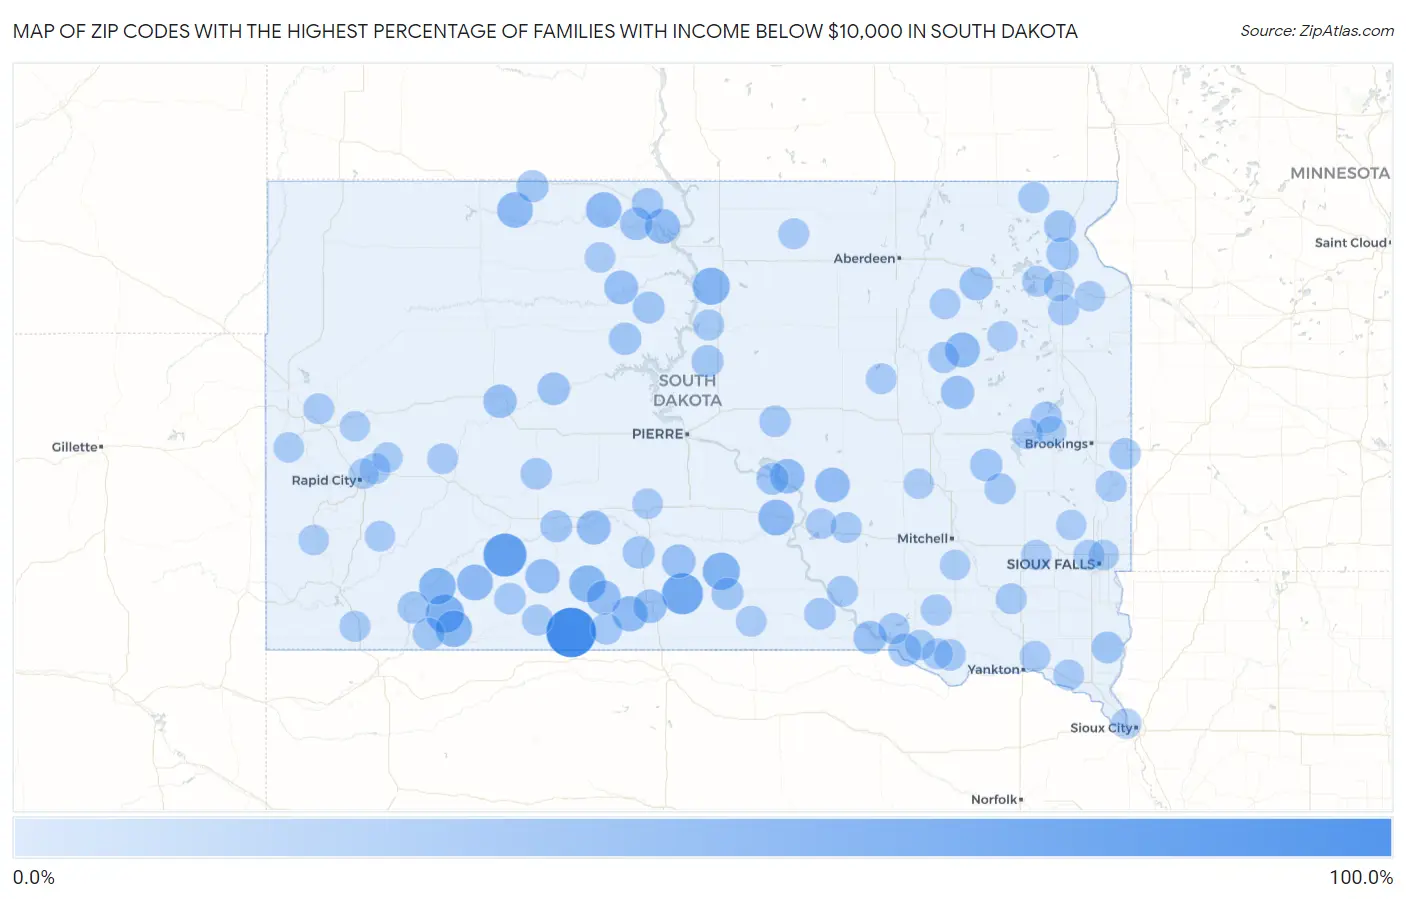
Map of Zip Codes with the Highest Percentage of Families with Income Below $10,000 in South Dakota
0.0%
100.0%
Zip Codes with the Highest Percentage of Families with Income Below $10,000 in South Dakota
| Zip Code | Families with Income < $10k | vs State | vs National | |
| 1. | 57574 | 88.7% | 2.6%(+86.1)#1 | 3.1%(+85.6)#13 |
| 2. | 57750 | 59.1% | 2.6%(+56.5)#2 | 3.1%(+56.0)#45 |
| 3. | 57563 | 50.0% | 2.6%(+47.4)#3 | 3.1%(+46.9)#66 |
| 4. | 57756 | 37.0% | 2.6%(+34.4)#4 | 3.1%(+33.9)#131 |
| 5. | 57584 | 33.3% | 2.6%(+30.7)#5 | 3.1%(+30.2)#159 |
| 6. | 57420 | 32.7% | 2.6%(+30.1)#6 | 3.1%(+29.6)#164 |
| 7. | 57560 | 30.7% | 2.6%(+28.1)#7 | 3.1%(+27.6)#186 |
| 8. | 57794 | 30.4% | 2.6%(+27.8)#8 | 3.1%(+27.3)#189 |
| 9. | 57772 | 30.0% | 2.6%(+27.4)#9 | 3.1%(+26.9)#193 |
| 10. | 57752 | 26.9% | 2.6%(+24.3)#10 | 3.1%(+23.8)#252 |
| 11. | 57569 | 26.7% | 2.6%(+24.1)#11 | 3.1%(+23.6)#262 |
| 12. | 57634 | 25.9% | 2.6%(+23.3)#12 | 3.1%(+22.8)#283 |
| 13. | 57621 | 25.6% | 2.6%(+23.0)#13 | 3.1%(+22.5)#291 |
| 14. | 57570 | 24.7% | 2.6%(+22.1)#14 | 3.1%(+21.6)#312 |
| 15. | 57658 | 22.8% | 2.6%(+20.2)#15 | 3.1%(+19.7)#376 |
| 16. | 57258 | 22.8% | 2.6%(+20.2)#16 | 3.1%(+19.7)#377 |
| 17. | 57341 | 22.2% | 2.6%(+19.6)#17 | 3.1%(+19.1)#399 |
| 18. | 57339 | 21.3% | 2.6%(+18.7)#18 | 3.1%(+18.2)#429 |
| 19. | 57577 | 20.0% | 2.6%(+17.4)#19 | 3.1%(+16.9)#471 |
| 20. | 57566 | 19.6% | 2.6%(+17.0)#20 | 3.1%(+16.5)#499 |
| 21. | 57521 | 19.4% | 2.6%(+16.8)#21 | 3.1%(+16.3)#510 |
| 22. | 57661 | 18.6% | 2.6%(+16.0)#22 | 3.1%(+15.5)#555 |
| 23. | 57585 | 17.6% | 2.6%(+15.0)#23 | 3.1%(+14.5)#619 |
| 24. | 57555 | 17.3% | 2.6%(+14.7)#24 | 3.1%(+14.2)#639 |
| 25. | 57748 | 16.4% | 2.6%(+13.8)#25 | 3.1%(+13.3)#721 |
| 26. | 57322 | 16.0% | 2.6%(+13.4)#26 | 3.1%(+12.9)#751 |
| 27. | 57219 | 15.2% | 2.6%(+12.6)#27 | 3.1%(+12.1)#846 |
| 28. | 57335 | 15.1% | 2.6%(+12.5)#28 | 3.1%(+12.0)#861 |
| 29. | 57361 | 13.0% | 2.6%(+10.4)#29 | 3.1%(+9.90)#1,130 |
| 30. | 57639 | 12.9% | 2.6%(+10.3)#30 | 3.1%(+9.80)#1,149 |
| 31. | 57622 | 12.7% | 2.6%(+10.1)#31 | 3.1%(+9.60)#1,193 |
| 32. | 57323 | 12.1% | 2.6%(+9.50)#32 | 3.1%(+9.00)#1,313 |
| 33. | 57625 | 11.8% | 2.6%(+9.20)#33 | 3.1%(+8.70)#1,374 |
| 34. | 57257 | 11.6% | 2.6%(+9.00)#34 | 3.1%(+8.50)#1,433 |
| 35. | 57579 | 11.0% | 2.6%(+8.40)#35 | 3.1%(+7.90)#1,601 |
| 36. | 57548 | 10.8% | 2.6%(+8.20)#36 | 3.1%(+7.70)#1,662 |
| 37. | 57580 | 10.7% | 2.6%(+8.10)#37 | 3.1%(+7.60)#1,682 |
| 38. | 57764 | 10.6% | 2.6%(+8.00)#38 | 3.1%(+7.50)#1,718 |
| 39. | 57770 | 10.5% | 2.6%(+7.90)#39 | 3.1%(+7.40)#1,743 |
| 40. | 57520 | 10.5% | 2.6%(+7.90)#40 | 3.1%(+7.40)#1,768 |
| 41. | 57645 | 10.5% | 2.6%(+7.90)#41 | 3.1%(+7.40)#1,769 |
| 42. | 57652 | 10.1% | 2.6%(+7.50)#42 | 3.1%(+7.00)#1,900 |
| 43. | 57543 | 10.0% | 2.6%(+7.40)#43 | 3.1%(+6.90)#1,929 |
| 44. | 57262 | 9.8% | 2.6%(+7.20)#44 | 3.1%(+6.70)#1,999 |
| 45. | 57001 | 9.1% | 2.6%(+6.50)#45 | 3.1%(+6.00)#2,325 |
| 46. | 57642 | 8.8% | 2.6%(+6.20)#46 | 3.1%(+5.70)#2,476 |
| 47. | 57572 | 8.7% | 2.6%(+6.10)#47 | 3.1%(+5.60)#2,537 |
| 48. | 57523 | 8.6% | 2.6%(+6.00)#48 | 3.1%(+5.50)#2,609 |
| 49. | 57714 | 8.3% | 2.6%(+5.70)#49 | 3.1%(+5.20)#2,805 |
| 50. | 57214 | 8.2% | 2.6%(+5.60)#50 | 3.1%(+5.10)#2,893 |
| 51. | 57567 | 7.9% | 2.6%(+5.30)#51 | 3.1%(+4.80)#3,062 |
| 52. | 57540 | 7.9% | 2.6%(+5.30)#52 | 3.1%(+4.80)#3,071 |
| 53. | 57315 | 7.7% | 2.6%(+5.10)#53 | 3.1%(+4.60)#3,163 |
| 54. | 57026 | 7.2% | 2.6%(+4.60)#54 | 3.1%(+4.10)#3,516 |
| 55. | 57356 | 7.0% | 2.6%(+4.40)#55 | 3.1%(+3.90)#3,661 |
| 56. | 57369 | 6.5% | 2.6%(+3.90)#56 | 3.1%(+3.40)#4,157 |
| 57. | 57442 | 6.4% | 2.6%(+3.80)#57 | 3.1%(+3.30)#4,260 |
| 58. | 57551 | 6.3% | 2.6%(+3.70)#58 | 3.1%(+3.20)#4,362 |
| 59. | 57349 | 6.3% | 2.6%(+3.70)#59 | 3.1%(+3.20)#4,372 |
| 60. | 57330 | 6.3% | 2.6%(+3.70)#60 | 3.1%(+3.20)#4,396 |
| 61. | 57270 | 6.0% | 2.6%(+3.40)#61 | 3.1%(+2.90)#4,743 |
| 62. | 57436 | 6.0% | 2.6%(+3.40)#62 | 3.1%(+2.90)#4,755 |
| 63. | 57029 | 5.6% | 2.6%(+3.00)#63 | 3.1%(+2.50)#5,236 |
| 64. | 57355 | 5.6% | 2.6%(+3.00)#64 | 3.1%(+2.50)#5,251 |
| 65. | 57763 | 5.6% | 2.6%(+3.00)#65 | 3.1%(+2.50)#5,281 |
| 66. | 57028 | 5.4% | 2.6%(+2.80)#66 | 3.1%(+2.30)#5,526 |
| 67. | 57448 | 5.3% | 2.6%(+2.70)#67 | 3.1%(+2.20)#5,730 |
| 68. | 57069 | 5.2% | 2.6%(+2.60)#68 | 3.1%(+2.10)#5,795 |
| 69. | 57263 | 5.2% | 2.6%(+2.60)#69 | 3.1%(+2.10)#5,902 |
| 70. | 57329 | 5.2% | 2.6%(+2.60)#70 | 3.1%(+2.10)#5,904 |
| 71. | 57273 | 5.0% | 2.6%(+2.40)#71 | 3.1%(+1.90)#6,209 |
| 72. | 57528 | 5.0% | 2.6%(+2.40)#72 | 3.1%(+1.90)#6,215 |
| 73. | 57046 | 4.9% | 2.6%(+2.30)#73 | 3.1%(+1.80)#6,394 |
| 74. | 57706 | 4.8% | 2.6%(+2.20)#74 | 3.1%(+1.70)#6,536 |
| 75. | 57476 | 4.8% | 2.6%(+2.20)#75 | 3.1%(+1.70)#6,585 |
| 76. | 57793 | 4.7% | 2.6%(+2.10)#76 | 3.1%(+1.60)#6,740 |
| 77. | 57249 | 4.7% | 2.6%(+2.10)#77 | 3.1%(+1.60)#6,774 |
| 78. | 57370 | 4.6% | 2.6%(+2.00)#78 | 3.1%(+1.50)#6,961 |
| 79. | 57791 | 4.5% | 2.6%(+1.90)#79 | 3.1%(+1.40)#7,182 |
| 80. | 57559 | 4.4% | 2.6%(+1.80)#80 | 3.1%(+1.30)#7,369 |
| 81. | 57744 | 4.3% | 2.6%(+1.70)#81 | 3.1%(+1.20)#7,541 |
| 82. | 57656 | 4.3% | 2.6%(+1.70)#82 | 3.1%(+1.20)#7,581 |
| 83. | 57107 | 4.1% | 2.6%(+1.50)#83 | 3.1%(+1.000)#7,964 |
| 84. | 57730 | 4.0% | 2.6%(+1.40)#84 | 3.1%(+0.900)#8,251 |
| 85. | 57434 | 4.0% | 2.6%(+1.40)#85 | 3.1%(+0.900)#8,347 |
| 86. | 57266 | 3.8% | 2.6%(+1.20)#86 | 3.1%(+0.700)#8,889 |
| 87. | 57334 | 3.7% | 2.6%(+1.10)#87 | 3.1%(+0.600)#9,175 |
| 88. | 57049 | 3.6% | 2.6%(+1.00)#88 | 3.1%(+0.500)#9,325 |
| 89. | 57380 | 3.6% | 2.6%(+1.00)#89 | 3.1%(+0.500)#9,370 |
| 90. | 57012 | 3.6% | 2.6%(+1.00)#90 | 3.1%(+0.500)#9,429 |
| 91. | 57701 | 3.4% | 2.6%(+0.800)#91 | 3.1%(+0.300)#9,773 |
| 92. | 57104 | 3.4% | 2.6%(+0.800)#92 | 3.1%(+0.300)#9,825 |
| 93. | 57754 | 3.4% | 2.6%(+0.800)#93 | 3.1%(+0.300)#9,974 |
| 94. | 57236 | 3.4% | 2.6%(+0.800)#94 | 3.1%(+0.300)#10,087 |
| 95. | 57719 | 3.3% | 2.6%(+0.700)#95 | 3.1%(+0.200)#10,222 |
| 96. | 57018 | 3.3% | 2.6%(+0.700)#96 | 3.1%(+0.200)#10,351 |
| 97. | 57385 | 3.2% | 2.6%(+0.600)#97 | 3.1%(+0.100)#10,681 |
| 98. | 57269 | 3.2% | 2.6%(+0.600)#98 | 3.1%(+0.100)#10,733 |
| 99. | 57785 | 3.0% | 2.6%(+0.400)#99 | 3.1%(-0.100)#11,216 |
| 100. | 57212 | 3.0% | 2.6%(+0.400)#100 | 3.1%(-0.100)#11,325 |
Common Questions
What are the Top 10 Zip Codes with the Highest Percentage of Families with Income Below $10,000 in South Dakota?
Top 10 Zip Codes with the Highest Percentage of Families with Income Below $10,000 in South Dakota are:
What zip code has the Highest Percentage of Families with Income Below $10,000 in South Dakota?
57574 has the Highest Percentage of Families with Income Below $10,000 in South Dakota with 88.7%.
What is the Percentage of Families with Income Below $10,000 in the State of South Dakota?
Percentage of Families with Income Below $10,000 in South Dakota is 2.6%.
What is the Percentage of Families with Income Below $10,000 in the United States?
Percentage of Families with Income Below $10,000 in the United States is 3.1%.