Wounded Knee, SD Map & Demographics
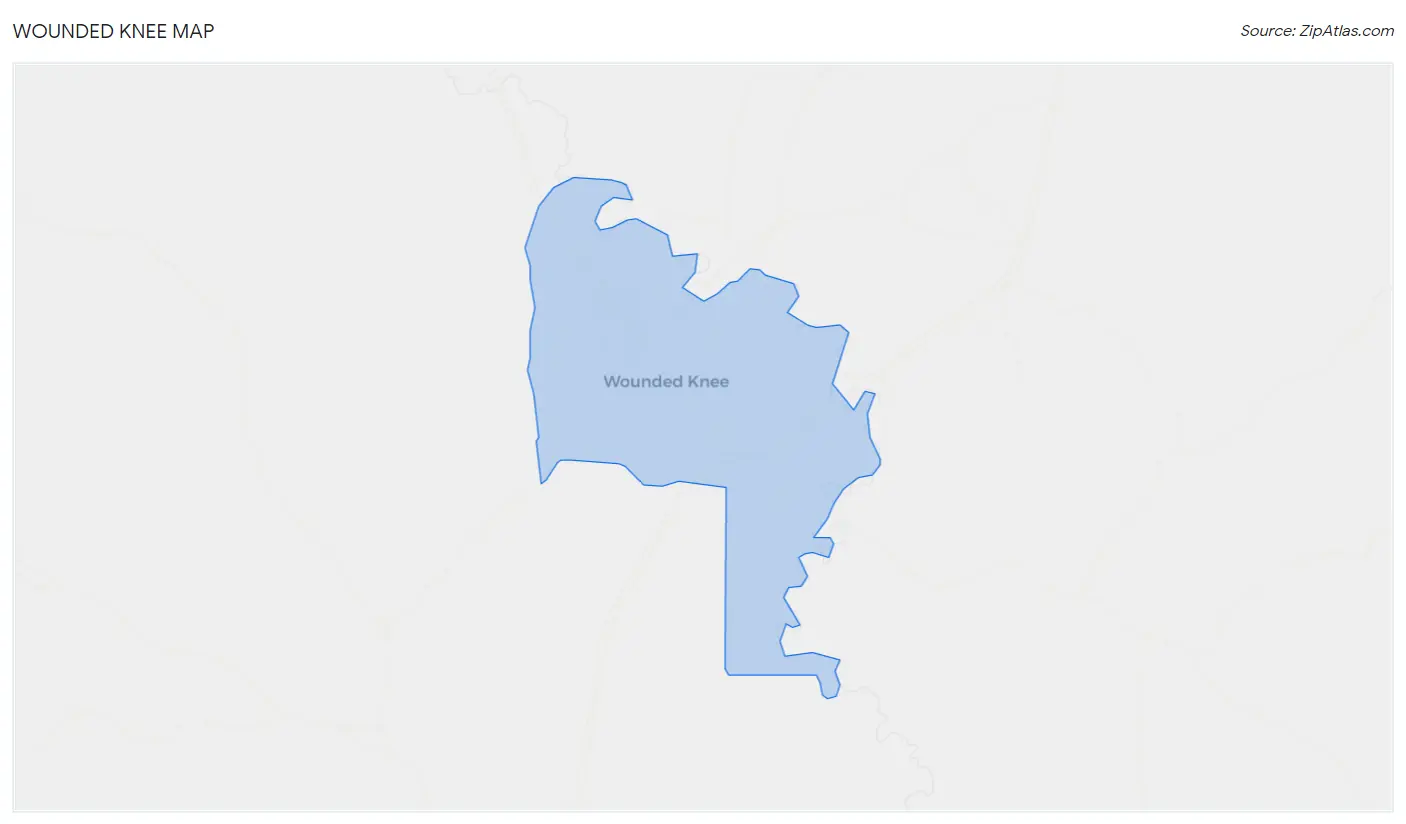
Wounded Knee Map
Wounded Knee Overview
$882
PER CAPITA INCOME
$2,499
AVG FAMILY INCOME
$2,499
AVG HOUSEHOLD INCOME
0.46
INEQUALITY / GINI INDEX
378
TOTAL POPULATION
295
MALE POPULATION
83
FEMALE POPULATION
355.42
MALES / 100 FEMALES
28.14
FEMALES / 100 MALES
22.3
MEDIAN AGE
5.8
AVG FAMILY SIZE
6.3
AVG HOUSEHOLD SIZE
47
LABOR FORCE [ PEOPLE ]
21.3%
PERCENT IN LABOR FORCE
100.0%
UNEMPLOYMENT RATE
Wounded Knee Zip Codes
Wounded Knee Area Codes
Income in Wounded Knee
Income Overview in Wounded Knee
Per Capita Income in Wounded Knee is $882, while median incomes of families and households are $2,499 and $2,499 respectively.
| Characteristic | Number | Measure |
| Per Capita Income | 378 | $882 |
| Median Family Income | 60 | $2,499 |
| Mean Family Income | 60 | $0 |
| Median Household Income | 60 | $2,499 |
| Mean Household Income | 60 | $0 |
| Income Deficit | 60 | $0 |
| Wage / Income Gap (%) | 378 | 0.00% |
| Wage / Income Gap ($) | 378 | 100.00¢ per $1 |
| Gini / Inequality Index | 378 | 0.46 |
Earnings by Sex in Wounded Knee
| Sex | Number | Average Earnings |
| Male | 0 (0.0%) | $0 |
| Female | 0 (0.0%) | $0 |
| Total | 0 (0.0%) | $0 |
Earnings by Sex by Income Bracket in Wounded Knee
| Income | Male | Female |
| $2,499 or less | 0 (0.0%) | 0 (0.0%) |
| $2,500 to $4,999 | 0 (0.0%) | 0 (0.0%) |
| $5,000 to $7,499 | 0 (0.0%) | 0 (0.0%) |
| $7,500 to $9,999 | 0 (0.0%) | 0 (0.0%) |
| $10,000 to $12,499 | 0 (0.0%) | 0 (0.0%) |
| $12,500 to $14,999 | 0 (0.0%) | 0 (0.0%) |
| $15,000 to $17,499 | 0 (0.0%) | 0 (0.0%) |
| $17,500 to $19,999 | 0 (0.0%) | 0 (0.0%) |
| $20,000 to $22,499 | 0 (0.0%) | 0 (0.0%) |
| $22,500 to $24,999 | 0 (0.0%) | 0 (0.0%) |
| $25,000 to $29,999 | 0 (0.0%) | 0 (0.0%) |
| $30,000 to $34,999 | 0 (0.0%) | 0 (0.0%) |
| $35,000 to $39,999 | 0 (0.0%) | 0 (0.0%) |
| $40,000 to $44,999 | 0 (0.0%) | 0 (0.0%) |
| $45,000 to $49,999 | 0 (0.0%) | 0 (0.0%) |
| $50,000 to $54,999 | 0 (0.0%) | 0 (0.0%) |
| $55,000 to $64,999 | 0 (0.0%) | 0 (0.0%) |
| $65,000 to $74,999 | 0 (0.0%) | 0 (0.0%) |
| $75,000 to $99,999 | 0 (0.0%) | 0 (0.0%) |
| $100,000+ | 0 (0.0%) | 0 (0.0%) |
| Total | 0 (0.0%) | 0 (0.0%) |
Earnings by Sex by Educational Attainment in Wounded Knee
| Educational Attainment | Male Income | Female Income |
| Less than High School | - | - |
| High School Diploma | - | - |
| College or Associate's Degree | - | - |
| Bachelor's Degree | - | - |
| Graduate Degree | - | - |
| Total | - | - |
Family Income in Wounded Knee
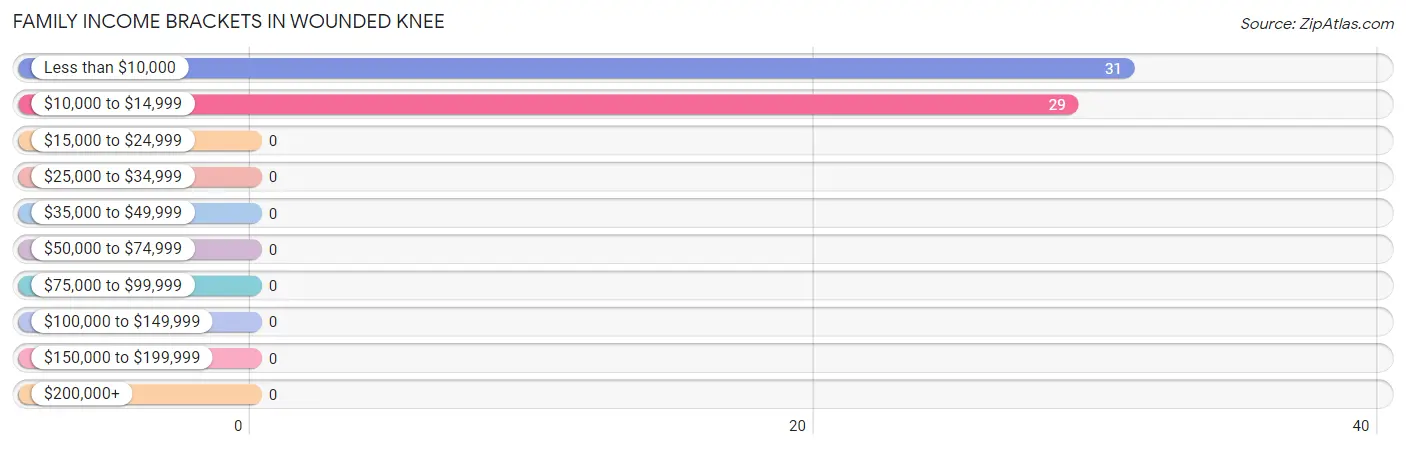
Family Income Brackets in Wounded Knee
According to the Wounded Knee family income data, there are 31 families falling into the less than $10,000 income range, which is the most common income bracket and makes up 51.7% of all families.
| Income Bracket | # Families | % Families |
| Less than $10,000 | 31 | 51.7% |
| $10,000 to $14,999 | 29 | 48.3% |
| $15,000 to $24,999 | 0 | 0.0% |
| $25,000 to $34,999 | 0 | 0.0% |
| $35,000 to $49,999 | 0 | 0.0% |
| $50,000 to $74,999 | 0 | 0.0% |
| $75,000 to $99,999 | 0 | 0.0% |
| $100,000 to $149,999 | 0 | 0.0% |
| $150,000 to $199,999 | 0 | 0.0% |
| $200,000+ | 0 | 0.0% |
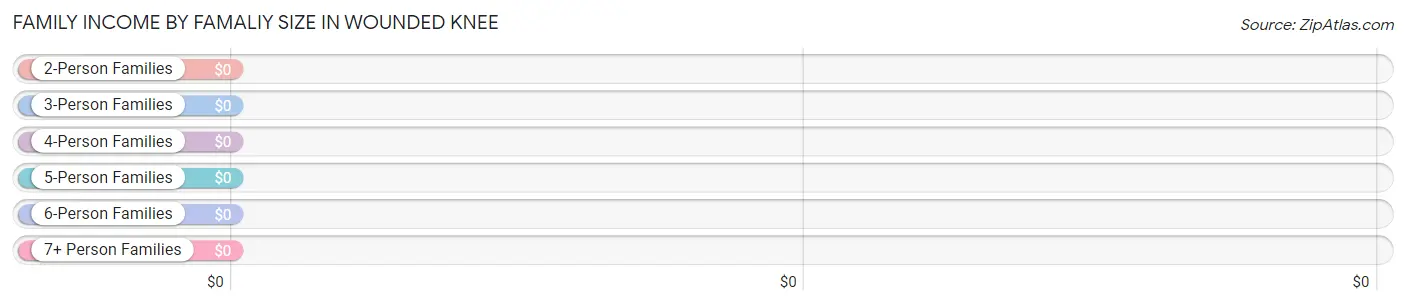
Family Income by Famaliy Size in Wounded Knee
| Income Bracket | # Families | Median Income |
| 2-Person Families | 0 (0.0%) | $0 |
| 3-Person Families | 0 (0.0%) | $0 |
| 4-Person Families | 46 (76.7%) | $0 |
| 5-Person Families | 0 (0.0%) | $0 |
| 6-Person Families | 0 (0.0%) | $0 |
| 7+ Person Families | 14 (23.3%) | $0 |
| Total | 60 (100.0%) | $2,499 |
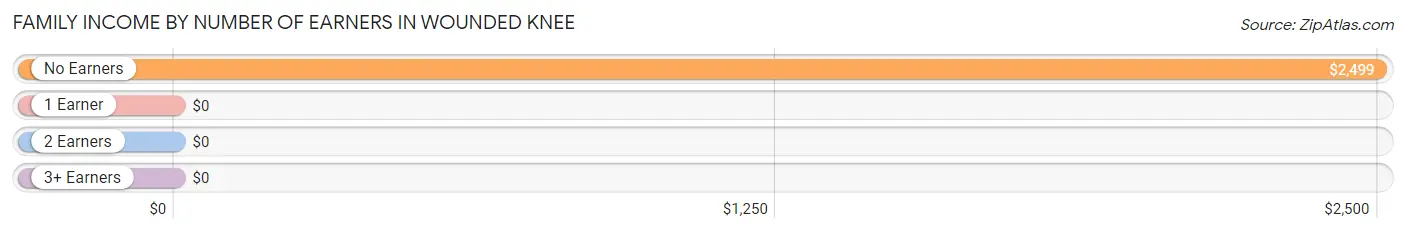
Family Income by Number of Earners in Wounded Knee
| Number of Earners | # Families | Median Income |
| No Earners | 60 (100.0%) | $2,499 |
| 1 Earner | 0 (0.0%) | $0 |
| 2 Earners | 0 (0.0%) | $0 |
| 3+ Earners | 0 (0.0%) | $0 |
| Total | 60 (100.0%) | $2,499 |
Household Income in Wounded Knee
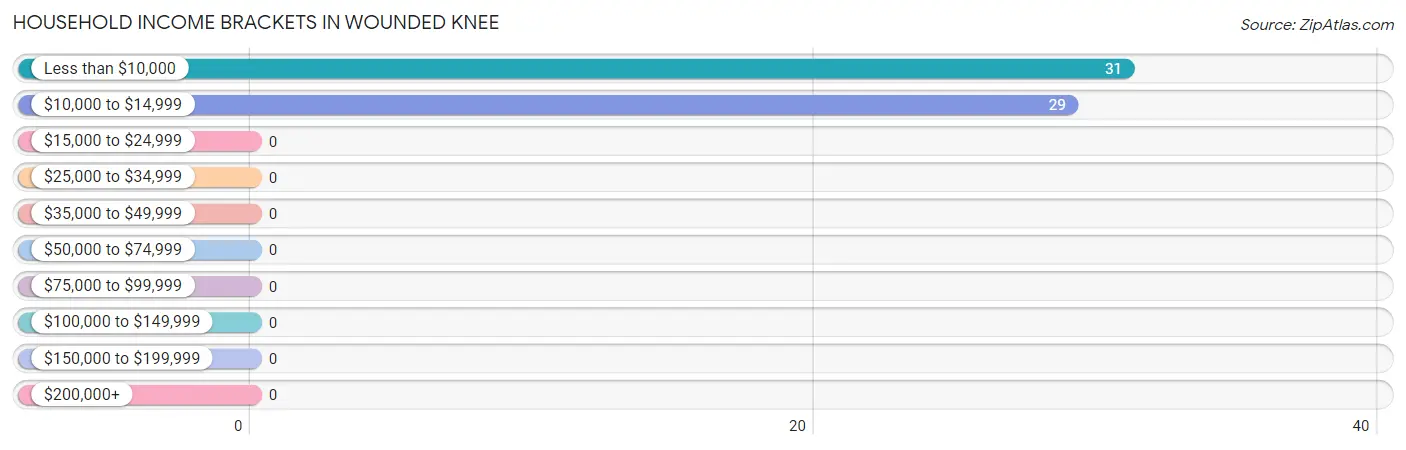
Household Income Brackets in Wounded Knee
With 31 households falling in the category, the less than $10,000 income range is the most frequent in Wounded Knee, accounting for 51.7% of all households.
| Income Bracket | # Households | % Households |
| Less than $10,000 | 31 | 51.7% |
| $10,000 to $14,999 | 29 | 48.3% |
| $15,000 to $24,999 | 0 | 0.0% |
| $25,000 to $34,999 | 0 | 0.0% |
| $35,000 to $49,999 | 0 | 0.0% |
| $50,000 to $74,999 | 0 | 0.0% |
| $75,000 to $99,999 | 0 | 0.0% |
| $100,000 to $149,999 | 0 | 0.0% |
| $150,000 to $199,999 | 0 | 0.0% |
| $200,000+ | 0 | 0.0% |
Household Income by Householder Age in Wounded Knee
The median household income in Wounded Knee is $2,499, with the highest median household income of $2,499 found in the 25 to 44 years age bracket for the primary householder. A total of 60 households (100.0%) fall into this category.
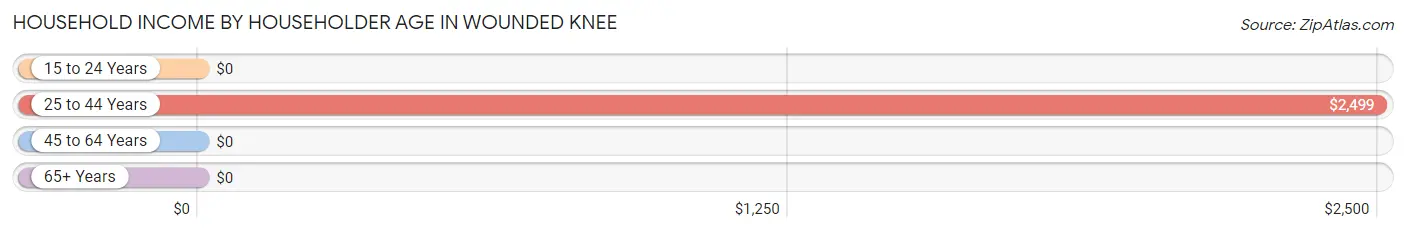
| Income Bracket | # Households | Median Income |
| 15 to 24 Years | 0 (0.0%) | $0 |
| 25 to 44 Years | 60 (100.0%) | $2,499 |
| 45 to 64 Years | 0 (0.0%) | $0 |
| 65+ Years | 0 (0.0%) | $0 |
| Total | 60 (100.0%) | $2,499 |
Poverty in Wounded Knee
Income Below Poverty by Sex and Age in Wounded Knee
With 100.0% poverty level for males and 100.0% for females among the residents of Wounded Knee, under 5 year old males and 6 to 11 year old females are the most vulnerable to poverty, with 81 males (100.0%) and 24 females (100.0%) in their respective age groups living below the poverty level.
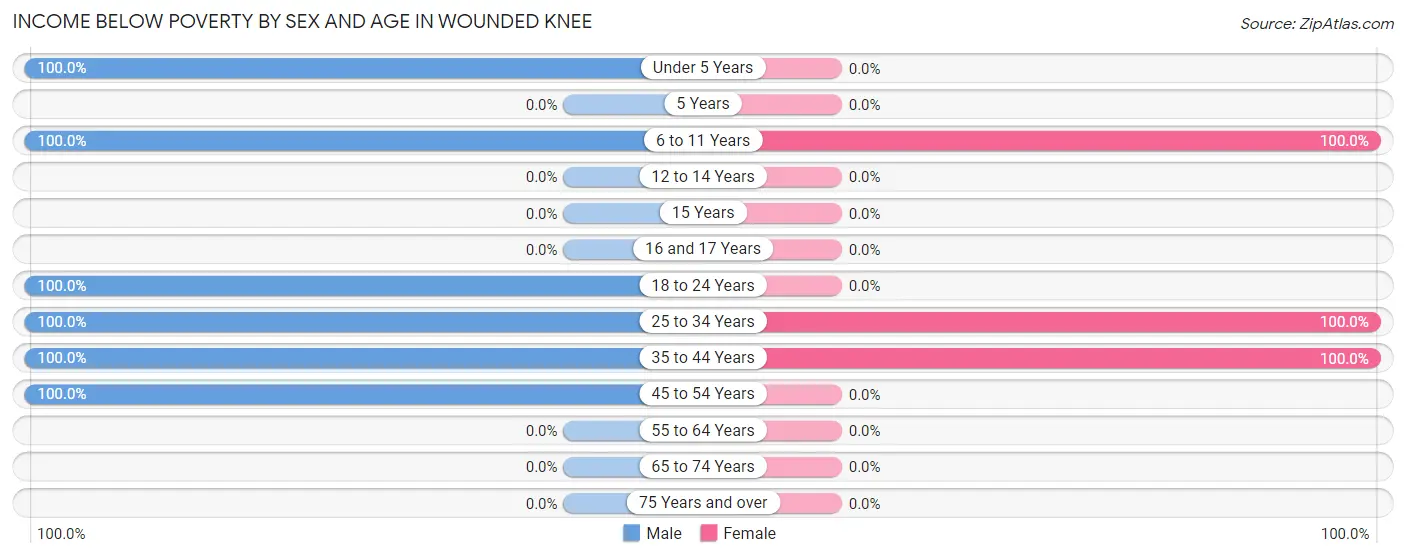
| Age Bracket | Male | Female |
| Under 5 Years | 81 (100.0%) | 0 (0.0%) |
| 5 Years | 0 (0.0%) | 0 (0.0%) |
| 6 to 11 Years | 52 (100.0%) | 24 (100.0%) |
| 12 to 14 Years | 0 (0.0%) | 0 (0.0%) |
| 15 Years | 0 (0.0%) | 0 (0.0%) |
| 16 and 17 Years | 0 (0.0%) | 0 (0.0%) |
| 18 to 24 Years | 72 (100.0%) | 0 (0.0%) |
| 25 to 34 Years | 40 (100.0%) | 30 (100.0%) |
| 35 to 44 Years | 30 (100.0%) | 29 (100.0%) |
| 45 to 54 Years | 20 (100.0%) | 0 (0.0%) |
| 55 to 64 Years | 0 (0.0%) | 0 (0.0%) |
| 65 to 74 Years | 0 (0.0%) | 0 (0.0%) |
| 75 Years and over | 0 (0.0%) | 0 (0.0%) |
| Total | 295 (100.0%) | 83 (100.0%) |
Income Above Poverty by Sex and Age in Wounded Knee
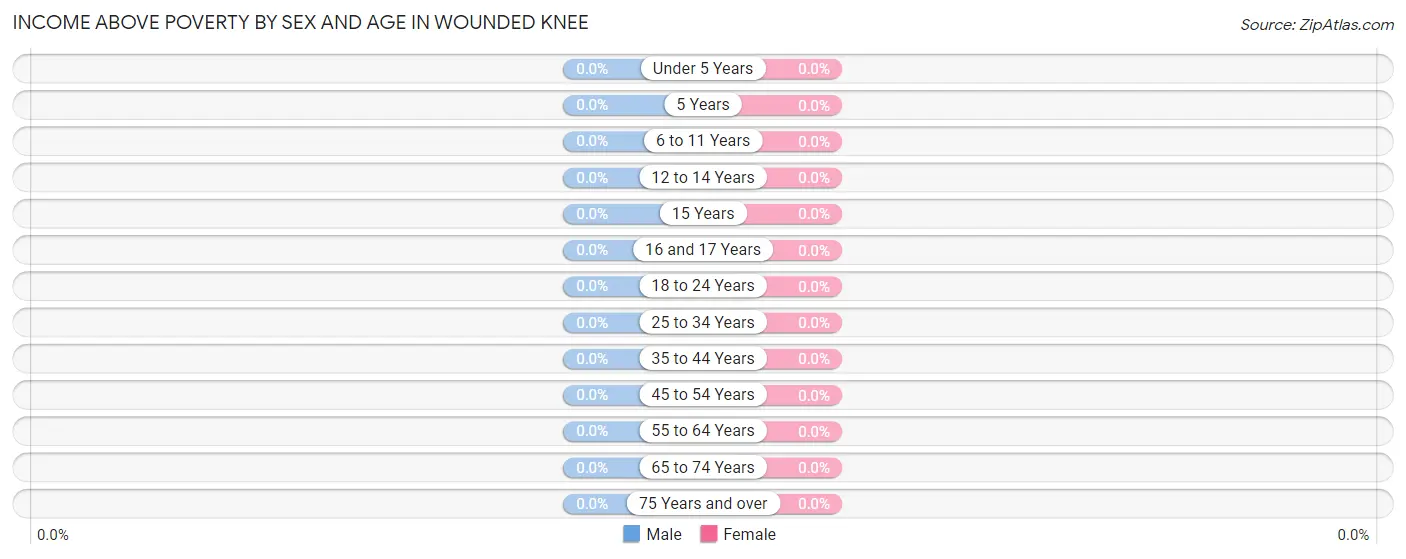
| Age Bracket | Male | Female |
| Under 5 Years | 0 (0.0%) | 0 (0.0%) |
| 5 Years | 0 (0.0%) | 0 (0.0%) |
| 6 to 11 Years | 0 (0.0%) | 0 (0.0%) |
| 12 to 14 Years | 0 (0.0%) | 0 (0.0%) |
| 15 Years | 0 (0.0%) | 0 (0.0%) |
| 16 and 17 Years | 0 (0.0%) | 0 (0.0%) |
| 18 to 24 Years | 0 (0.0%) | 0 (0.0%) |
| 25 to 34 Years | 0 (0.0%) | 0 (0.0%) |
| 35 to 44 Years | 0 (0.0%) | 0 (0.0%) |
| 45 to 54 Years | 0 (0.0%) | 0 (0.0%) |
| 55 to 64 Years | 0 (0.0%) | 0 (0.0%) |
| 65 to 74 Years | 0 (0.0%) | 0 (0.0%) |
| 75 Years and over | 0 (0.0%) | 0 (0.0%) |
| Total | 0 (0.0%) | 0 (0.0%) |
Income Below Poverty Among Married-Couple Families in Wounded Knee
The poverty statistics for married-couple families in Wounded Knee show that 100.0% or 17 of the total 17 families live below the poverty line. Families with 1 or 2 children have the highest poverty rate of 100.0%, comprising of 17 families. On the other hand, families with 1 or 2 children have the lowest poverty rate of 100.0%, which includes 17 families.
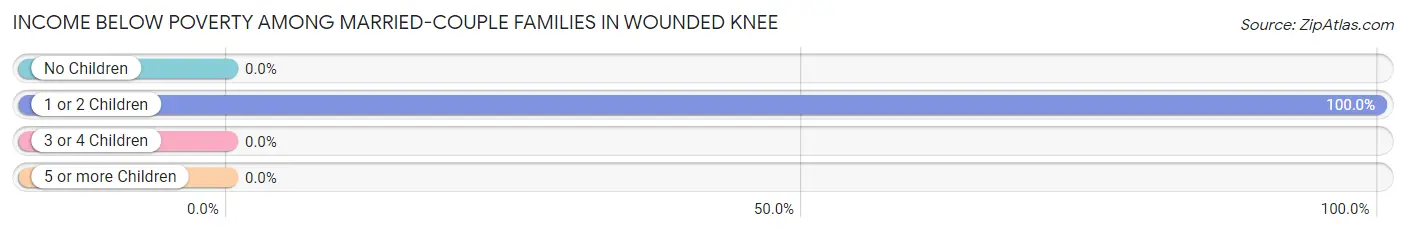
| Children | Above Poverty | Below Poverty |
| No Children | 0 (0.0%) | 0 (0.0%) |
| 1 or 2 Children | 0 (0.0%) | 17 (100.0%) |
| 3 or 4 Children | 0 (0.0%) | 0 (0.0%) |
| 5 or more Children | 0 (0.0%) | 0 (0.0%) |
| Total | 0 (0.0%) | 17 (100.0%) |
Income Below Poverty Among Single-Parent Households in Wounded Knee
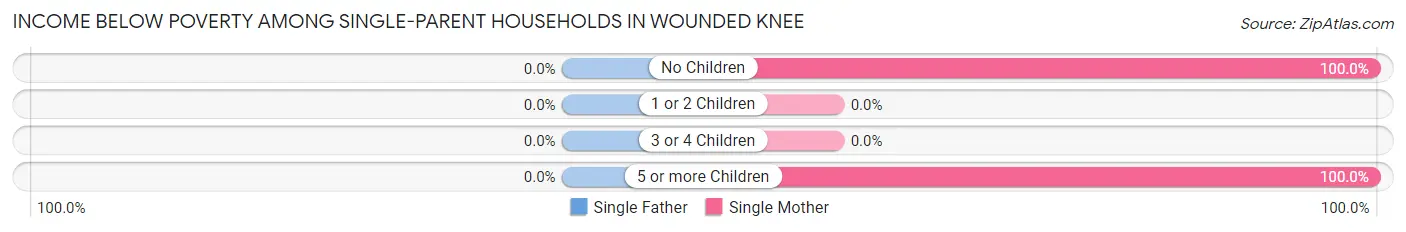
| Children | Single Father | Single Mother |
| No Children | 0 (0.0%) | 29 (100.0%) |
| 1 or 2 Children | 0 (0.0%) | 0 (0.0%) |
| 3 or 4 Children | 0 (0.0%) | 0 (0.0%) |
| 5 or more Children | 0 (0.0%) | 14 (100.0%) |
| Total | 0 (0.0%) | 43 (100.0%) |
Income Below Poverty Among Married-Couple vs Single-Parent Households in Wounded Knee
The poverty data for Wounded Knee shows that 17 of the married-couple family households (100.0%) and 43 of the single-parent households (100.0%) are living below the poverty level. Within the married-couple family households, those with 1 or 2 children have the highest poverty rate, with 17 households (100.0%) falling below the poverty line. Among the single-parent households, those with no children have the highest poverty rate, with 29 household (100.0%) living below poverty.
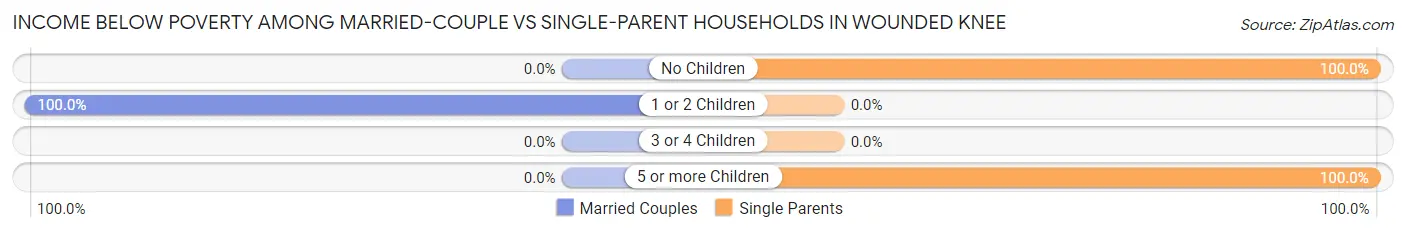
| Children | Married-Couple Families | Single-Parent Households |
| No Children | 0 (0.0%) | 29 (100.0%) |
| 1 or 2 Children | 17 (100.0%) | 0 (0.0%) |
| 3 or 4 Children | 0 (0.0%) | 0 (0.0%) |
| 5 or more Children | 0 (0.0%) | 14 (100.0%) |
| Total | 17 (100.0%) | 43 (100.0%) |
Race in Wounded Knee
The most populous races in Wounded Knee are , and Native / Alaskan (378 | 100.0%).
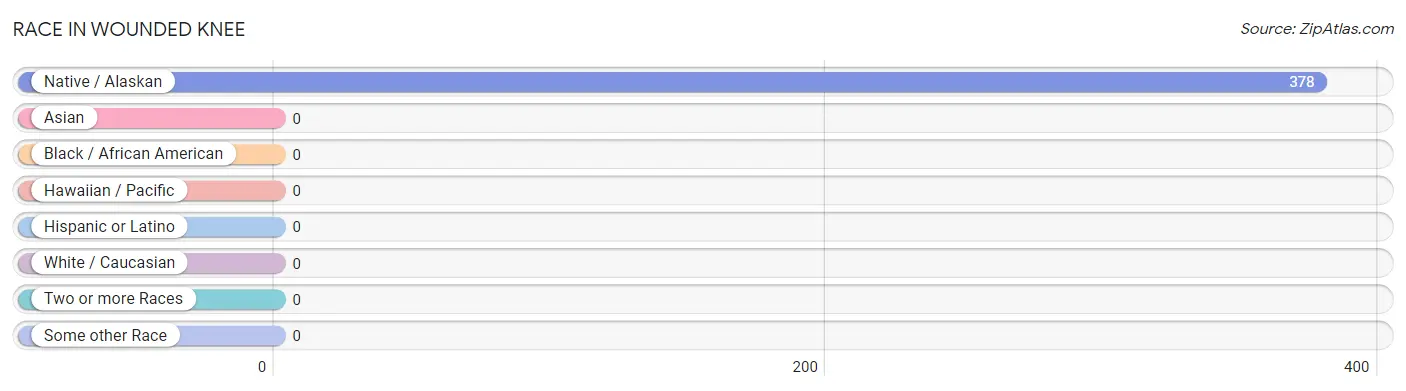
| Race | # Population | % Population |
| Asian | 0 | 0.0% |
| Black / African American | 0 | 0.0% |
| Hawaiian / Pacific | 0 | 0.0% |
| Hispanic or Latino | 0 | 0.0% |
| Native / Alaskan | 378 | 100.0% |
| White / Caucasian | 0 | 0.0% |
| Two or more Races | 0 | 0.0% |
| Some other Race | 0 | 0.0% |
| Total | 378 | 100.0% |
Ancestry in Wounded Knee
The most populous ancestries reported in Wounded Knee are Sioux (378 | 100.0%), and American (16 | 4.2%), together accounting for 104.2% of all Wounded Knee residents.
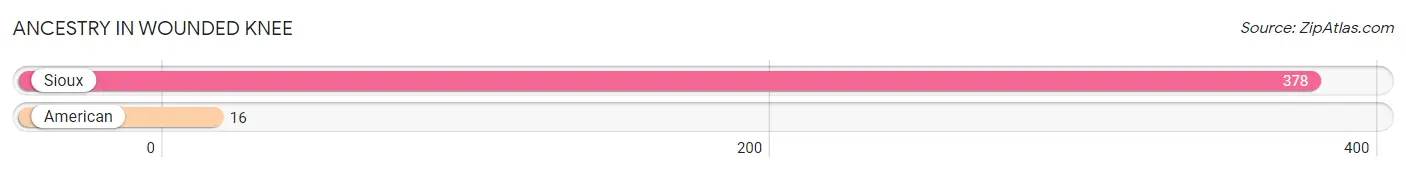
| Ancestry | # Population | % Population |
| American | 16 | 4.2% |
| Sioux | 378 | 100.0% | View All 2 Rows |
Immigrants in Wounded Knee

| Immigration Origin | # Population | % Population | View All 0 Rows |
Sex and Age in Wounded Knee
Sex and Age in Wounded Knee
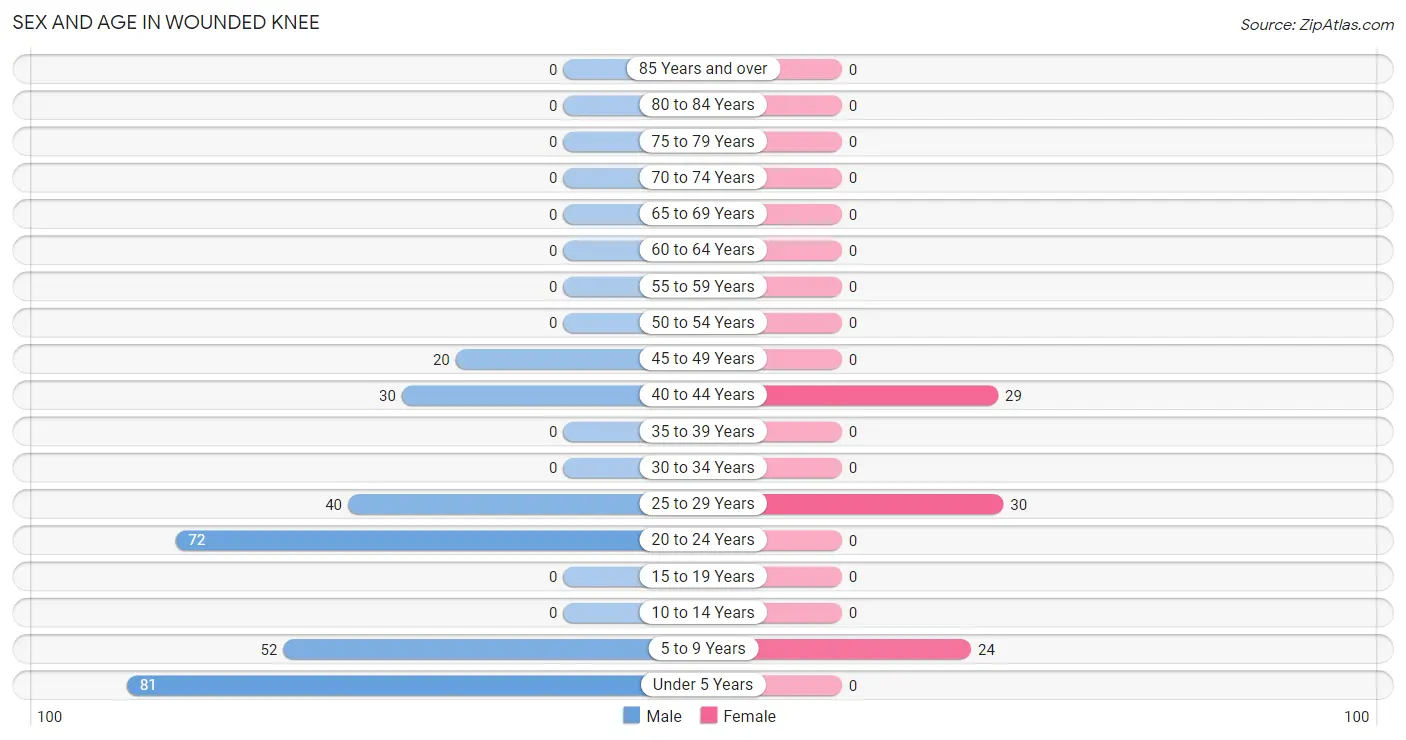
The most populous age groups in Wounded Knee are Under 5 Years (81 | 27.5%) for men and 25 to 29 Years (30 | 36.1%) for women.
| Age Bracket | Male | Female |
| Under 5 Years | 81 (27.5%) | 0 (0.0%) |
| 5 to 9 Years | 52 (17.6%) | 24 (28.9%) |
| 10 to 14 Years | 0 (0.0%) | 0 (0.0%) |
| 15 to 19 Years | 0 (0.0%) | 0 (0.0%) |
| 20 to 24 Years | 72 (24.4%) | 0 (0.0%) |
| 25 to 29 Years | 40 (13.6%) | 30 (36.1%) |
| 30 to 34 Years | 0 (0.0%) | 0 (0.0%) |
| 35 to 39 Years | 0 (0.0%) | 0 (0.0%) |
| 40 to 44 Years | 30 (10.2%) | 29 (34.9%) |
| 45 to 49 Years | 20 (6.8%) | 0 (0.0%) |
| 50 to 54 Years | 0 (0.0%) | 0 (0.0%) |
| 55 to 59 Years | 0 (0.0%) | 0 (0.0%) |
| 60 to 64 Years | 0 (0.0%) | 0 (0.0%) |
| 65 to 69 Years | 0 (0.0%) | 0 (0.0%) |
| 70 to 74 Years | 0 (0.0%) | 0 (0.0%) |
| 75 to 79 Years | 0 (0.0%) | 0 (0.0%) |
| 80 to 84 Years | 0 (0.0%) | 0 (0.0%) |
| 85 Years and over | 0 (0.0%) | 0 (0.0%) |
| Total | 295 (100.0%) | 83 (100.0%) |
Families and Households in Wounded Knee
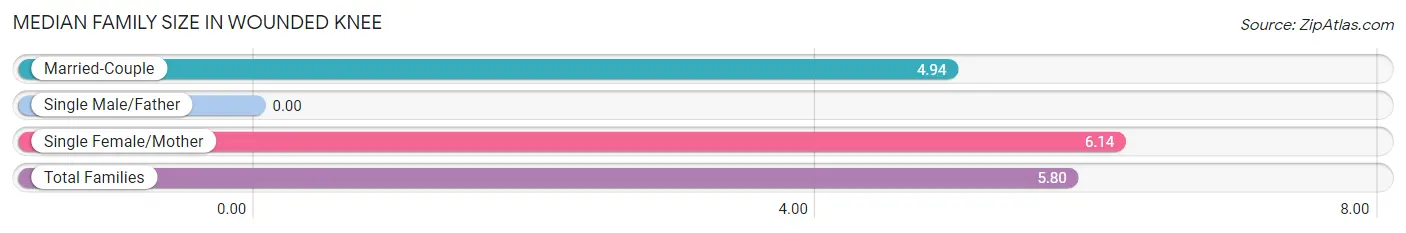
Median Family Size in Wounded Knee
| Family Type | # Families | Family Size |
| Married-Couple | 17 (28.3%) | 4.94 |
| Single Male/Father | 0 (0.0%) | - |
| Single Female/Mother | 43 (71.7%) | 6.14 |
| Total Families | 60 (100.0%) | 5.80 |
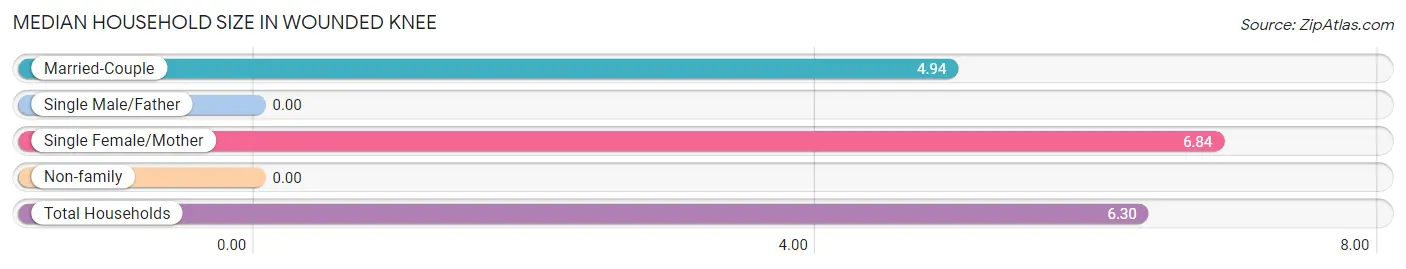
Median Household Size in Wounded Knee
| Household Type | # Households | Household Size |
| Married-Couple | 17 (28.3%) | 4.94 |
| Single Male/Father | 0 (0.0%) | - |
| Single Female/Mother | 43 (71.7%) | 6.84 |
| Non-family | 0 (0.0%) | - |
| Total Households | 60 (100.0%) | 6.30 |
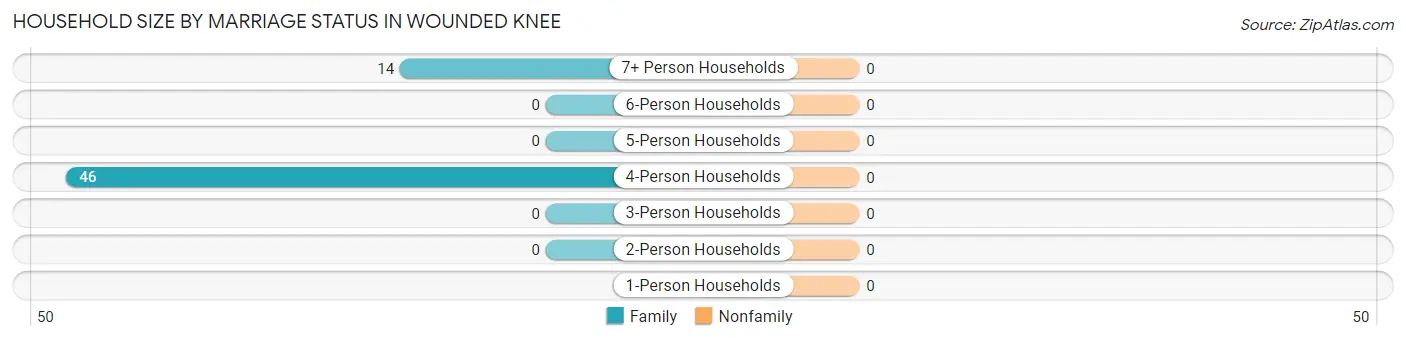
Household Size by Marriage Status in Wounded Knee
| Household Size | Family Households | Nonfamily Households |
| 1-Person Households | - | 0 (0.0%) |
| 2-Person Households | 0 (0.0%) | 0 (0.0%) |
| 3-Person Households | 0 (0.0%) | 0 (0.0%) |
| 4-Person Households | 46 (76.7%) | 0 (0.0%) |
| 5-Person Households | 0 (0.0%) | 0 (0.0%) |
| 6-Person Households | 0 (0.0%) | 0 (0.0%) |
| 7+ Person Households | 14 (23.3%) | 0 (0.0%) |
| Total | 60 (100.0%) | 0 (0.0%) |
Female Fertility in Wounded Knee
Fertility by Age in Wounded Knee
Average fertility rate in Wounded Knee is 237.0 births per 1,000 women. Women in the age bracket of 20 to 34 years have the highest fertility rate with 467.0 births per 1,000 women. Women in the age bracket of 20 to 34 years acount for 100.0% of all women with births.
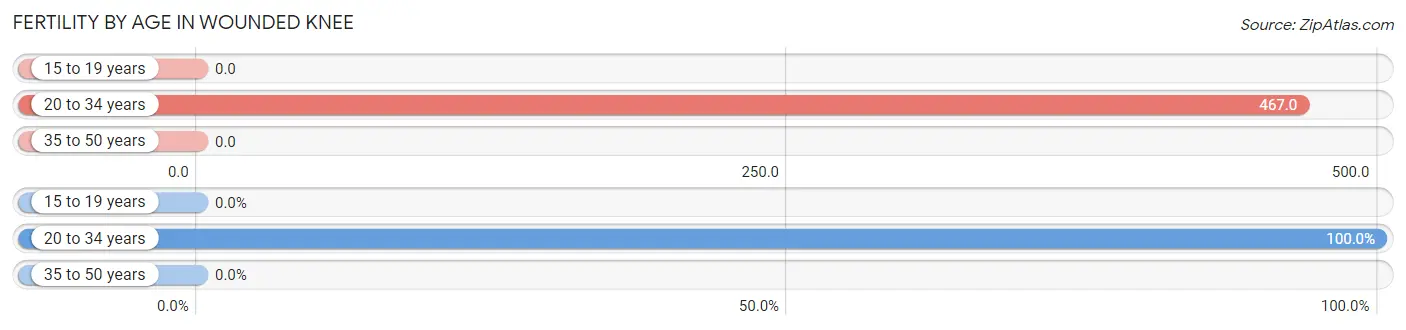
| Age Bracket | Women with Births | Births / 1,000 Women |
| 15 to 19 years | 0 (0.0%) | 0.0 |
| 20 to 34 years | 14 (100.0%) | 467.0 |
| 35 to 50 years | 0 (0.0%) | 0.0 |
| Total | 14 (100.0%) | 237.0 |
Fertility by Age by Marriage Status in Wounded Knee
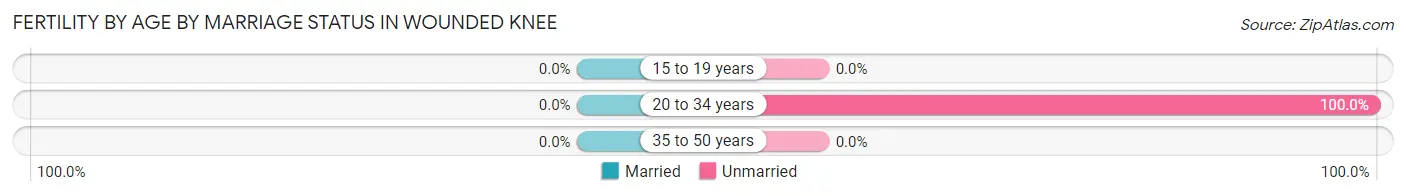
| Age Bracket | Married | Unmarried |
| 15 to 19 years | 0 (0.0%) | 0 (0.0%) |
| 20 to 34 years | 0 (0.0%) | 14 (100.0%) |
| 35 to 50 years | 0 (0.0%) | 0 (0.0%) |
| Total | 0 (0.0%) | 14 (100.0%) |
Fertility by Education in Wounded Knee
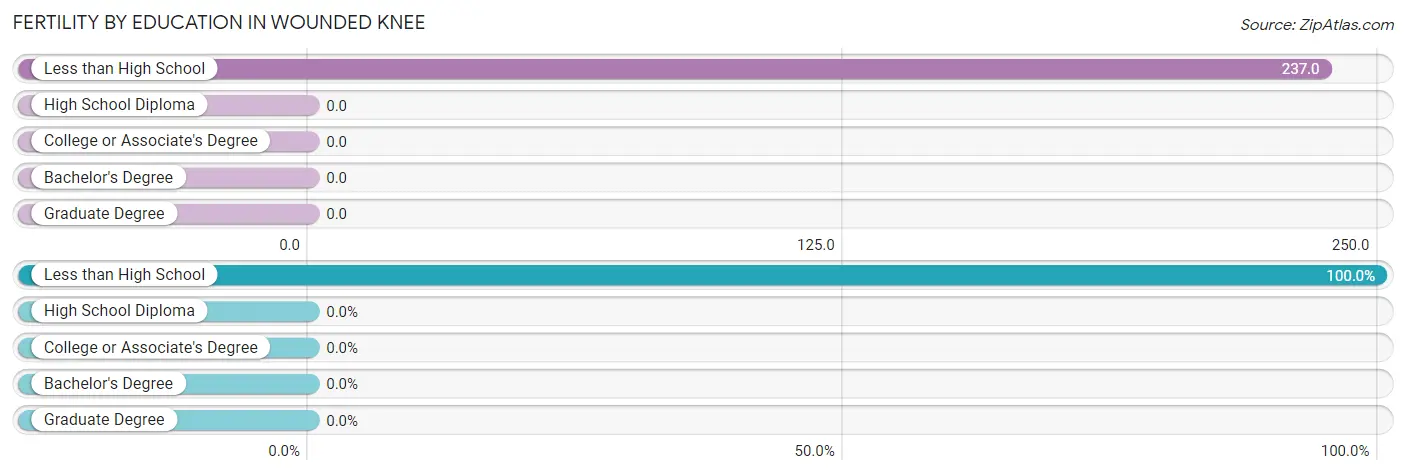
| Educational Attainment | Women with Births | Births / 1,000 Women |
| Less than High School | 14 (100.0%) | 237.0 |
| High School Diploma | 0 (0.0%) | 0.0 |
| College or Associate's Degree | 0 (0.0%) | 0.0 |
| Bachelor's Degree | 0 (0.0%) | 0.0 |
| Graduate Degree | 0 (0.0%) | 0.0 |
| Total | 14 (100.0%) | 237.0 |
Fertility by Education by Marriage Status in Wounded Knee
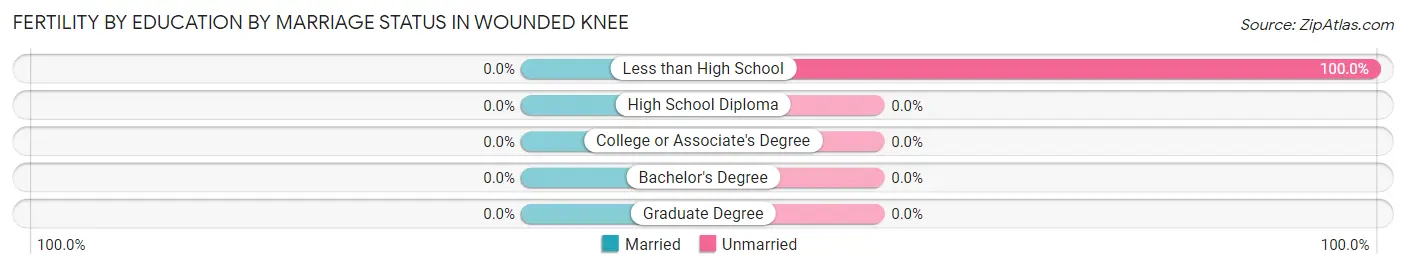
| Educational Attainment | Married | Unmarried |
| Less than High School | 0 (0.0%) | 14 (100.0%) |
| High School Diploma | 0 (0.0%) | 0 (0.0%) |
| College or Associate's Degree | 0 (0.0%) | 0 (0.0%) |
| Bachelor's Degree | 0 (0.0%) | 0 (0.0%) |
| Graduate Degree | 0 (0.0%) | 0 (0.0%) |
| Total | 0 (0.0%) | 14 (100.0%) |
Employment Characteristics in Wounded Knee
Employment by Class of Employer in Wounded Knee
| Employer Class | # Employees | % Employees |
| Private Company Employees | 0 | 0.0% |
| Self-Employed (Incorporated) | 0 | 0.0% |
| Self-Employed (Not Incorporated) | 0 | 0.0% |
| Not-for-profit Organizations | 0 | 0.0% |
| Local Government Employees | 0 | 0.0% |
| State Government Employees | 0 | 0.0% |
| Federal Government Employees | 0 | 0.0% |
| Unpaid Family Workers | 0 | 0.0% |
| Total | 0 | 0.0% |
Employment Status by Age in Wounded Knee
According to the labor force statistics for Wounded Knee, out of the total population over 16 years of age (221), 21.3% or 47 individuals are in the labor force, with 100.0% or 47 of them unemployed. The age group with the highest labor force participation rate is 25 to 29 years, with 67.1% or 47 individuals in the labor force. Within the labor force, the 25 to 29 years age range has the highest percentage of unemployed individuals, with 100.0% or 47 of them being unemployed.
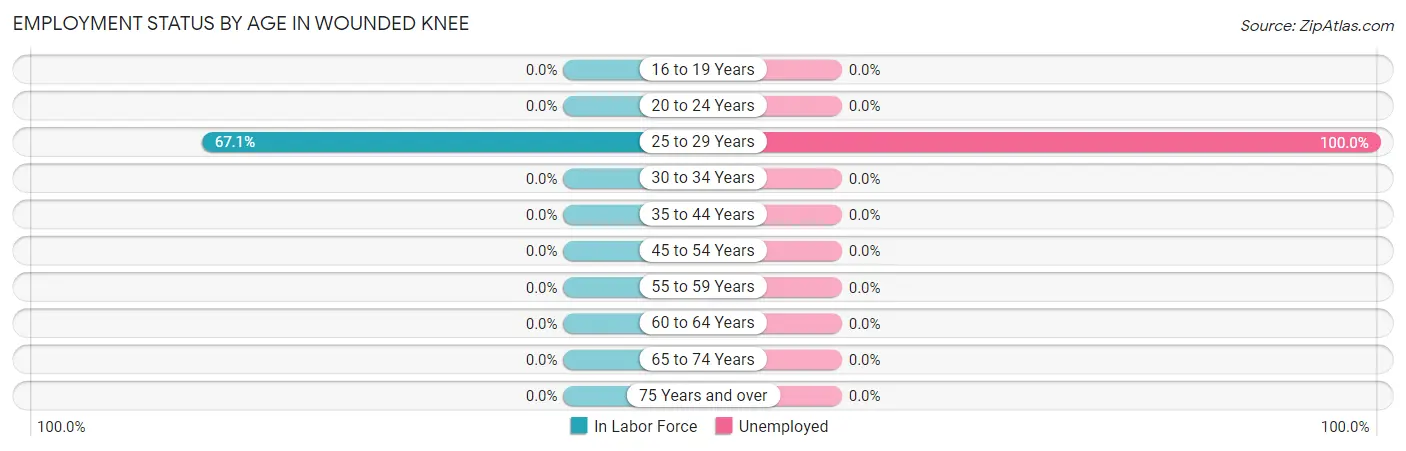
| Age Bracket | In Labor Force | Unemployed |
| 16 to 19 Years | 0 (0.0%) | 0 (0.0%) |
| 20 to 24 Years | 0 (0.0%) | 0 (0.0%) |
| 25 to 29 Years | 47 (67.1%) | 47 (100.0%) |
| 30 to 34 Years | 0 (0.0%) | 0 (0.0%) |
| 35 to 44 Years | 0 (0.0%) | 0 (0.0%) |
| 45 to 54 Years | 0 (0.0%) | 0 (0.0%) |
| 55 to 59 Years | 0 (0.0%) | 0 (0.0%) |
| 60 to 64 Years | 0 (0.0%) | 0 (0.0%) |
| 65 to 74 Years | 0 (0.0%) | 0 (0.0%) |
| 75 Years and over | 0 (0.0%) | 0 (0.0%) |
| Total | 47 (21.3%) | 47 (100.0%) |
Employment Status by Educational Attainment in Wounded Knee
According to labor force statistics for Wounded Knee, 31.5% of individuals (47) out of the total population between 25 and 64 years of age (149) are in the labor force, with 100.0% or 47 of them being unemployed. The group with the highest labor force participation rate are those with the educational attainment of college / associate degree, with 100.0% or 17 individuals in the labor force. Within the labor force, individuals with less than high school education have the highest percentage of unemployment, with 100.0% or 30 of them being unemployed.
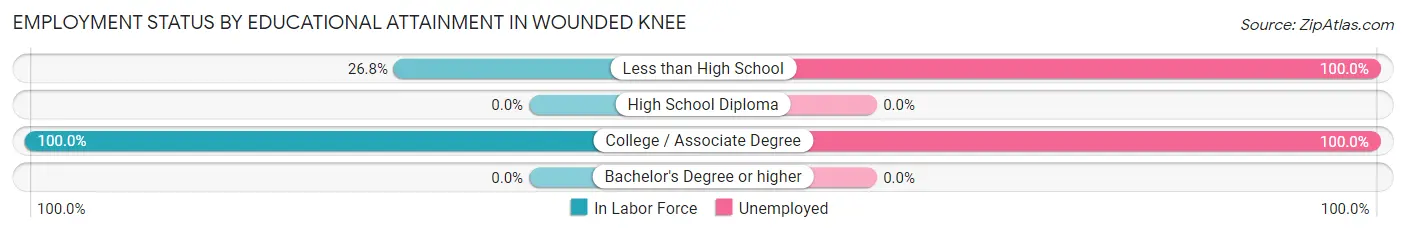
| Educational Attainment | In Labor Force | Unemployed |
| Less than High School | 30 (26.8%) | 112 (100.0%) |
| High School Diploma | 0 (0.0%) | 0 (0.0%) |
| College / Associate Degree | 17 (100.0%) | 17 (100.0%) |
| Bachelor's Degree or higher | 0 (0.0%) | 0 (0.0%) |
| Total | 47 (31.5%) | 149 (100.0%) |
Employment Occupations by Sex in Wounded Knee
Management, Business, Science and Arts Occupations
Management, Business, Science and Arts Occupations by Sex
| Occupation | Male | Female |
| Management | 0 (0.0%) | 0 (0.0%) |
| Business & Financial | 0 (0.0%) | 0 (0.0%) |
| Computers, Engineering & Science | 0 (0.0%) | 0 (0.0%) |
| Computers & Mathematics | 0 (0.0%) | 0 (0.0%) |
| Architecture & Engineering | 0 (0.0%) | 0 (0.0%) |
| Life, Physical & Social Science | 0 (0.0%) | 0 (0.0%) |
| Community & Social Service | 0 (0.0%) | 0 (0.0%) |
| Education, Arts & Media | 0 (0.0%) | 0 (0.0%) |
| Legal Services & Support | 0 (0.0%) | 0 (0.0%) |
| Education Instruction & Library | 0 (0.0%) | 0 (0.0%) |
| Arts, Media & Entertainment | 0 (0.0%) | 0 (0.0%) |
| Health Diagnosing & Treating | 0 (0.0%) | 0 (0.0%) |
| Health Technologists | 0 (0.0%) | 0 (0.0%) |
| Total (Category) | 0 (0.0%) | 0 (0.0%) |
| Total (Overall) | 0 (0.0%) | 0 (0.0%) |
Services Occupations
Services Occupations by Sex
| Occupation | Male | Female |
| Healthcare Support | 0 (0.0%) | 0 (0.0%) |
| Security & Protection | 0 (0.0%) | 0 (0.0%) |
| Firefighting & Prevention | 0 (0.0%) | 0 (0.0%) |
| Law Enforcement | 0 (0.0%) | 0 (0.0%) |
| Food Preparation & Serving | 0 (0.0%) | 0 (0.0%) |
| Cleaning & Maintenance | 0 (0.0%) | 0 (0.0%) |
| Personal Care & Service | 0 (0.0%) | 0 (0.0%) |
| Total (Category) | 0 (0.0%) | 0 (0.0%) |
| Total (Overall) | 0 (0.0%) | 0 (0.0%) |
Sales and Office Occupations
Sales and Office Occupations by Sex
| Occupation | Male | Female |
| Sales & Related | 0 (0.0%) | 0 (0.0%) |
| Office & Administration | 0 (0.0%) | 0 (0.0%) |
| Total (Category) | 0 (0.0%) | 0 (0.0%) |
| Total (Overall) | 0 (0.0%) | 0 (0.0%) |
Natural Resources, Construction and Maintenance Occupations
Natural Resources, Construction and Maintenance Occupations by Sex
| Occupation | Male | Female |
| Farming, Fishing & Forestry | 0 (0.0%) | 0 (0.0%) |
| Construction & Extraction | 0 (0.0%) | 0 (0.0%) |
| Installation, Maintenance & Repair | 0 (0.0%) | 0 (0.0%) |
| Total (Category) | 0 (0.0%) | 0 (0.0%) |
| Total (Overall) | 0 (0.0%) | 0 (0.0%) |
Production, Transportation and Moving Occupations
Production, Transportation and Moving Occupations by Sex
| Occupation | Male | Female |
| Production | 0 (0.0%) | 0 (0.0%) |
| Transportation | 0 (0.0%) | 0 (0.0%) |
| Material Moving | 0 (0.0%) | 0 (0.0%) |
| Total (Category) | 0 (0.0%) | 0 (0.0%) |
| Total (Overall) | 0 (0.0%) | 0 (0.0%) |
Employment Industries by Sex in Wounded Knee
Employment Industries in Wounded Knee
Employment Industries by Sex in Wounded Knee
| Industry | Male | Female |
| Agriculture, Fishing & Hunting | 0 (0.0%) | 0 (0.0%) |
| Mining, Quarrying, & Extraction | 0 (0.0%) | 0 (0.0%) |
| Construction | 0 (0.0%) | 0 (0.0%) |
| Manufacturing | 0 (0.0%) | 0 (0.0%) |
| Wholesale Trade | 0 (0.0%) | 0 (0.0%) |
| Retail Trade | 0 (0.0%) | 0 (0.0%) |
| Transportation & Warehousing | 0 (0.0%) | 0 (0.0%) |
| Utilities | 0 (0.0%) | 0 (0.0%) |
| Information | 0 (0.0%) | 0 (0.0%) |
| Finance & Insurance | 0 (0.0%) | 0 (0.0%) |
| Real Estate, Rental & Leasing | 0 (0.0%) | 0 (0.0%) |
| Professional & Scientific | 0 (0.0%) | 0 (0.0%) |
| Enterprise Management | 0 (0.0%) | 0 (0.0%) |
| Administrative & Support | 0 (0.0%) | 0 (0.0%) |
| Educational Services | 0 (0.0%) | 0 (0.0%) |
| Health Care & Social Assistance | 0 (0.0%) | 0 (0.0%) |
| Arts, Entertainment & Recreation | 0 (0.0%) | 0 (0.0%) |
| Accommodation & Food Services | 0 (0.0%) | 0 (0.0%) |
| Public Administration | 0 (0.0%) | 0 (0.0%) |
| Total | 0 (0.0%) | 0 (0.0%) |
Education in Wounded Knee
School Enrollment in Wounded Knee
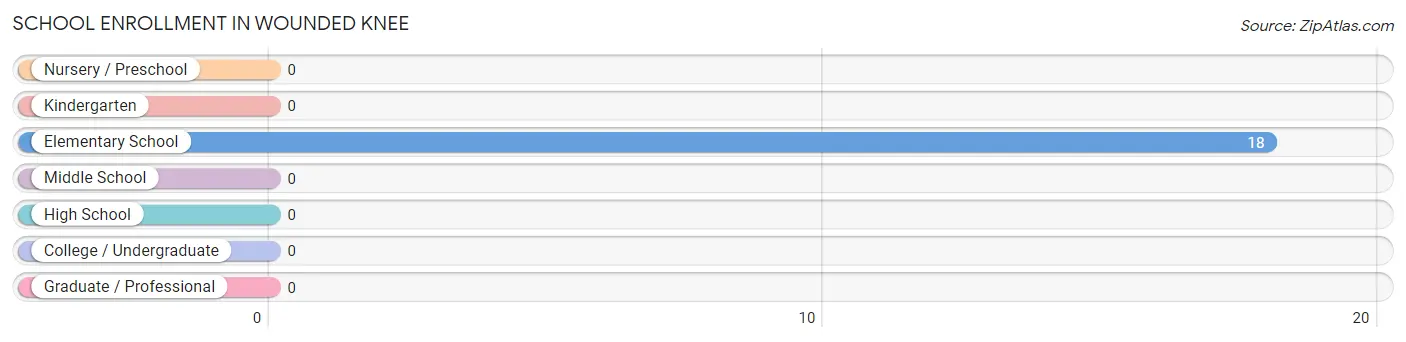
| School Level | # Students | % Students |
| Nursery / Preschool | 0 | 0.0% |
| Kindergarten | 0 | 0.0% |
| Elementary School | 18 | 100.0% |
| Middle School | 0 | 0.0% |
| High School | 0 | 0.0% |
| College / Undergraduate | 0 | 0.0% |
| Graduate / Professional | 0 | 0.0% |
| Total | 18 | 100.0% |
School Enrollment by Age by Funding Source in Wounded Knee
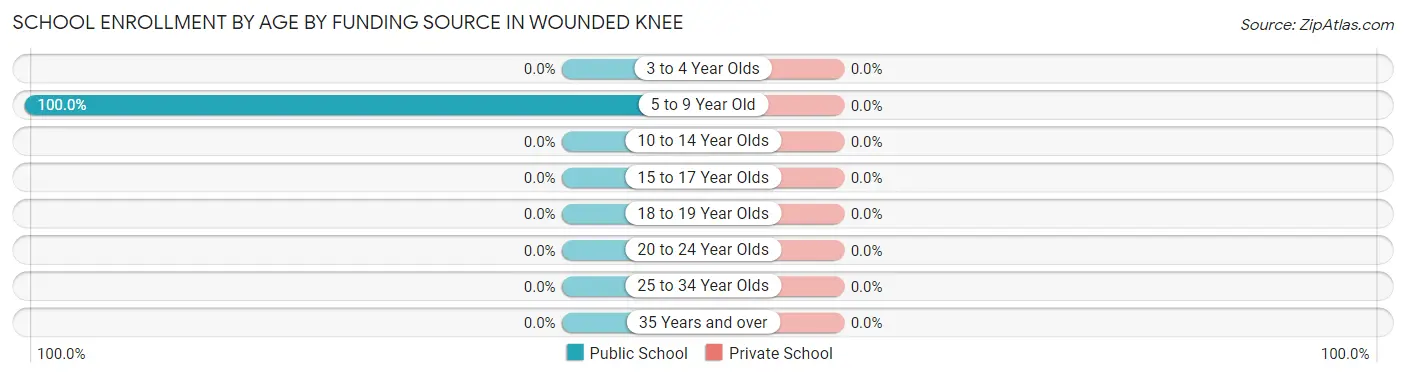
| Age Bracket | Public School | Private School |
| 3 to 4 Year Olds | 0 (0.0%) | 0 (0.0%) |
| 5 to 9 Year Old | 18 (100.0%) | 0 (0.0%) |
| 10 to 14 Year Olds | 0 (0.0%) | 0 (0.0%) |
| 15 to 17 Year Olds | 0 (0.0%) | 0 (0.0%) |
| 18 to 19 Year Olds | 0 (0.0%) | 0 (0.0%) |
| 20 to 24 Year Olds | 0 (0.0%) | 0 (0.0%) |
| 25 to 34 Year Olds | 0 (0.0%) | 0 (0.0%) |
| 35 Years and over | 0 (0.0%) | 0 (0.0%) |
| Total | 18 (100.0%) | 0 (0.0%) |
Educational Attainment by Field of Study in Wounded Knee
| Field of Study | # Graduates | % Graduates |
| Computers & Mathematics | 0 | 0.0% |
| Bio, Nature & Agricultural | 0 | 0.0% |
| Physical & Health Sciences | 0 | 0.0% |
| Psychology | 0 | 0.0% |
| Social Sciences | 0 | 0.0% |
| Engineering | 0 | 0.0% |
| Multidisciplinary Studies | 0 | 0.0% |
| Science & Technology | 0 | 0.0% |
| Business | 0 | 0.0% |
| Education | 0 | 0.0% |
| Literature & Languages | 0 | 0.0% |
| Liberal Arts & History | 0 | 0.0% |
| Visual & Performing Arts | 0 | 0.0% |
| Communications | 0 | 0.0% |
| Arts & Humanities | 0 | 0.0% |
| Total | 0 | 0.0% |
Transportation & Commute in Wounded Knee
Vehicle Availability by Sex in Wounded Knee
| Vehicles Available | Male | Female |
| No Vehicle | 0 (0.0%) | 0 (0.0%) |
| 1 Vehicle | 0 (0.0%) | 0 (0.0%) |
| 2 Vehicles | 0 (0.0%) | 0 (0.0%) |
| 3 Vehicles | 0 (0.0%) | 0 (0.0%) |
| 4 Vehicles | 0 (0.0%) | 0 (0.0%) |
| 5 or more Vehicles | 0 (0.0%) | 0 (0.0%) |
| Total | 0 (0.0%) | 0 (0.0%) |
Commute Time in Wounded Knee
| Commute Time | # Commuters | % Commuters |
| Less than 5 Minutes | 0 | 0.0% |
| 5 to 9 Minutes | 0 | 0.0% |
| 10 to 14 Minutes | 0 | 0.0% |
| 15 to 19 Minutes | 0 | 0.0% |
| 20 to 24 Minutes | 0 | 0.0% |
| 25 to 29 Minutes | 0 | 0.0% |
| 30 to 34 Minutes | 0 | 0.0% |
| 35 to 39 Minutes | 0 | 0.0% |
| 40 to 44 Minutes | 0 | 0.0% |
| 45 to 59 Minutes | 0 | 0.0% |
| 60 to 89 Minutes | 0 | 0.0% |
| 90 or more Minutes | 0 | 0.0% |
Commute Time by Sex in Wounded Knee
| Commute Time | Male | Female |
| Less than 5 Minutes | 0 (0.0%) | 0 (0.0%) |
| 5 to 9 Minutes | 0 (0.0%) | 0 (0.0%) |
| 10 to 14 Minutes | 0 (0.0%) | 0 (0.0%) |
| 15 to 19 Minutes | 0 (0.0%) | 0 (0.0%) |
| 20 to 24 Minutes | 0 (0.0%) | 0 (0.0%) |
| 25 to 29 Minutes | 0 (0.0%) | 0 (0.0%) |
| 30 to 34 Minutes | 0 (0.0%) | 0 (0.0%) |
| 35 to 39 Minutes | 0 (0.0%) | 0 (0.0%) |
| 40 to 44 Minutes | 0 (0.0%) | 0 (0.0%) |
| 45 to 59 Minutes | 0 (0.0%) | 0 (0.0%) |
| 60 to 89 Minutes | 0 (0.0%) | 0 (0.0%) |
| 90 or more Minutes | 0 (0.0%) | 0 (0.0%) |
Time of Departure to Work by Sex in Wounded Knee
| Time of Departure | Male | Female |
| 12:00 AM to 4:59 AM | 0 (0.0%) | 0 (0.0%) |
| 5:00 AM to 5:29 AM | 0 (0.0%) | 0 (0.0%) |
| 5:30 AM to 5:59 AM | 0 (0.0%) | 0 (0.0%) |
| 6:00 AM to 6:29 AM | 0 (0.0%) | 0 (0.0%) |
| 6:30 AM to 6:59 AM | 0 (0.0%) | 0 (0.0%) |
| 7:00 AM to 7:29 AM | 0 (0.0%) | 0 (0.0%) |
| 7:30 AM to 7:59 AM | 0 (0.0%) | 0 (0.0%) |
| 8:00 AM to 8:29 AM | 0 (0.0%) | 0 (0.0%) |
| 8:30 AM to 8:59 AM | 0 (0.0%) | 0 (0.0%) |
| 9:00 AM to 9:59 AM | 0 (0.0%) | 0 (0.0%) |
| 10:00 AM to 10:59 AM | 0 (0.0%) | 0 (0.0%) |
| 11:00 AM to 11:59 AM | 0 (0.0%) | 0 (0.0%) |
| 12:00 PM to 3:59 PM | 0 (0.0%) | 0 (0.0%) |
| 4:00 PM to 11:59 PM | 0 (0.0%) | 0 (0.0%) |
| Total | 0 (0.0%) | 0 (0.0%) |
Housing Occupancy in Wounded Knee
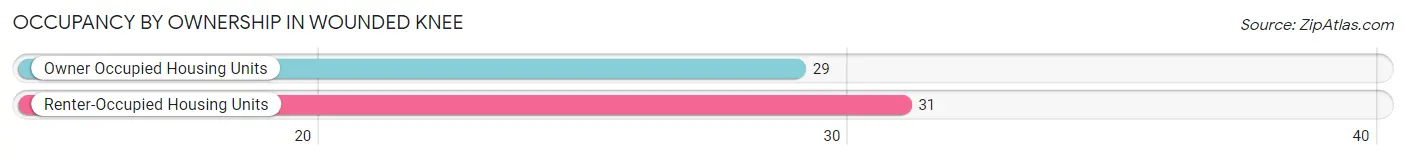
Occupancy by Ownership in Wounded Knee
Of the total 60 dwellings in Wounded Knee, owner-occupied units account for 29 (48.3%), while renter-occupied units make up 31 (51.7%).
| Occupancy | # Housing Units | % Housing Units |
| Owner Occupied Housing Units | 29 | 48.3% |
| Renter-Occupied Housing Units | 31 | 51.7% |
| Total Occupied Housing Units | 60 | 100.0% |
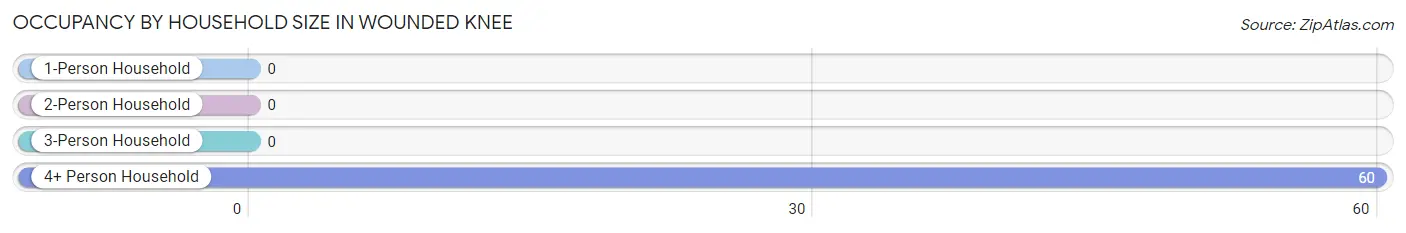
Occupancy by Household Size in Wounded Knee
| Household Size | # Housing Units | % Housing Units |
| 1-Person Household | 0 | 0.0% |
| 2-Person Household | 0 | 0.0% |
| 3-Person Household | 0 | 0.0% |
| 4+ Person Household | 60 | 100.0% |
| Total Housing Units | 60 | 100.0% |
Occupancy by Ownership by Household Size in Wounded Knee
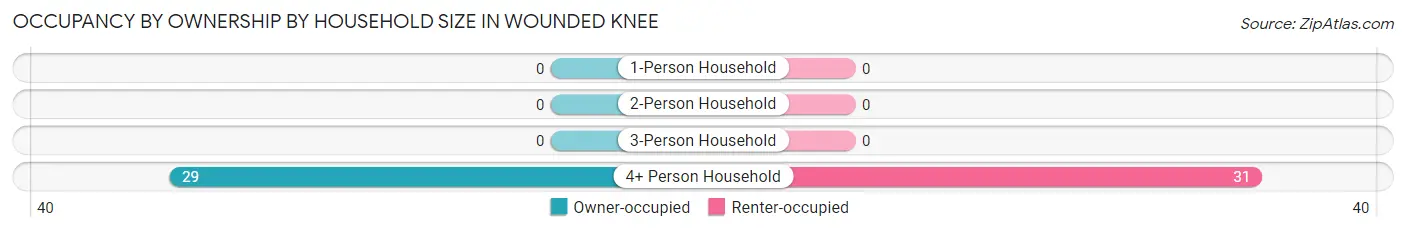
| Household Size | Owner-occupied | Renter-occupied |
| 1-Person Household | 0 (0.0%) | 0 (0.0%) |
| 2-Person Household | 0 (0.0%) | 0 (0.0%) |
| 3-Person Household | 0 (0.0%) | 0 (0.0%) |
| 4+ Person Household | 29 (48.3%) | 31 (51.7%) |
| Total Housing Units | 29 (48.3%) | 31 (51.7%) |
Occupancy by Educational Attainment in Wounded Knee
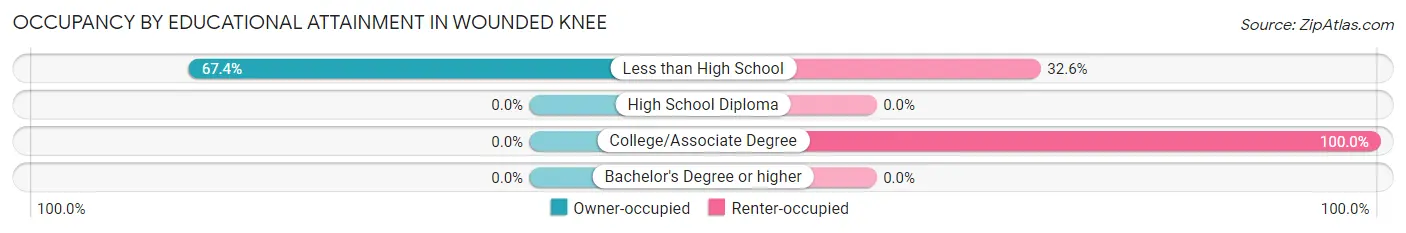
| Household Size | Owner-occupied | Renter-occupied |
| Less than High School | 29 (67.4%) | 14 (32.6%) |
| High School Diploma | 0 (0.0%) | 0 (0.0%) |
| College/Associate Degree | 0 (0.0%) | 17 (100.0%) |
| Bachelor's Degree or higher | 0 (0.0%) | 0 (0.0%) |
Occupancy by Age of Householder in Wounded Knee
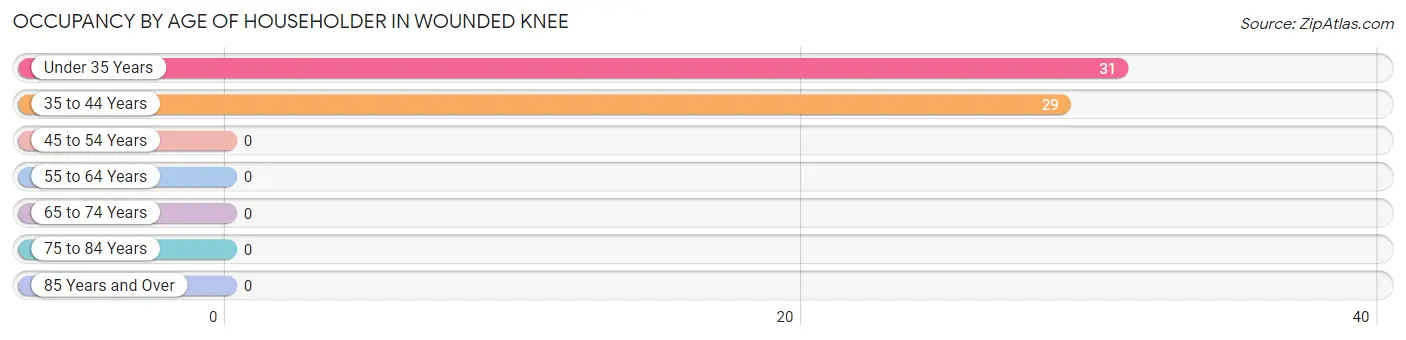
| Age Bracket | # Households | % Households |
| Under 35 Years | 31 | 51.7% |
| 35 to 44 Years | 29 | 48.3% |
| 45 to 54 Years | 0 | 0.0% |
| 55 to 64 Years | 0 | 0.0% |
| 65 to 74 Years | 0 | 0.0% |
| 75 to 84 Years | 0 | 0.0% |
| 85 Years and Over | 0 | 0.0% |
| Total | 60 | 100.0% |
Housing Finances in Wounded Knee
Median Income by Occupancy in Wounded Knee
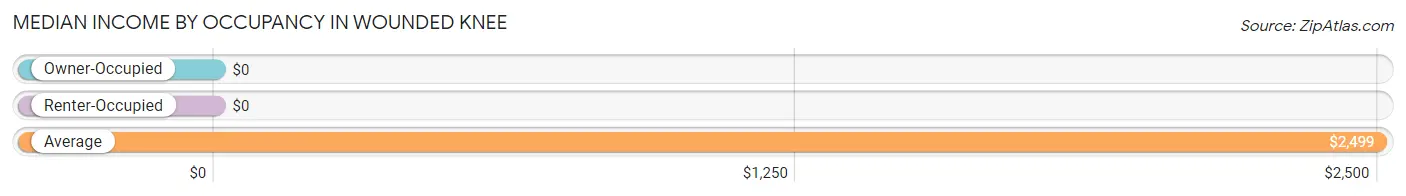
| Occupancy Type | # Households | Median Income |
| Owner-Occupied | 29 (48.3%) | $0 |
| Renter-Occupied | 31 (51.7%) | $0 |
| Average | 60 (100.0%) | $2,499 |
Occupancy by Householder Income Bracket in Wounded Knee
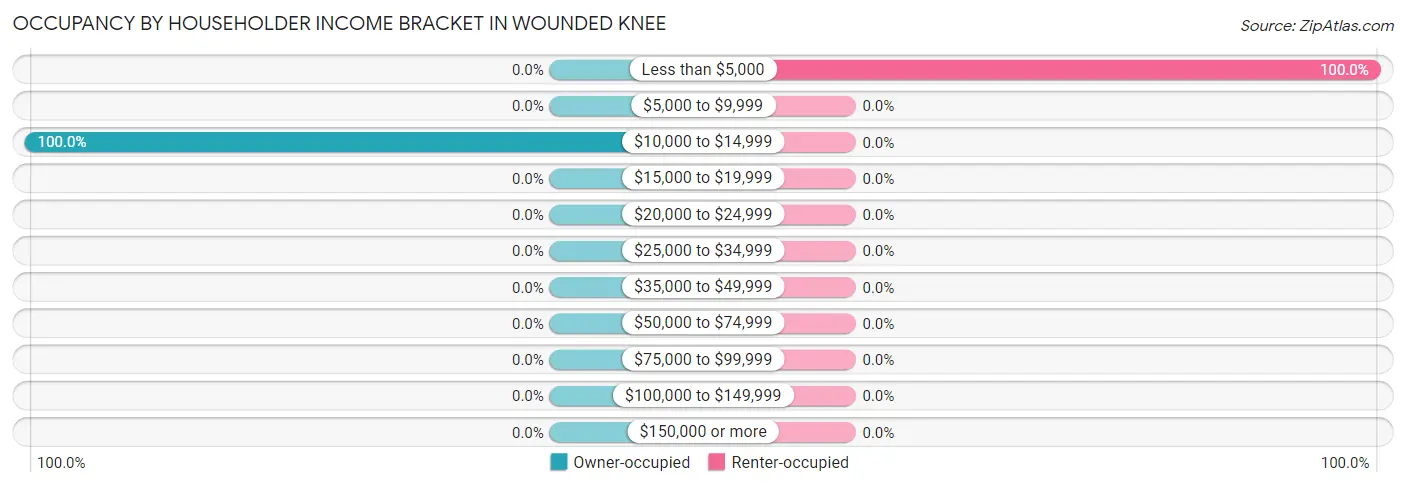
| Income Bracket | Owner-occupied | Renter-occupied |
| Less than $5,000 | 0 (0.0%) | 31 (100.0%) |
| $5,000 to $9,999 | 0 (0.0%) | 0 (0.0%) |
| $10,000 to $14,999 | 29 (100.0%) | 0 (0.0%) |
| $15,000 to $19,999 | 0 (0.0%) | 0 (0.0%) |
| $20,000 to $24,999 | 0 (0.0%) | 0 (0.0%) |
| $25,000 to $34,999 | 0 (0.0%) | 0 (0.0%) |
| $35,000 to $49,999 | 0 (0.0%) | 0 (0.0%) |
| $50,000 to $74,999 | 0 (0.0%) | 0 (0.0%) |
| $75,000 to $99,999 | 0 (0.0%) | 0 (0.0%) |
| $100,000 to $149,999 | 0 (0.0%) | 0 (0.0%) |
| $150,000 or more | 0 (0.0%) | 0 (0.0%) |
| Total | 29 (100.0%) | 31 (100.0%) |
Monthly Housing Cost Tiers in Wounded Knee
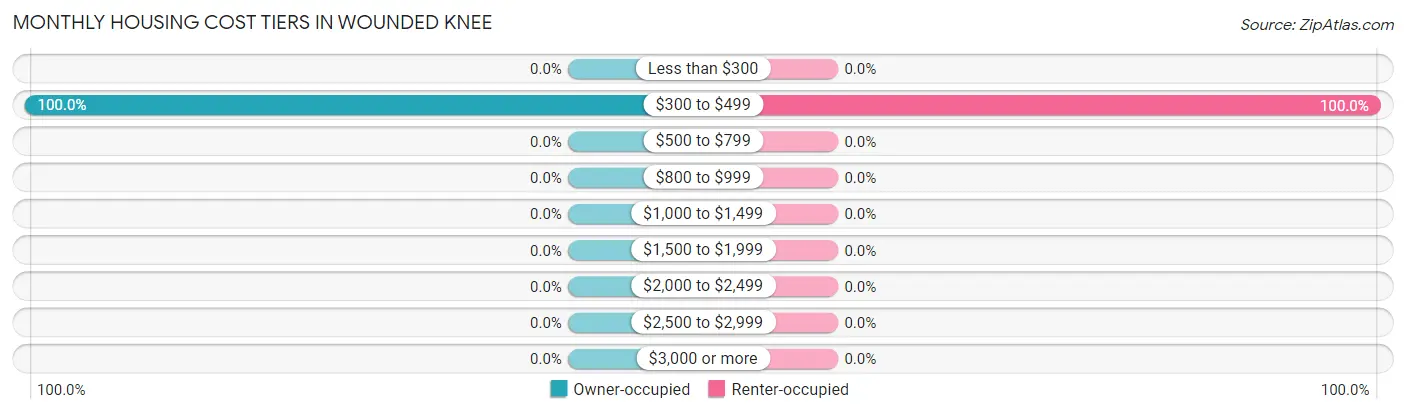
| Monthly Cost | Owner-occupied | Renter-occupied |
| Less than $300 | 0 (0.0%) | 0 (0.0%) |
| $300 to $499 | 29 (100.0%) | 31 (100.0%) |
| $500 to $799 | 0 (0.0%) | 0 (0.0%) |
| $800 to $999 | 0 (0.0%) | 0 (0.0%) |
| $1,000 to $1,499 | 0 (0.0%) | 0 (0.0%) |
| $1,500 to $1,999 | 0 (0.0%) | 0 (0.0%) |
| $2,000 to $2,499 | 0 (0.0%) | 0 (0.0%) |
| $2,500 to $2,999 | 0 (0.0%) | 0 (0.0%) |
| $3,000 or more | 0 (0.0%) | 0 (0.0%) |
| Total | 29 (100.0%) | 31 (100.0%) |
Physical Housing Characteristics in Wounded Knee
Housing Structures in Wounded Knee
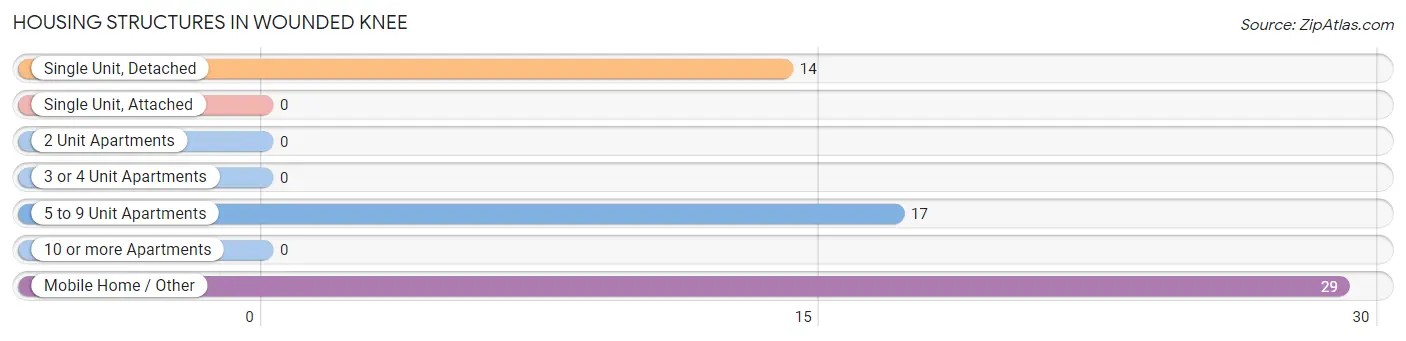
| Structure Type | # Housing Units | % Housing Units |
| Single Unit, Detached | 14 | 23.3% |
| Single Unit, Attached | 0 | 0.0% |
| 2 Unit Apartments | 0 | 0.0% |
| 3 or 4 Unit Apartments | 0 | 0.0% |
| 5 to 9 Unit Apartments | 17 | 28.3% |
| 10 or more Apartments | 0 | 0.0% |
| Mobile Home / Other | 29 | 48.3% |
| Total | 60 | 100.0% |
Housing Structures by Occupancy in Wounded Knee
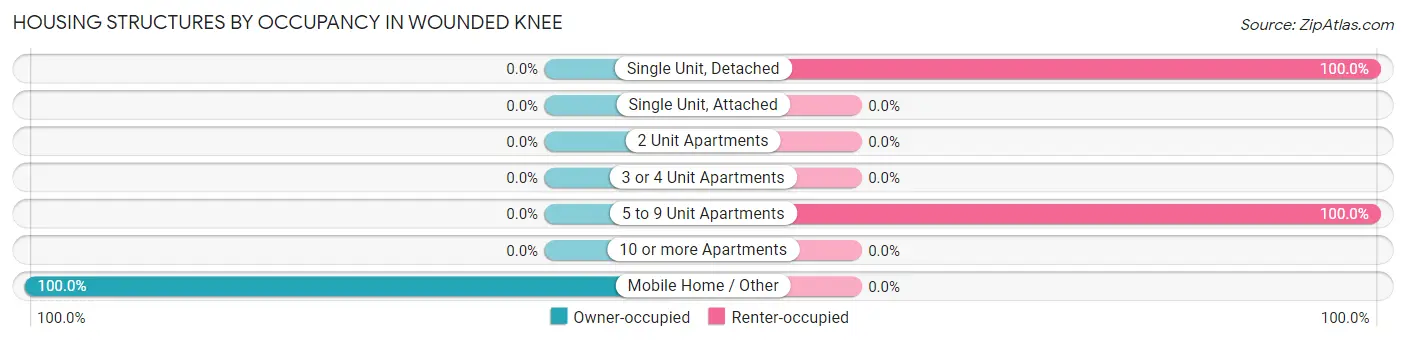
| Structure Type | Owner-occupied | Renter-occupied |
| Single Unit, Detached | 0 (0.0%) | 14 (100.0%) |
| Single Unit, Attached | 0 (0.0%) | 0 (0.0%) |
| 2 Unit Apartments | 0 (0.0%) | 0 (0.0%) |
| 3 or 4 Unit Apartments | 0 (0.0%) | 0 (0.0%) |
| 5 to 9 Unit Apartments | 0 (0.0%) | 17 (100.0%) |
| 10 or more Apartments | 0 (0.0%) | 0 (0.0%) |
| Mobile Home / Other | 29 (100.0%) | 0 (0.0%) |
| Total | 29 (48.3%) | 31 (51.7%) |
Housing Structures by Number of Rooms in Wounded Knee
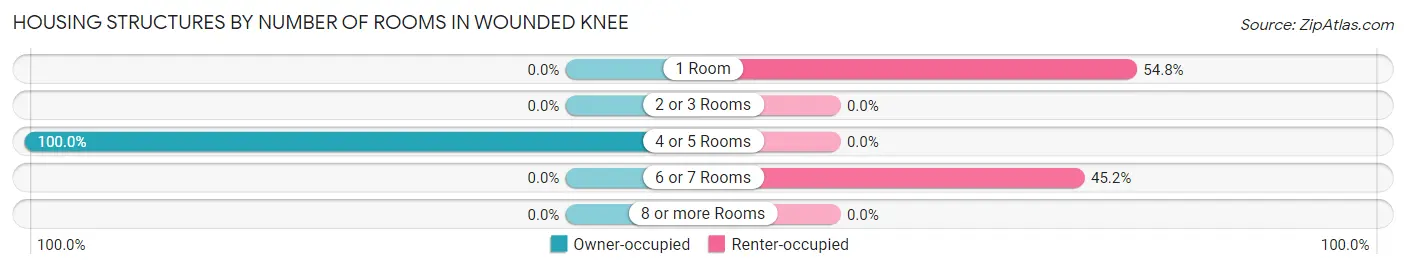
| Number of Rooms | Owner-occupied | Renter-occupied |
| 1 Room | 0 (0.0%) | 17 (54.8%) |
| 2 or 3 Rooms | 0 (0.0%) | 0 (0.0%) |
| 4 or 5 Rooms | 29 (100.0%) | 0 (0.0%) |
| 6 or 7 Rooms | 0 (0.0%) | 14 (45.2%) |
| 8 or more Rooms | 0 (0.0%) | 0 (0.0%) |
| Total | 29 (100.0%) | 31 (100.0%) |
Housing Structure by Heating Type in Wounded Knee
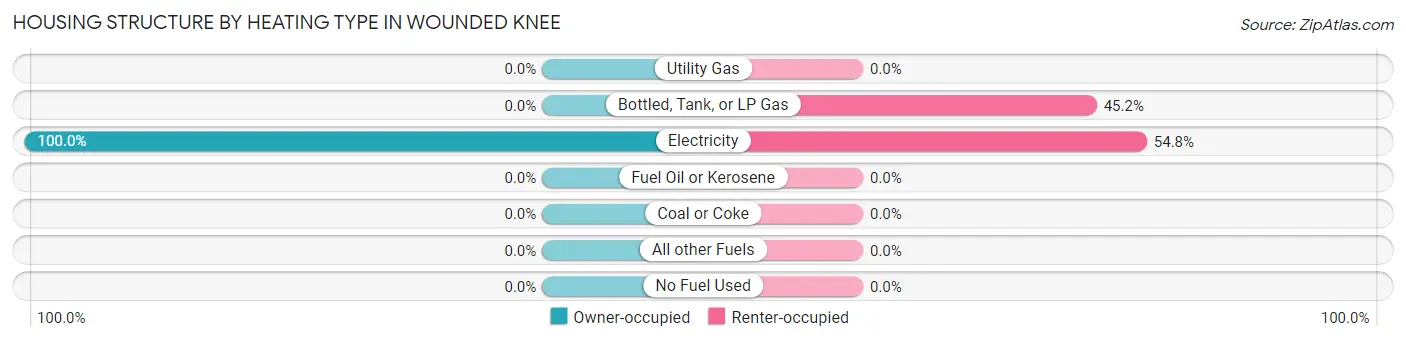
| Heating Type | Owner-occupied | Renter-occupied |
| Utility Gas | 0 (0.0%) | 0 (0.0%) |
| Bottled, Tank, or LP Gas | 0 (0.0%) | 14 (45.2%) |
| Electricity | 29 (100.0%) | 17 (54.8%) |
| Fuel Oil or Kerosene | 0 (0.0%) | 0 (0.0%) |
| Coal or Coke | 0 (0.0%) | 0 (0.0%) |
| All other Fuels | 0 (0.0%) | 0 (0.0%) |
| No Fuel Used | 0 (0.0%) | 0 (0.0%) |
| Total | 29 (100.0%) | 31 (100.0%) |
Household Vehicle Usage in Wounded Knee
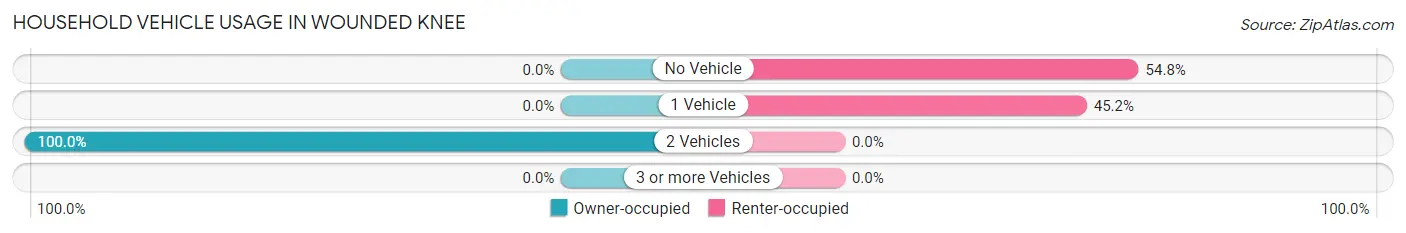
| Vehicles per Household | Owner-occupied | Renter-occupied |
| No Vehicle | 0 (0.0%) | 17 (54.8%) |
| 1 Vehicle | 0 (0.0%) | 14 (45.2%) |
| 2 Vehicles | 29 (100.0%) | 0 (0.0%) |
| 3 or more Vehicles | 0 (0.0%) | 0 (0.0%) |
| Total | 29 (100.0%) | 31 (100.0%) |
Real Estate & Mortgages in Wounded Knee
Real Estate and Mortgage Overview in Wounded Knee
| Characteristic | Without Mortgage | With Mortgage |
| Housing Units | 29 | 0 |
| Median Property Value | - | - |
| Median Household Income | - | - |
| Monthly Housing Costs | - | - |
| Real Estate Taxes | - | - |
Property Value by Mortgage Status in Wounded Knee
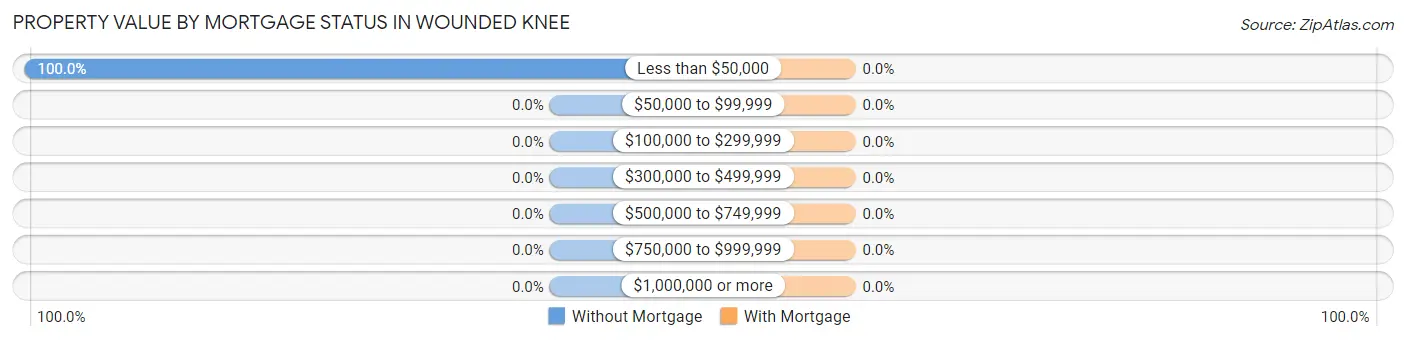
| Property Value | Without Mortgage | With Mortgage |
| Less than $50,000 | 29 (100.0%) | 0 (0.0%) |
| $50,000 to $99,999 | 0 (0.0%) | 0 (0.0%) |
| $100,000 to $299,999 | 0 (0.0%) | 0 (0.0%) |
| $300,000 to $499,999 | 0 (0.0%) | 0 (0.0%) |
| $500,000 to $749,999 | 0 (0.0%) | 0 (0.0%) |
| $750,000 to $999,999 | 0 (0.0%) | 0 (0.0%) |
| $1,000,000 or more | 0 (0.0%) | 0 (0.0%) |
| Total | 29 (100.0%) | 0 (0.0%) |
Household Income by Mortgage Status in Wounded Knee
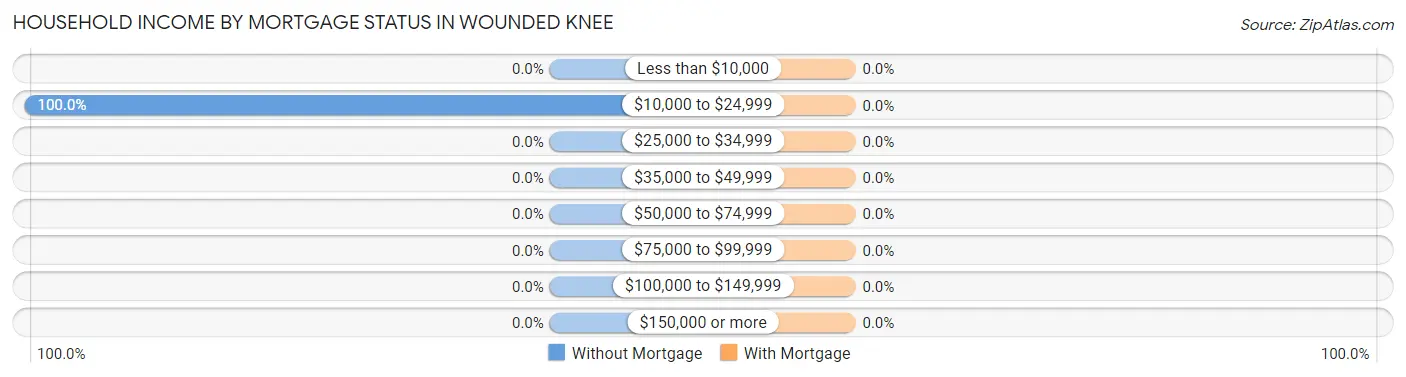
| Household Income | Without Mortgage | With Mortgage |
| Less than $10,000 | 0 (0.0%) | 0 (0.0%) |
| $10,000 to $24,999 | 29 (100.0%) | 0 (0.0%) |
| $25,000 to $34,999 | 0 (0.0%) | 0 (0.0%) |
| $35,000 to $49,999 | 0 (0.0%) | 0 (0.0%) |
| $50,000 to $74,999 | 0 (0.0%) | 0 (0.0%) |
| $75,000 to $99,999 | 0 (0.0%) | 0 (0.0%) |
| $100,000 to $149,999 | 0 (0.0%) | 0 (0.0%) |
| $150,000 or more | 0 (0.0%) | 0 (0.0%) |
| Total | 29 (100.0%) | 0 (0.0%) |
Property Value to Household Income Ratio in Wounded Knee
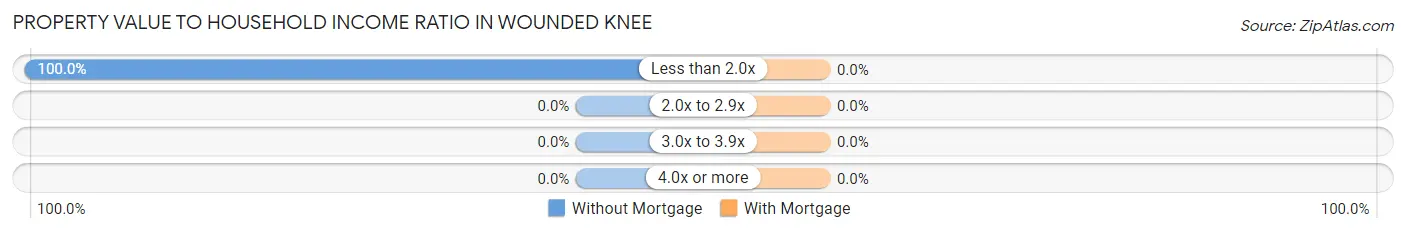
| Value-to-Income Ratio | Without Mortgage | With Mortgage |
| Less than 2.0x | 29 (100.0%) | 0 (0.0%) |
| 2.0x to 2.9x | 0 (0.0%) | 0 (0.0%) |
| 3.0x to 3.9x | 0 (0.0%) | 0 (0.0%) |
| 4.0x or more | 0 (0.0%) | 0 (0.0%) |
| Total | 29 (100.0%) | 0 (0.0%) |
Real Estate Taxes by Mortgage Status in Wounded Knee
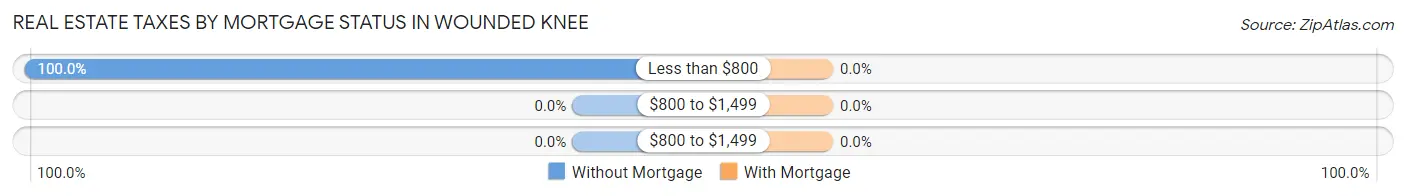
| Property Taxes | Without Mortgage | With Mortgage |
| Less than $800 | 29 (100.0%) | 0 (0.0%) |
| $800 to $1,499 | 0 (0.0%) | 0 (0.0%) |
| $800 to $1,499 | 0 (0.0%) | 0 (0.0%) |
| Total | 29 (100.0%) | 0 (0.0%) |
Health & Disability in Wounded Knee
Health Insurance Coverage by Age in Wounded Knee
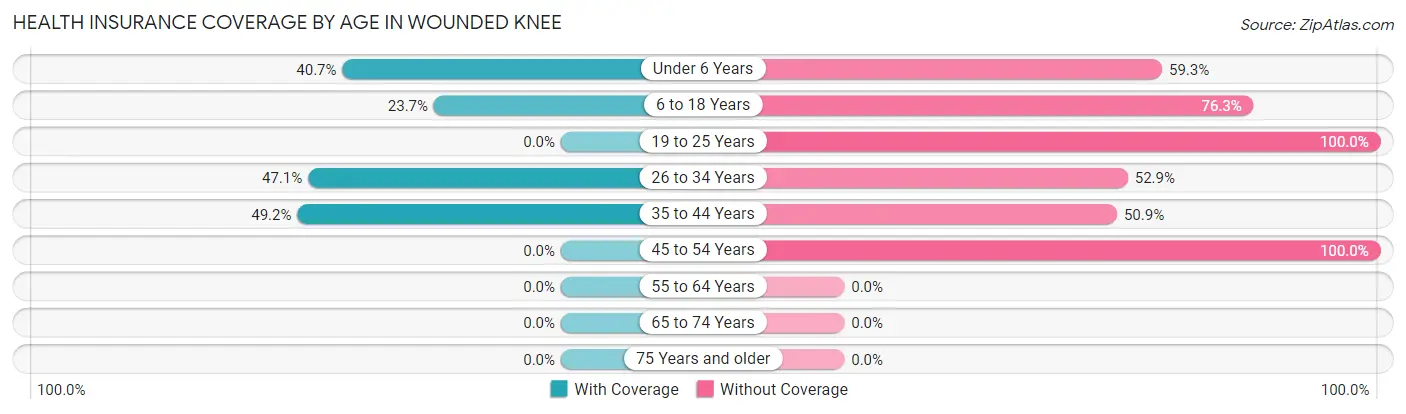
| Age Bracket | With Coverage | Without Coverage |
| Under 6 Years | 33 (40.7%) | 48 (59.3%) |
| 6 to 18 Years | 18 (23.7%) | 58 (76.3%) |
| 19 to 25 Years | 0 (0.0%) | 72 (100.0%) |
| 26 to 34 Years | 33 (47.1%) | 37 (52.9%) |
| 35 to 44 Years | 29 (49.1%) | 30 (50.8%) |
| 45 to 54 Years | 0 (0.0%) | 20 (100.0%) |
| 55 to 64 Years | 0 (0.0%) | 0 (0.0%) |
| 65 to 74 Years | 0 (0.0%) | 0 (0.0%) |
| 75 Years and older | 0 (0.0%) | 0 (0.0%) |
| Total | 113 (29.9%) | 265 (70.1%) |
Health Insurance Coverage by Citizenship Status in Wounded Knee
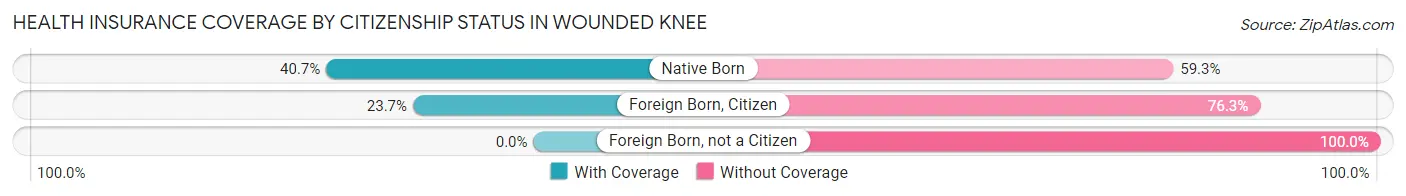
| Citizenship Status | With Coverage | Without Coverage |
| Native Born | 33 (40.7%) | 48 (59.3%) |
| Foreign Born, Citizen | 18 (23.7%) | 58 (76.3%) |
| Foreign Born, not a Citizen | 0 (0.0%) | 72 (100.0%) |
Health Insurance Coverage by Household Income in Wounded Knee
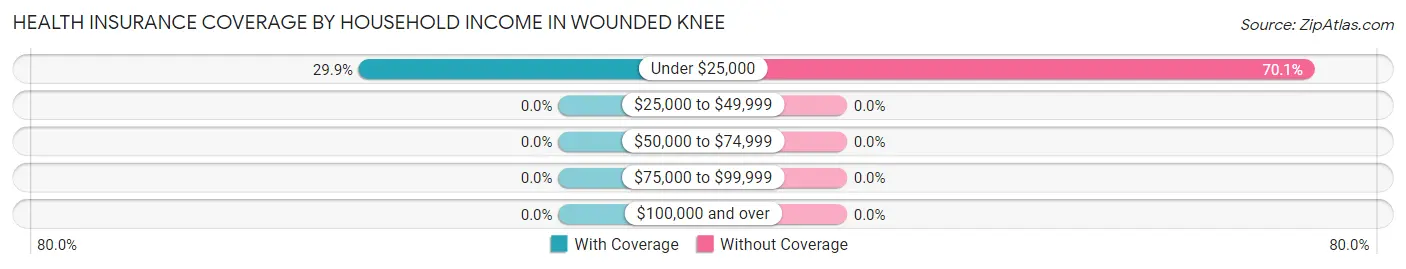
| Household Income | With Coverage | Without Coverage |
| Under $25,000 | 113 (29.9%) | 265 (70.1%) |
| $25,000 to $49,999 | 0 (0.0%) | 0 (0.0%) |
| $50,000 to $74,999 | 0 (0.0%) | 0 (0.0%) |
| $75,000 to $99,999 | 0 (0.0%) | 0 (0.0%) |
| $100,000 and over | 0 (0.0%) | 0 (0.0%) |
Public vs Private Health Insurance Coverage by Age in Wounded Knee
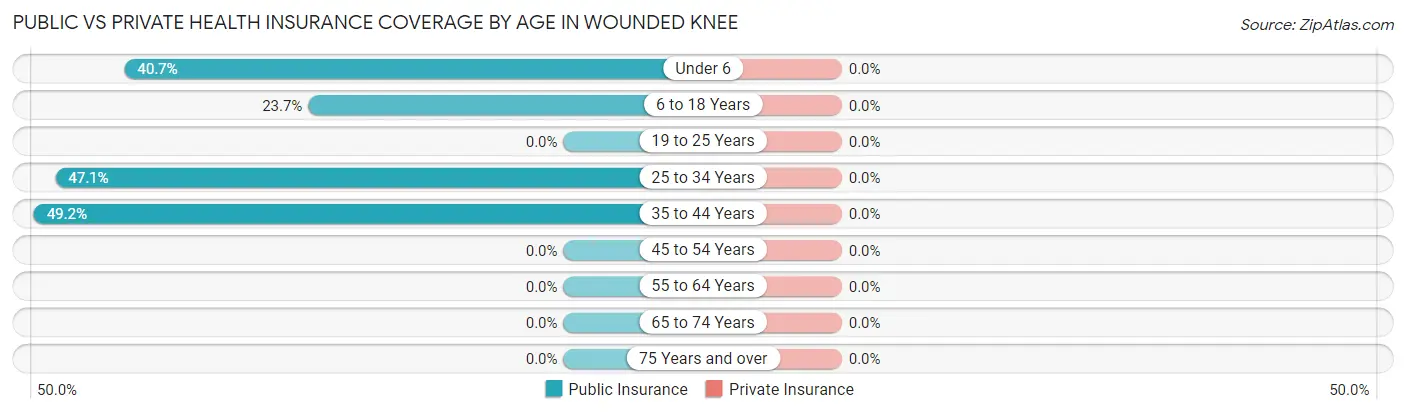
| Age Bracket | Public Insurance | Private Insurance |
| Under 6 | 33 (40.7%) | 0 (0.0%) |
| 6 to 18 Years | 18 (23.7%) | 0 (0.0%) |
| 19 to 25 Years | 0 (0.0%) | 0 (0.0%) |
| 25 to 34 Years | 33 (47.1%) | 0 (0.0%) |
| 35 to 44 Years | 29 (49.1%) | 0 (0.0%) |
| 45 to 54 Years | 0 (0.0%) | 0 (0.0%) |
| 55 to 64 Years | 0 (0.0%) | 0 (0.0%) |
| 65 to 74 Years | 0 (0.0%) | 0 (0.0%) |
| 75 Years and over | 0 (0.0%) | 0 (0.0%) |
| Total | 113 (29.9%) | 0 (0.0%) |
Disability Status by Sex by Age in Wounded Knee
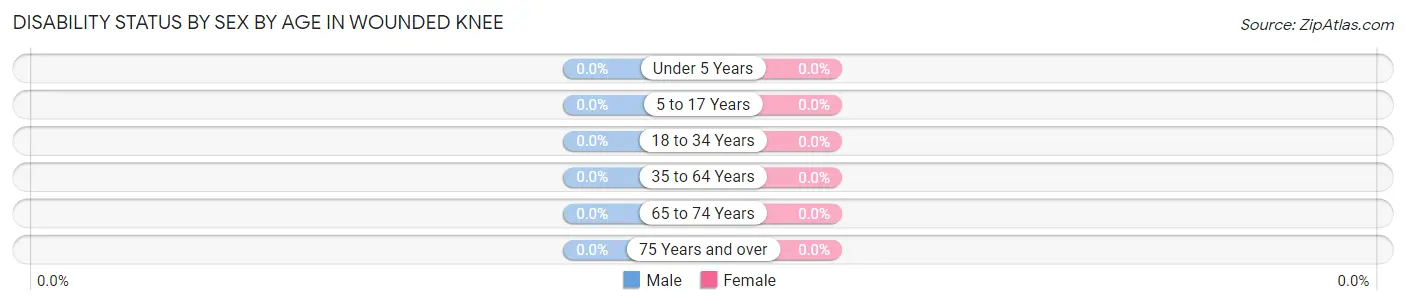
| Age Bracket | Male | Female |
| Under 5 Years | 0 (0.0%) | 0 (0.0%) |
| 5 to 17 Years | 0 (0.0%) | 0 (0.0%) |
| 18 to 34 Years | 0 (0.0%) | 0 (0.0%) |
| 35 to 64 Years | 0 (0.0%) | 0 (0.0%) |
| 65 to 74 Years | 0 (0.0%) | 0 (0.0%) |
| 75 Years and over | 0 (0.0%) | 0 (0.0%) |
Disability Class by Sex by Age in Wounded Knee
Disability Class: Hearing Difficulty
| Age Bracket | Male | Female |
| Under 5 Years | 0 (0.0%) | 0 (0.0%) |
| 5 to 17 Years | 0 (0.0%) | 0 (0.0%) |
| 18 to 34 Years | 0 (0.0%) | 0 (0.0%) |
| 35 to 64 Years | 0 (0.0%) | 0 (0.0%) |
| 65 to 74 Years | 0 (0.0%) | 0 (0.0%) |
| 75 Years and over | 0 (0.0%) | 0 (0.0%) |
Disability Class: Vision Difficulty
| Age Bracket | Male | Female |
| Under 5 Years | 0 (0.0%) | 0 (0.0%) |
| 5 to 17 Years | 0 (0.0%) | 0 (0.0%) |
| 18 to 34 Years | 0 (0.0%) | 0 (0.0%) |
| 35 to 64 Years | 0 (0.0%) | 0 (0.0%) |
| 65 to 74 Years | 0 (0.0%) | 0 (0.0%) |
| 75 Years and over | 0 (0.0%) | 0 (0.0%) |
Disability Class: Cognitive Difficulty
| Age Bracket | Male | Female |
| 5 to 17 Years | 0 (0.0%) | 0 (0.0%) |
| 18 to 34 Years | 0 (0.0%) | 0 (0.0%) |
| 35 to 64 Years | 0 (0.0%) | 0 (0.0%) |
| 65 to 74 Years | 0 (0.0%) | 0 (0.0%) |
| 75 Years and over | 0 (0.0%) | 0 (0.0%) |
Disability Class: Ambulatory Difficulty
| Age Bracket | Male | Female |
| 5 to 17 Years | 0 (0.0%) | 0 (0.0%) |
| 18 to 34 Years | 0 (0.0%) | 0 (0.0%) |
| 35 to 64 Years | 0 (0.0%) | 0 (0.0%) |
| 65 to 74 Years | 0 (0.0%) | 0 (0.0%) |
| 75 Years and over | 0 (0.0%) | 0 (0.0%) |
Disability Class: Self-Care Difficulty
| Age Bracket | Male | Female |
| 5 to 17 Years | 0 (0.0%) | 0 (0.0%) |
| 18 to 34 Years | 0 (0.0%) | 0 (0.0%) |
| 35 to 64 Years | 0 (0.0%) | 0 (0.0%) |
| 65 to 74 Years | 0 (0.0%) | 0 (0.0%) |
| 75 Years and over | 0 (0.0%) | 0 (0.0%) |
Technology Access in Wounded Knee
Computing Device Access in Wounded Knee
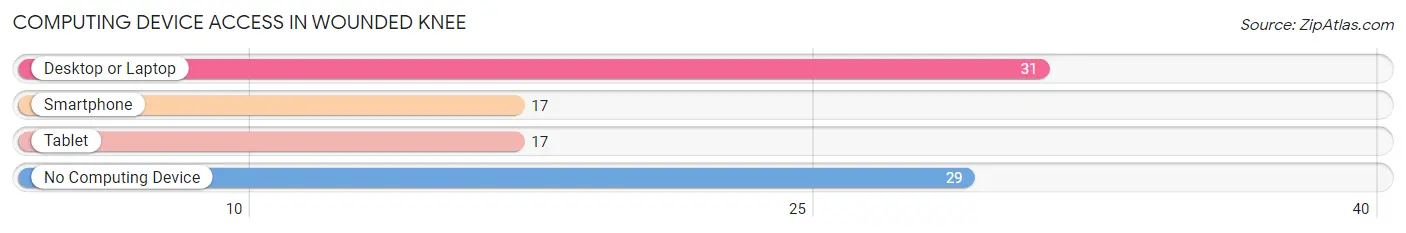
| Device Type | # Households | % Households |
| Desktop or Laptop | 31 | 51.7% |
| Smartphone | 17 | 28.3% |
| Tablet | 17 | 28.3% |
| No Computing Device | 29 | 48.3% |
| Total | 60 | 100.0% |
Internet Access in Wounded Knee
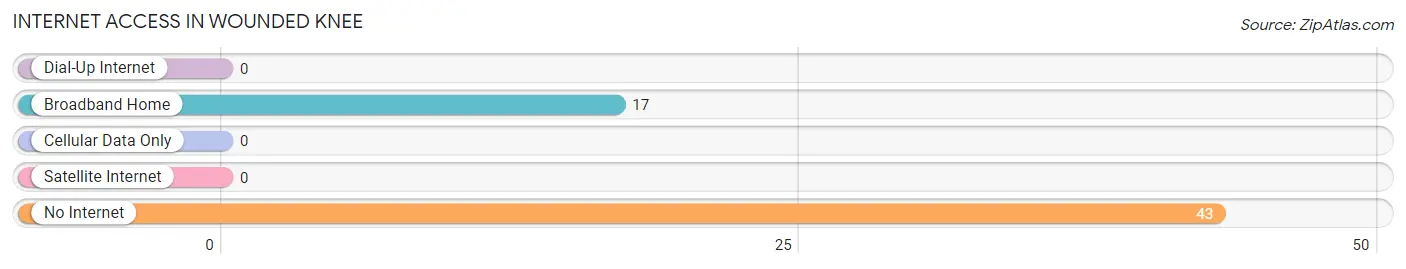
| Internet Type | # Households | % Households |
| Dial-Up Internet | 0 | 0.0% |
| Broadband Home | 17 | 28.3% |
| Cellular Data Only | 0 | 0.0% |
| Satellite Internet | 0 | 0.0% |
| No Internet | 43 | 71.7% |
| Total | 60 | 100.0% |
Wounded Knee Summary
Wounded Knee, South Dakota is a small unincorporated community located in the southwestern corner of the state. It is situated in the Pine Ridge Indian Reservation, which is home to the Oglala Sioux Tribe. The town is best known for the Wounded Knee Massacre of 1890, in which the U.S. Army killed more than 150 Lakota Sioux men, women, and children. The massacre is considered to be one of the most significant events in Native American history.
Geography
Wounded Knee is located in the Pine Ridge Indian Reservation in southwestern South Dakota. The town is situated in the Badlands region of the state, which is characterized by its rugged terrain and sparse vegetation. The town is located approximately 40 miles south of Rapid City, the largest city in the region. The nearest major highway is Interstate 90, which runs through the reservation.
The town of Wounded Knee is situated on the banks of Wounded Knee Creek, which is a tributary of the White River. The creek is named after the massacre that occurred in the area in 1890. The town is surrounded by rolling hills and grasslands, and is home to a variety of wildlife, including bison, elk, and antelope.
History
The area around Wounded Knee has been inhabited by Native Americans for centuries. The Oglala Sioux Tribe, which is the largest tribe in the Pine Ridge Indian Reservation, has lived in the area since the late 1700s. The town of Wounded Knee was established in the late 1800s, and was named after the Wounded Knee Massacre of 1890.
The Wounded Knee Massacre occurred on December 29, 1890, when the U.S. Army attempted to disarm a group of Lakota Sioux men, women, and children. During the confrontation, the army opened fire, killing more than 150 people. The massacre is considered to be one of the most significant events in Native American history.
In 1973, the town of Wounded Knee was the site of a 71-day standoff between the Oglala Sioux Tribe and the U.S. government. The standoff began when members of the American Indian Movement (AIM) occupied the town in protest of the U.S. government’s treatment of Native Americans. The standoff ended when the U.S. government agreed to negotiate with the Oglala Sioux Tribe.
Economy
The economy of Wounded Knee is largely based on tourism. The town is home to several tourist attractions, including the Wounded Knee Museum, which is dedicated to the history of the massacre. The museum is a popular destination for visitors from around the world.
The town is also home to several small businesses, including a grocery store, a gas station, and a few restaurants. The town is also home to a casino, which is owned and operated by the Oglala Sioux Tribe.
Demographics
As of the 2010 census, the population of Wounded Knee was estimated to be around 300 people. The majority of the population is Native American, with the Oglala Sioux Tribe making up the majority of the population. The town also has a small population of non-Native Americans.
The median household income in Wounded Knee is around $20,000, which is significantly lower than the national average. The poverty rate in the town is also higher than the national average, with nearly half of the population living below the poverty line.
Conclusion
Wounded Knee, South Dakota is a small unincorporated community located in the Pine Ridge Indian Reservation. The town is best known for the Wounded Knee Massacre of 1890, which is considered to be one of the most significant events in Native American history. The town’s economy is largely based on tourism, and the majority of the population is Native American. The median household income in Wounded Knee is significantly lower than the national average, and the poverty rate is higher than the national average.
Common Questions
What is Per Capita Income in Wounded Knee?
Per Capita income in Wounded Knee is $882.
What is the Median Family Income in Wounded Knee?
Median Family Income in Wounded Knee is $2,499.
What is the Median Household income in Wounded Knee?
Median Household Income in Wounded Knee is $2,499.
What is Inequality or Gini Index in Wounded Knee?
Inequality or Gini Index in Wounded Knee is 0.46.
What is the Total Population of Wounded Knee?
Total Population of Wounded Knee is 378.
What is the Total Male Population of Wounded Knee?
Total Male Population of Wounded Knee is 295.
What is the Total Female Population of Wounded Knee?
Total Female Population of Wounded Knee is 83.
What is the Ratio of Males per 100 Females in Wounded Knee?
There are 355.42 Males per 100 Females in Wounded Knee.
What is the Ratio of Females per 100 Males in Wounded Knee?
There are 28.14 Females per 100 Males in Wounded Knee.
What is the Median Population Age in Wounded Knee?
Median Population Age in Wounded Knee is 22.3 Years.
What is the Average Family Size in Wounded Knee
Average Family Size in Wounded Knee is 5.8 People.
What is the Average Household Size in Wounded Knee
Average Household Size in Wounded Knee is 6.3 People.
How Large is the Labor Force in Wounded Knee?
There are 47 People in the Labor Forcein in Wounded Knee.
What is the Percentage of People in the Labor Force in Wounded Knee?
21.3% of People are in the Labor Force in Wounded Knee.
What is the Unemployment Rate in Wounded Knee?
Unemployment Rate in Wounded Knee is 100.0%.