Trail, MN Map & Demographics
Trail Map
Trail Overview
$19,862
PER CAPITA INCOME
0.34
INEQUALITY / GINI INDEX
47
TOTAL POPULATION
30
MALE POPULATION
17
FEMALE POPULATION
176.47
MALES / 100 FEMALES
56.67
FEMALES / 100 MALES
39.3
MEDIAN AGE
2.6
AVG FAMILY SIZE
2.5
AVG HOUSEHOLD SIZE
12
LABOR FORCE [ PEOPLE ]
34.3%
PERCENT IN LABOR FORCE
Trail Zip Codes
Trail Area Codes
Income in Trail
Income Overview in Trail
| Characteristic | Number | Measure |
| Per Capita Income | 47 | $19,862 |
| Median Family Income | 13 | $0 |
| Mean Family Income | 13 | $52,177 |
| Median Household Income | 19 | $0 |
| Mean Household Income | 19 | $49,126 |
| Income Deficit | 13 | $0 |
| Wage / Income Gap (%) | 47 | 0.00% |
| Wage / Income Gap ($) | 47 | 100.00¢ per $1 |
| Gini / Inequality Index | 47 | 0.34 |
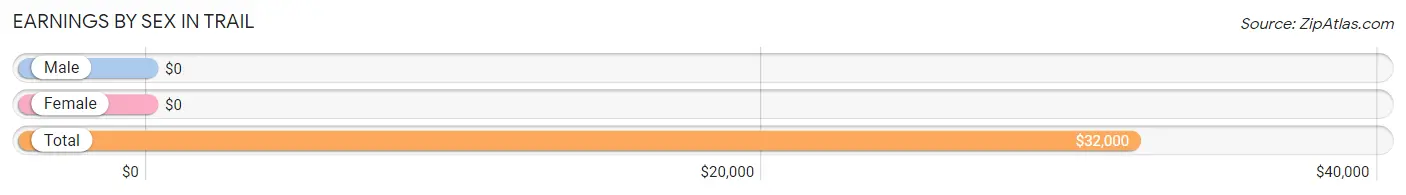
Earnings by Sex in Trail
| Sex | Number | Average Earnings |
| Male | 10 (83.3%) | $0 |
| Female | 2 (16.7%) | $0 |
| Total | 12 (100.0%) | $32,000 |
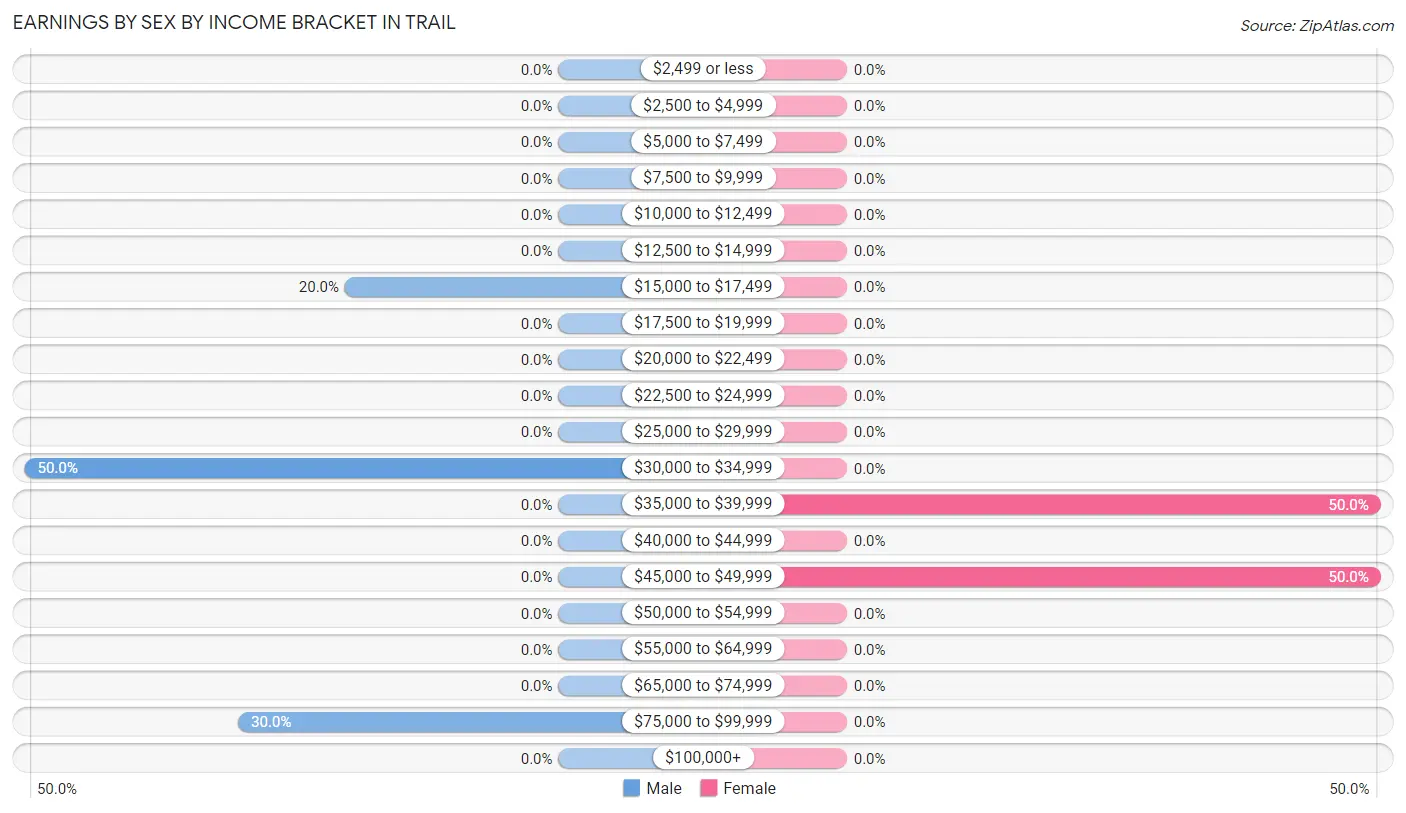
Earnings by Sex by Income Bracket in Trail
The most common earnings brackets in Trail are $30,000 to $34,999 for men (5 | 50.0%) and $35,000 to $39,999 for women (1 | 50.0%).
| Income | Male | Female |
| $2,499 or less | 0 (0.0%) | 0 (0.0%) |
| $2,500 to $4,999 | 0 (0.0%) | 0 (0.0%) |
| $5,000 to $7,499 | 0 (0.0%) | 0 (0.0%) |
| $7,500 to $9,999 | 0 (0.0%) | 0 (0.0%) |
| $10,000 to $12,499 | 0 (0.0%) | 0 (0.0%) |
| $12,500 to $14,999 | 0 (0.0%) | 0 (0.0%) |
| $15,000 to $17,499 | 2 (20.0%) | 0 (0.0%) |
| $17,500 to $19,999 | 0 (0.0%) | 0 (0.0%) |
| $20,000 to $22,499 | 0 (0.0%) | 0 (0.0%) |
| $22,500 to $24,999 | 0 (0.0%) | 0 (0.0%) |
| $25,000 to $29,999 | 0 (0.0%) | 0 (0.0%) |
| $30,000 to $34,999 | 5 (50.0%) | 0 (0.0%) |
| $35,000 to $39,999 | 0 (0.0%) | 1 (50.0%) |
| $40,000 to $44,999 | 0 (0.0%) | 0 (0.0%) |
| $45,000 to $49,999 | 0 (0.0%) | 1 (50.0%) |
| $50,000 to $54,999 | 0 (0.0%) | 0 (0.0%) |
| $55,000 to $64,999 | 0 (0.0%) | 0 (0.0%) |
| $65,000 to $74,999 | 0 (0.0%) | 0 (0.0%) |
| $75,000 to $99,999 | 3 (30.0%) | 0 (0.0%) |
| $100,000+ | 0 (0.0%) | 0 (0.0%) |
| Total | 10 (100.0%) | 2 (100.0%) |
Earnings by Sex by Educational Attainment in Trail
| Educational Attainment | Male Income | Female Income |
| Less than High School | - | - |
| High School Diploma | - | - |
| College or Associate's Degree | - | - |
| Bachelor's Degree | - | - |
| Graduate Degree | - | - |
| Total | - | - |
Family Income in Trail
Family Income Brackets in Trail
According to the Trail family income data, there are 7 families falling into the $25,000 to $34,999 income range, which is the most common income bracket and makes up 53.8% of all families.
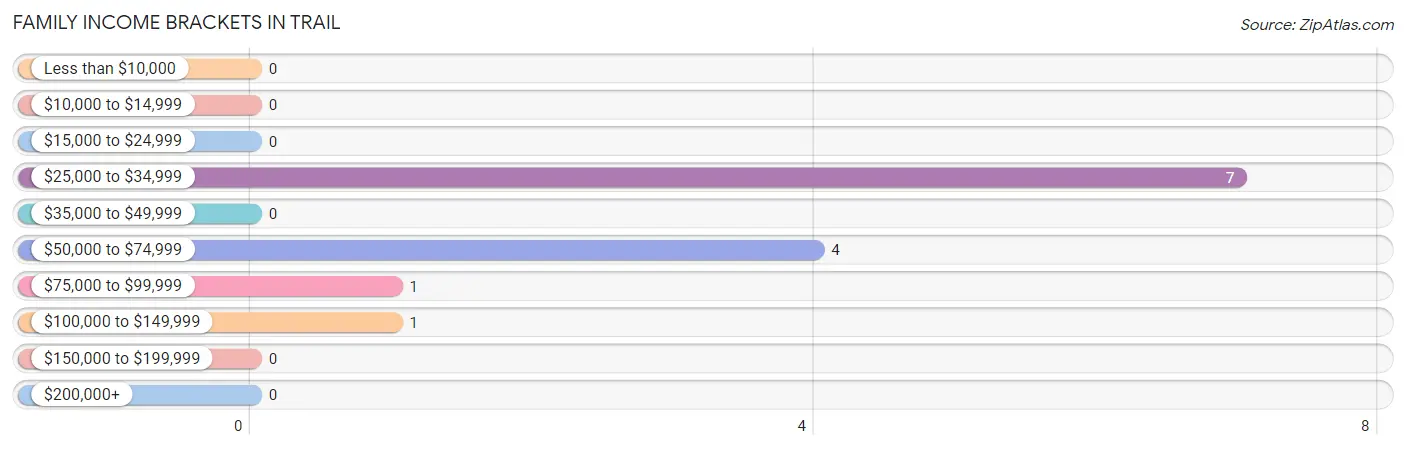
| Income Bracket | # Families | % Families |
| Less than $10,000 | 0 | 0.0% |
| $10,000 to $14,999 | 0 | 0.0% |
| $15,000 to $24,999 | 0 | 0.0% |
| $25,000 to $34,999 | 7 | 53.8% |
| $35,000 to $49,999 | 0 | 0.0% |
| $50,000 to $74,999 | 4 | 30.8% |
| $75,000 to $99,999 | 1 | 7.7% |
| $100,000 to $149,999 | 1 | 7.7% |
| $150,000 to $199,999 | 0 | 0.0% |
| $200,000+ | 0 | 0.0% |
Family Income by Famaliy Size in Trail
2-person families (7 | 53.8%) account for the highest median family income in Trail with $60,938 per family, while 2-person families (7 | 53.8%) have the highest median income of $30,469 per family member.
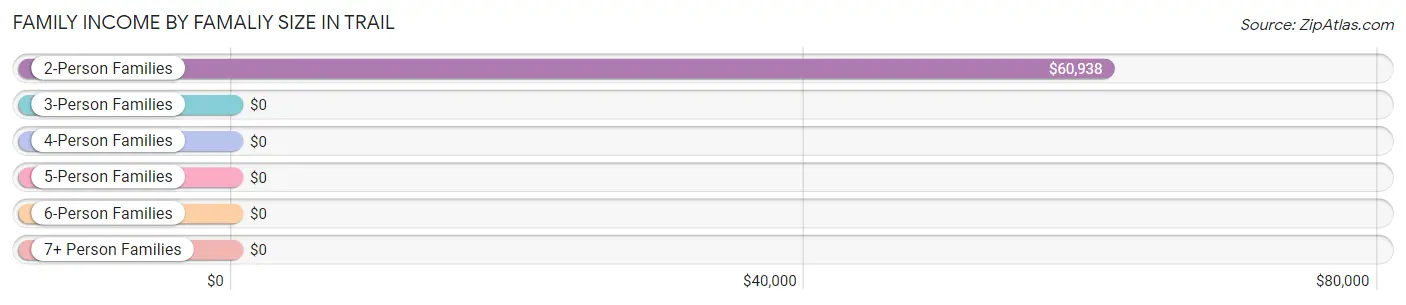
| Income Bracket | # Families | Median Income |
| 2-Person Families | 7 (53.8%) | $60,938 |
| 3-Person Families | 6 (46.2%) | $0 |
| 4-Person Families | 0 (0.0%) | $0 |
| 5-Person Families | 0 (0.0%) | $0 |
| 6-Person Families | 0 (0.0%) | $0 |
| 7+ Person Families | 0 (0.0%) | $0 |
| Total | 13 (100.0%) | $0 |
Family Income by Number of Earners in Trail
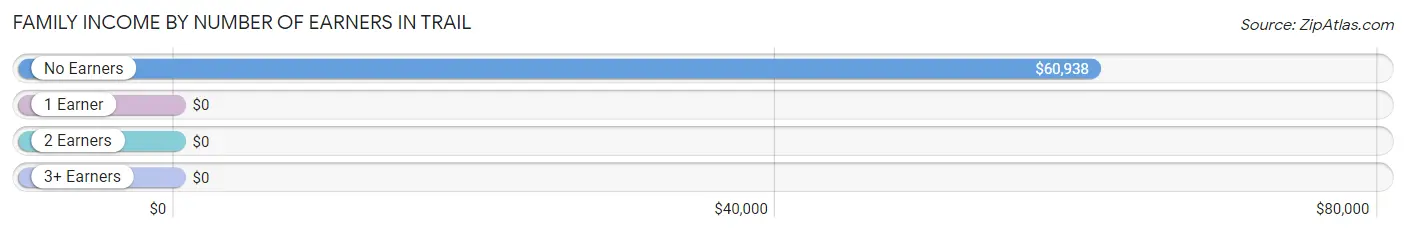
| Number of Earners | # Families | Median Income |
| No Earners | 7 (53.8%) | $60,938 |
| 1 Earner | 5 (38.5%) | $0 |
| 2 Earners | 1 (7.7%) | $0 |
| 3+ Earners | 0 (0.0%) | $0 |
| Total | 13 (100.0%) | $0 |
Household Income in Trail
Household Income Brackets in Trail
With 7 households falling in the category, the $25,000 to $34,999 income range is the most frequent in Trail, accounting for 36.8% of all households.
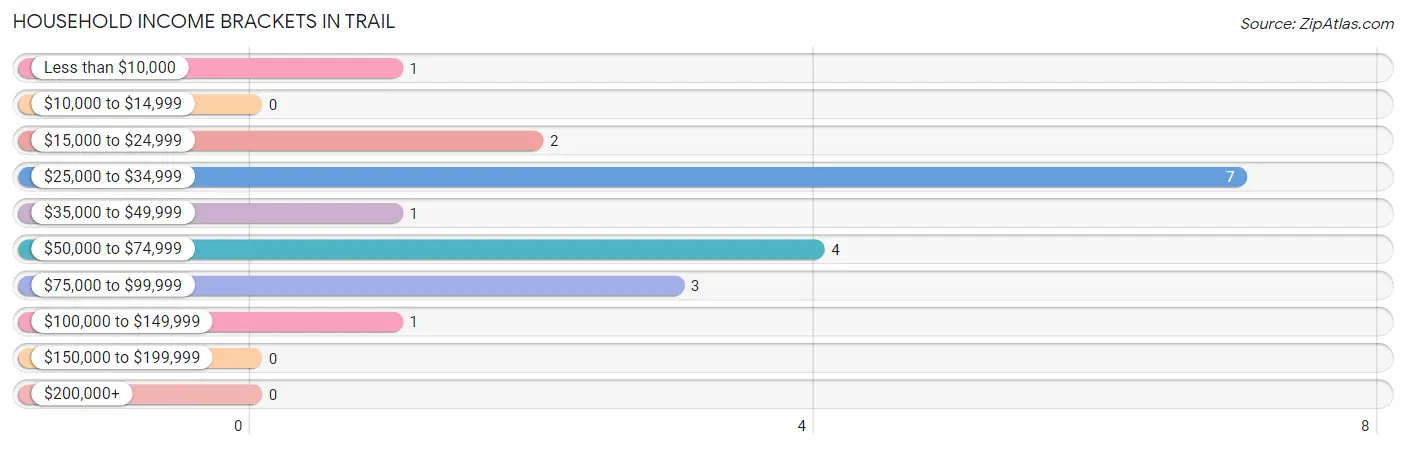
| Income Bracket | # Households | % Households |
| Less than $10,000 | 1 | 5.3% |
| $10,000 to $14,999 | 0 | 0.0% |
| $15,000 to $24,999 | 2 | 10.5% |
| $25,000 to $34,999 | 7 | 36.8% |
| $35,000 to $49,999 | 1 | 5.3% |
| $50,000 to $74,999 | 4 | 21.1% |
| $75,000 to $99,999 | 3 | 15.8% |
| $100,000 to $149,999 | 1 | 5.3% |
| $150,000 to $199,999 | 0 | 0.0% |
| $200,000+ | 0 | 0.0% |
Household Income by Householder Age in Trail
The median household income in Trail is $0, with the highest median household income of $60,938 found in the 45 to 64 years age bracket for the primary householder. A total of 7 households (36.8%) fall into this category.
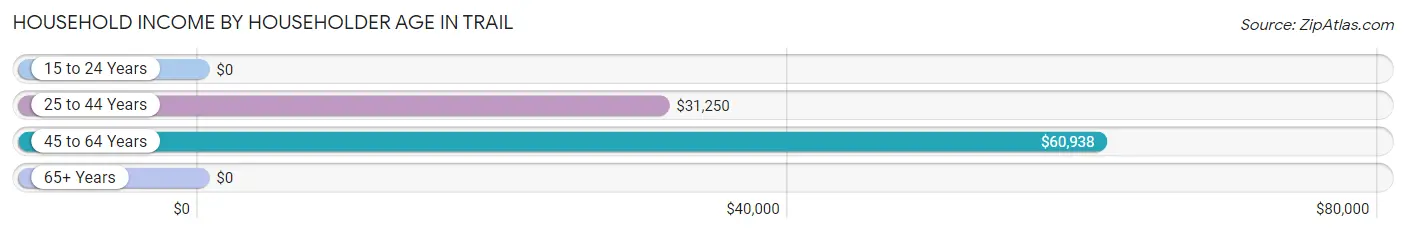
| Income Bracket | # Households | Median Income |
| 15 to 24 Years | 0 (0.0%) | $0 |
| 25 to 44 Years | 9 (47.4%) | $31,250 |
| 45 to 64 Years | 7 (36.8%) | $60,938 |
| 65+ Years | 3 (15.8%) | $0 |
| Total | 19 (100.0%) | $0 |
Poverty in Trail
Income Below Poverty by Sex and Age in Trail
With 3.3% poverty level for males and 41.2% for females among the residents of Trail, 45 to 54 year old males and 18 to 24 year old females are the most vulnerable to poverty, with 1 males (50.0%) and 7 females (100.0%) in their respective age groups living below the poverty level.
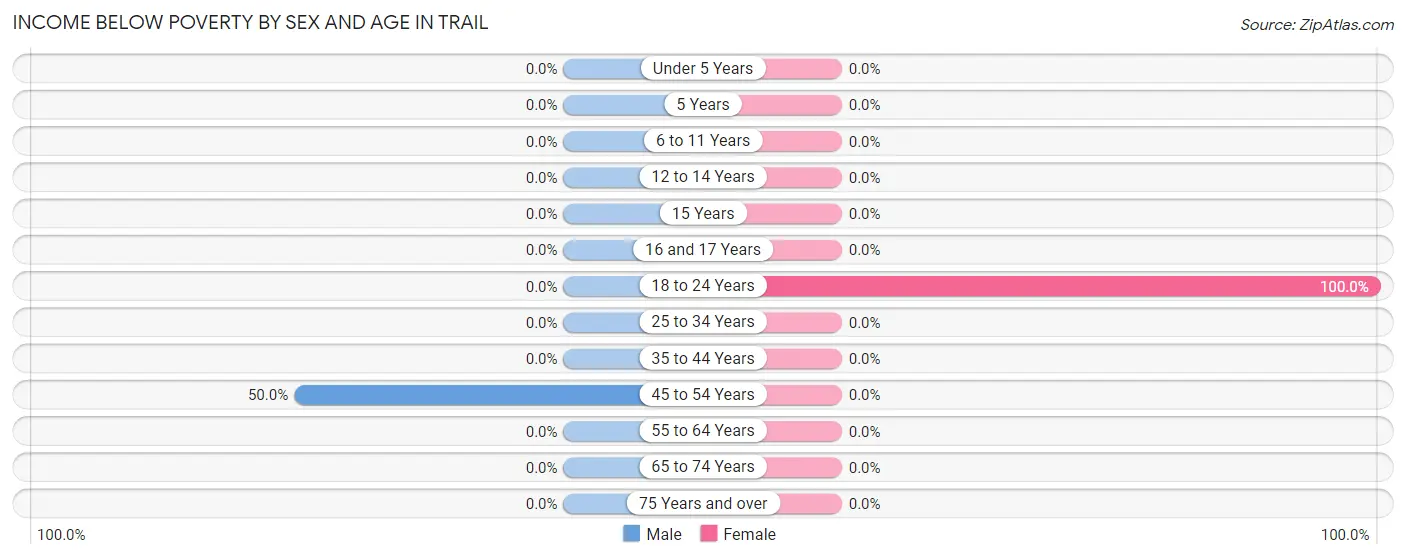
| Age Bracket | Male | Female |
| Under 5 Years | 0 (0.0%) | 0 (0.0%) |
| 5 Years | 0 (0.0%) | 0 (0.0%) |
| 6 to 11 Years | 0 (0.0%) | 0 (0.0%) |
| 12 to 14 Years | 0 (0.0%) | 0 (0.0%) |
| 15 Years | 0 (0.0%) | 0 (0.0%) |
| 16 and 17 Years | 0 (0.0%) | 0 (0.0%) |
| 18 to 24 Years | 0 (0.0%) | 7 (100.0%) |
| 25 to 34 Years | 0 (0.0%) | 0 (0.0%) |
| 35 to 44 Years | 0 (0.0%) | 0 (0.0%) |
| 45 to 54 Years | 1 (50.0%) | 0 (0.0%) |
| 55 to 64 Years | 0 (0.0%) | 0 (0.0%) |
| 65 to 74 Years | 0 (0.0%) | 0 (0.0%) |
| 75 Years and over | 0 (0.0%) | 0 (0.0%) |
| Total | 1 (3.3%) | 7 (41.2%) |
Income Above Poverty by Sex and Age in Trail
According to the poverty statistics in Trail, males aged under 5 years and females aged 16 and 17 years are the age groups that are most secure financially, with 100.0% of males and 100.0% of females in these age groups living above the poverty line.
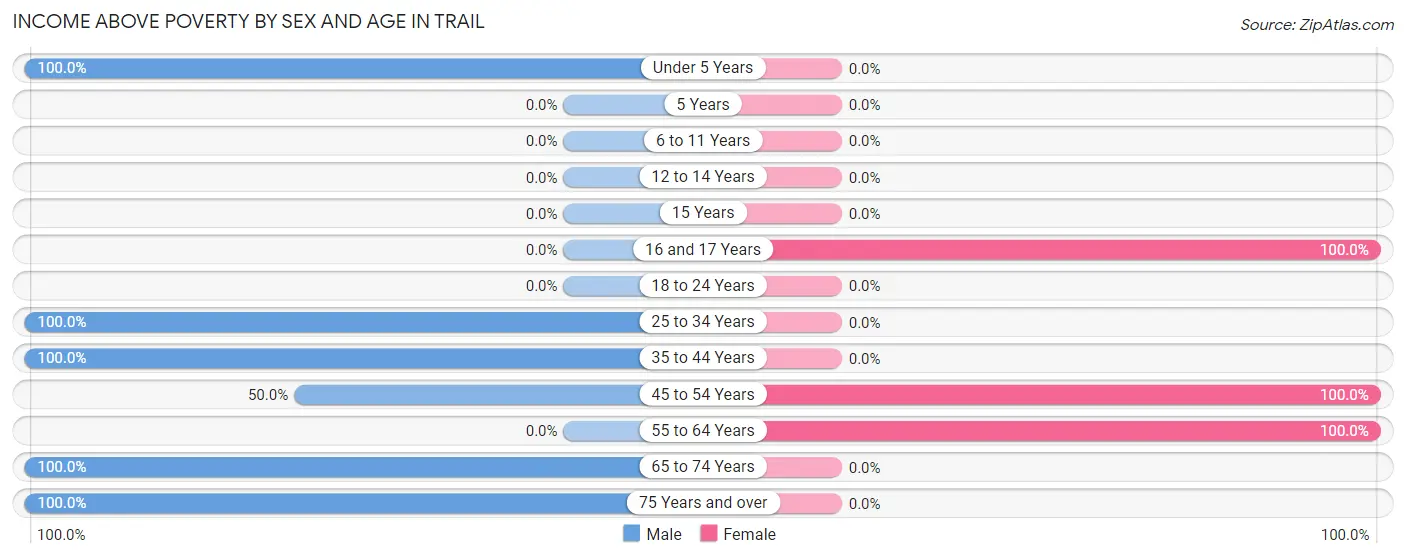
| Age Bracket | Male | Female |
| Under 5 Years | 12 (100.0%) | 0 (0.0%) |
| 5 Years | 0 (0.0%) | 0 (0.0%) |
| 6 to 11 Years | 0 (0.0%) | 0 (0.0%) |
| 12 to 14 Years | 0 (0.0%) | 0 (0.0%) |
| 15 Years | 0 (0.0%) | 0 (0.0%) |
| 16 and 17 Years | 0 (0.0%) | 1 (100.0%) |
| 18 to 24 Years | 0 (0.0%) | 0 (0.0%) |
| 25 to 34 Years | 2 (100.0%) | 0 (0.0%) |
| 35 to 44 Years | 7 (100.0%) | 0 (0.0%) |
| 45 to 54 Years | 1 (50.0%) | 2 (100.0%) |
| 55 to 64 Years | 0 (0.0%) | 7 (100.0%) |
| 65 to 74 Years | 6 (100.0%) | 0 (0.0%) |
| 75 Years and over | 1 (100.0%) | 0 (0.0%) |
| Total | 29 (96.7%) | 10 (58.8%) |
Income Below Poverty Among Married-Couple Families in Trail
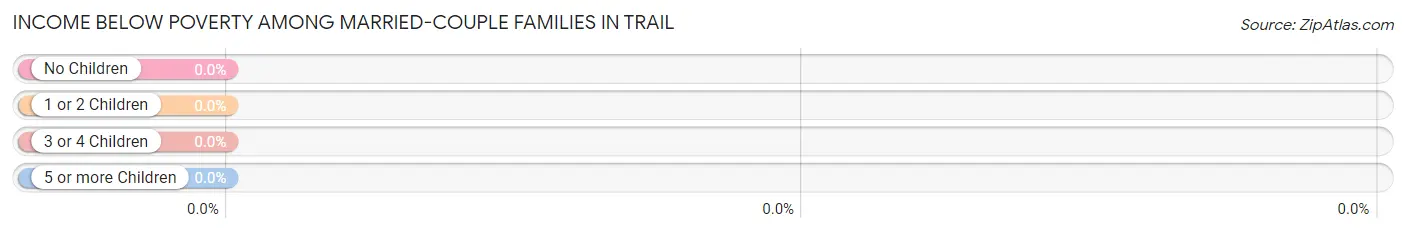
| Children | Above Poverty | Below Poverty |
| No Children | 7 (100.0%) | 0 (0.0%) |
| 1 or 2 Children | 1 (100.0%) | 0 (0.0%) |
| 3 or 4 Children | 0 (0.0%) | 0 (0.0%) |
| 5 or more Children | 0 (0.0%) | 0 (0.0%) |
| Total | 8 (100.0%) | 0 (0.0%) |
Income Below Poverty Among Single-Parent Households in Trail
| Children | Single Father | Single Mother |
| No Children | 0 (0.0%) | 0 (0.0%) |
| 1 or 2 Children | 0 (0.0%) | 0 (0.0%) |
| 3 or 4 Children | 0 (0.0%) | 0 (0.0%) |
| 5 or more Children | 0 (0.0%) | 0 (0.0%) |
| Total | 0 (0.0%) | 0 (0.0%) |
Income Below Poverty Among Married-Couple vs Single-Parent Households in Trail
| Children | Married-Couple Families | Single-Parent Households |
| No Children | 0 (0.0%) | 0 (0.0%) |
| 1 or 2 Children | 0 (0.0%) | 0 (0.0%) |
| 3 or 4 Children | 0 (0.0%) | 0 (0.0%) |
| 5 or more Children | 0 (0.0%) | 0 (0.0%) |
| Total | 0 (0.0%) | 0 (0.0%) |
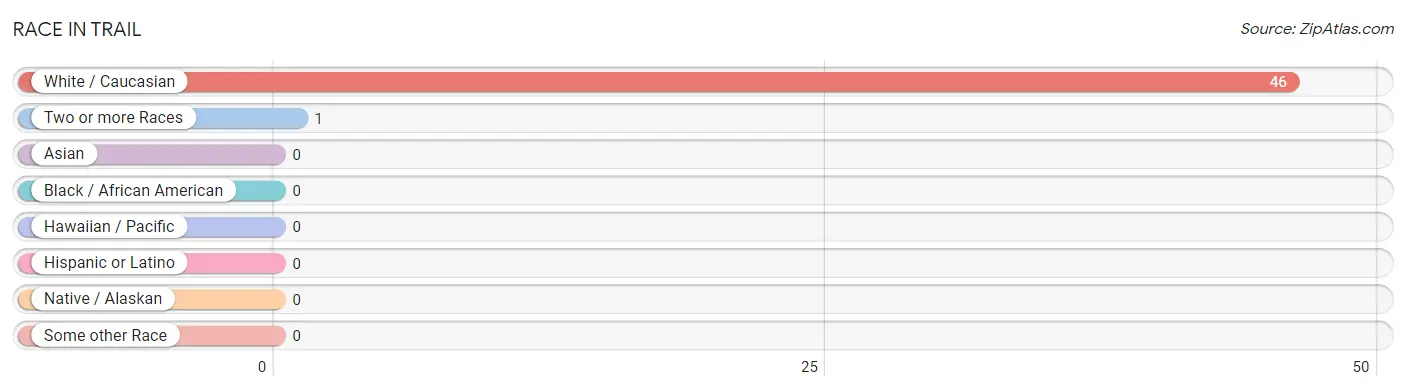
Race in Trail
The most populous races in Trail are White / Caucasian (46 | 97.9%), and Two or more Races (1 | 2.1%).
| Race | # Population | % Population |
| Asian | 0 | 0.0% |
| Black / African American | 0 | 0.0% |
| Hawaiian / Pacific | 0 | 0.0% |
| Hispanic or Latino | 0 | 0.0% |
| Native / Alaskan | 0 | 0.0% |
| White / Caucasian | 46 | 97.9% |
| Two or more Races | 1 | 2.1% |
| Some other Race | 0 | 0.0% |
| Total | 47 | 100.0% |
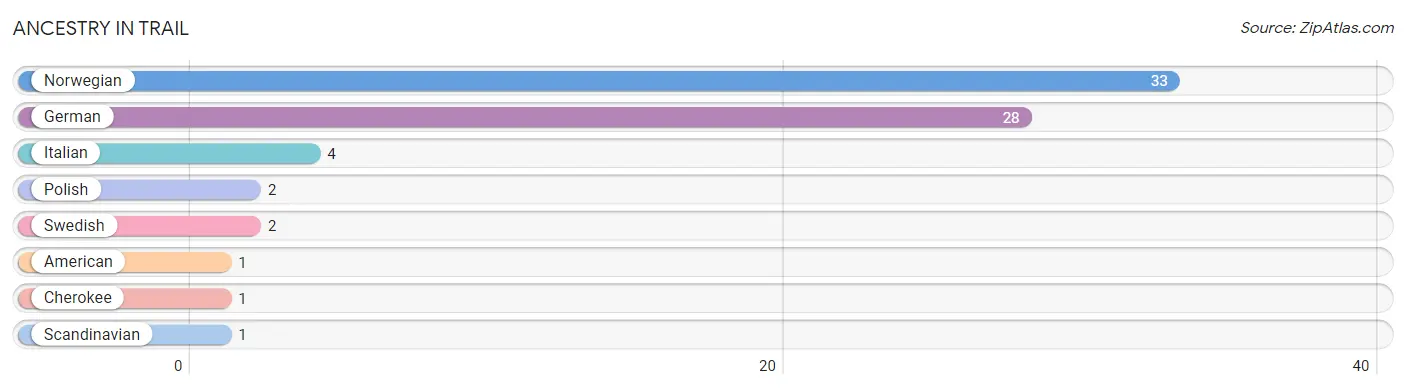
Ancestry in Trail
The most populous ancestries reported in Trail are Norwegian (33 | 70.2%), German (28 | 59.6%), Italian (4 | 8.5%), Polish (2 | 4.3%), and Swedish (2 | 4.3%), together accounting for 146.8% of all Trail residents.
| Ancestry | # Population | % Population |
| American | 1 | 2.1% |
| Cherokee | 1 | 2.1% |
| German | 28 | 59.6% |
| Italian | 4 | 8.5% |
| Norwegian | 33 | 70.2% |
| Polish | 2 | 4.3% |
| Scandinavian | 1 | 2.1% |
| Swedish | 2 | 4.3% | View All 8 Rows |
Immigrants in Trail

| Immigration Origin | # Population | % Population | View All 0 Rows |
Sex and Age in Trail
Sex and Age in Trail
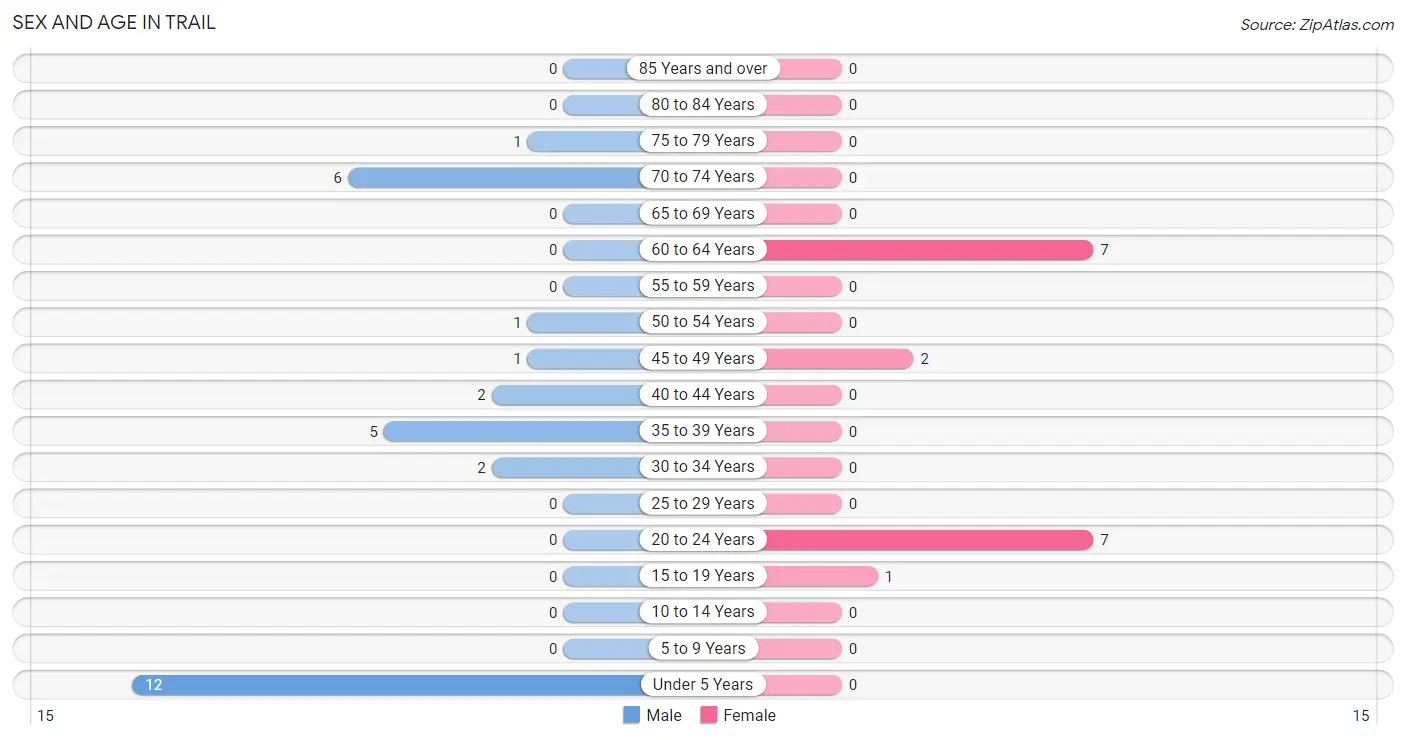
The most populous age groups in Trail are Under 5 Years (12 | 40.0%) for men and 20 to 24 Years (7 | 41.2%) for women.
| Age Bracket | Male | Female |
| Under 5 Years | 12 (40.0%) | 0 (0.0%) |
| 5 to 9 Years | 0 (0.0%) | 0 (0.0%) |
| 10 to 14 Years | 0 (0.0%) | 0 (0.0%) |
| 15 to 19 Years | 0 (0.0%) | 1 (5.9%) |
| 20 to 24 Years | 0 (0.0%) | 7 (41.2%) |
| 25 to 29 Years | 0 (0.0%) | 0 (0.0%) |
| 30 to 34 Years | 2 (6.7%) | 0 (0.0%) |
| 35 to 39 Years | 5 (16.7%) | 0 (0.0%) |
| 40 to 44 Years | 2 (6.7%) | 0 (0.0%) |
| 45 to 49 Years | 1 (3.3%) | 2 (11.8%) |
| 50 to 54 Years | 1 (3.3%) | 0 (0.0%) |
| 55 to 59 Years | 0 (0.0%) | 0 (0.0%) |
| 60 to 64 Years | 0 (0.0%) | 7 (41.2%) |
| 65 to 69 Years | 0 (0.0%) | 0 (0.0%) |
| 70 to 74 Years | 6 (20.0%) | 0 (0.0%) |
| 75 to 79 Years | 1 (3.3%) | 0 (0.0%) |
| 80 to 84 Years | 0 (0.0%) | 0 (0.0%) |
| 85 Years and over | 0 (0.0%) | 0 (0.0%) |
| Total | 30 (100.0%) | 17 (100.0%) |
Families and Households in Trail
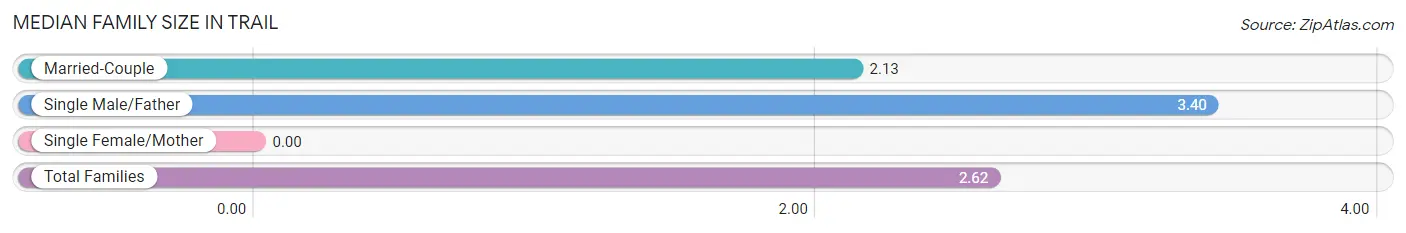
Median Family Size in Trail
| Family Type | # Families | Family Size |
| Married-Couple | 8 (61.5%) | 2.13 |
| Single Male/Father | 5 (38.5%) | 3.40 |
| Single Female/Mother | 0 (0.0%) | - |
| Total Families | 13 (100.0%) | 2.62 |
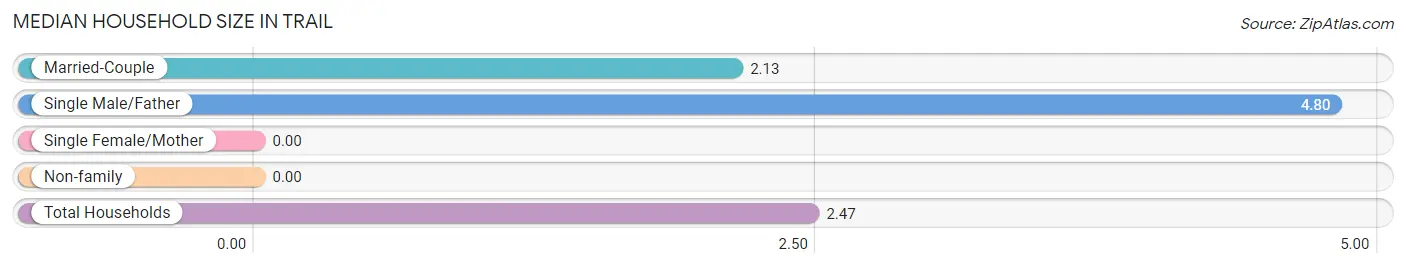
Median Household Size in Trail
| Household Type | # Households | Household Size |
| Married-Couple | 8 (42.1%) | 2.13 |
| Single Male/Father | 5 (26.3%) | 4.80 |
| Single Female/Mother | 0 (0.0%) | - |
| Non-family | 6 (31.6%) | - |
| Total Households | 19 (100.0%) | 2.47 |
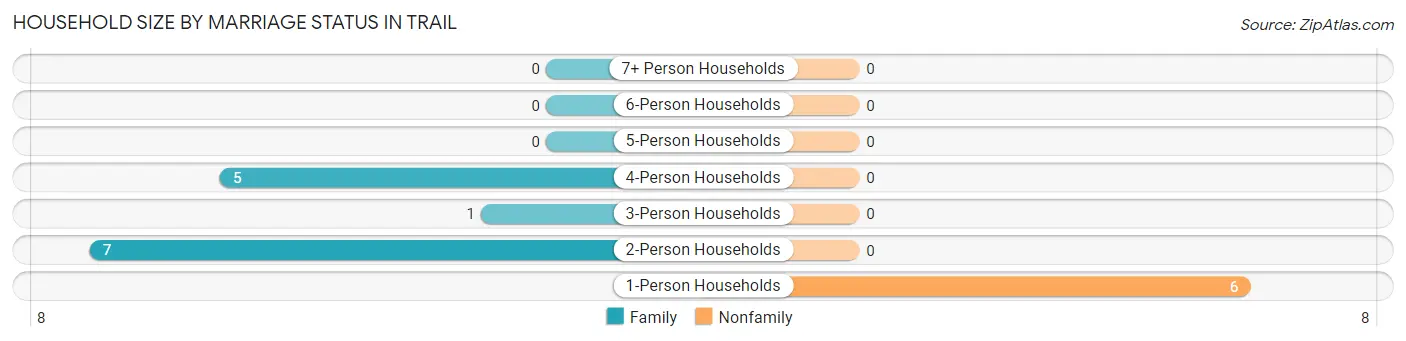
Household Size by Marriage Status in Trail
Out of a total of 19 households in Trail, 13 (68.4%) are family households, while 6 (31.6%) are nonfamily households. The most numerous type of family households are 2-person households, comprising 7, and the most common type of nonfamily households are 1-person households, comprising 6.
| Household Size | Family Households | Nonfamily Households |
| 1-Person Households | - | 6 (31.6%) |
| 2-Person Households | 7 (36.8%) | 0 (0.0%) |
| 3-Person Households | 1 (5.3%) | 0 (0.0%) |
| 4-Person Households | 5 (26.3%) | 0 (0.0%) |
| 5-Person Households | 0 (0.0%) | 0 (0.0%) |
| 6-Person Households | 0 (0.0%) | 0 (0.0%) |
| 7+ Person Households | 0 (0.0%) | 0 (0.0%) |
| Total | 13 (68.4%) | 6 (31.6%) |
Female Fertility in Trail
Fertility by Age in Trail
| Age Bracket | Women with Births | Births / 1,000 Women |
| 15 to 19 years | 0 (0.0%) | 0.0 |
| 20 to 34 years | 0 (0.0%) | 0.0 |
| 35 to 50 years | 0 (0.0%) | 0.0 |
| Total | 0 (0.0%) | 0.0 |
Fertility by Age by Marriage Status in Trail
| Age Bracket | Married | Unmarried |
| 15 to 19 years | 0 (0.0%) | 0 (0.0%) |
| 20 to 34 years | 0 (0.0%) | 0 (0.0%) |
| 35 to 50 years | 0 (0.0%) | 0 (0.0%) |
| Total | 0 (0.0%) | 0 (0.0%) |
Fertility by Education in Trail
| Educational Attainment | Women with Births | Births / 1,000 Women |
| Less than High School | 0 (0.0%) | 0.0 |
| High School Diploma | 0 (0.0%) | 0.0 |
| College or Associate's Degree | 0 (0.0%) | 0.0 |
| Bachelor's Degree | 0 (0.0%) | 0.0 |
| Graduate Degree | 0 (0.0%) | 0.0 |
| Total | 0 (0.0%) | 0.0 |
Fertility by Education by Marriage Status in Trail
| Educational Attainment | Married | Unmarried |
| Less than High School | 0 (0.0%) | 0 (0.0%) |
| High School Diploma | 0 (0.0%) | 0 (0.0%) |
| College or Associate's Degree | 0 (0.0%) | 0 (0.0%) |
| Bachelor's Degree | 0 (0.0%) | 0 (0.0%) |
| Graduate Degree | 0 (0.0%) | 0 (0.0%) |
| Total | 0 (0.0%) | 0 (0.0%) |
Employment Characteristics in Trail
Employment by Class of Employer in Trail
Among the 12 employed individuals in Trail, private company employees (11 | 91.7%), and local government employees (1 | 8.3%) make up the most common classes of employment.
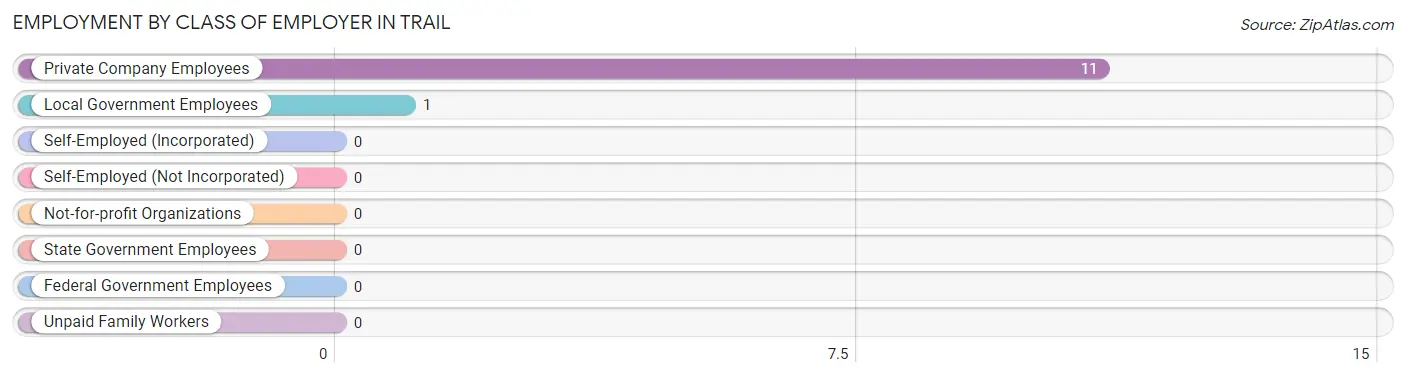
| Employer Class | # Employees | % Employees |
| Private Company Employees | 11 | 91.7% |
| Self-Employed (Incorporated) | 0 | 0.0% |
| Self-Employed (Not Incorporated) | 0 | 0.0% |
| Not-for-profit Organizations | 0 | 0.0% |
| Local Government Employees | 1 | 8.3% |
| State Government Employees | 0 | 0.0% |
| Federal Government Employees | 0 | 0.0% |
| Unpaid Family Workers | 0 | 0.0% |
| Total | 12 | 100.0% |
Employment Status by Age in Trail
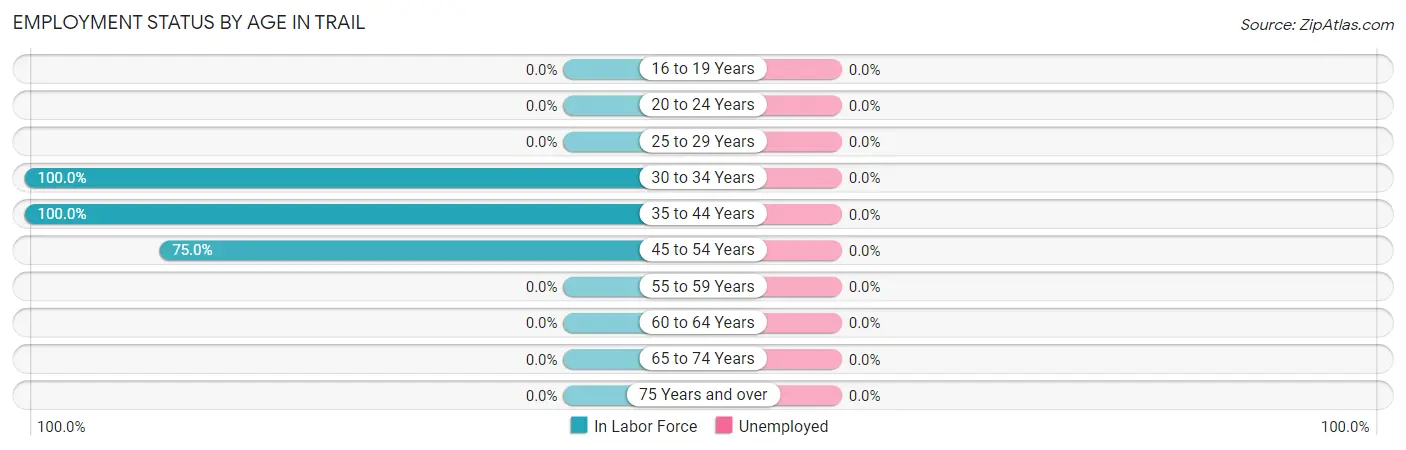
| Age Bracket | In Labor Force | Unemployed |
| 16 to 19 Years | 0 (0.0%) | 0 (0.0%) |
| 20 to 24 Years | 0 (0.0%) | 0 (0.0%) |
| 25 to 29 Years | 0 (0.0%) | 0 (0.0%) |
| 30 to 34 Years | 2 (100.0%) | 0 (0.0%) |
| 35 to 44 Years | 7 (100.0%) | 0 (0.0%) |
| 45 to 54 Years | 3 (75.0%) | 0 (0.0%) |
| 55 to 59 Years | 0 (0.0%) | 0 (0.0%) |
| 60 to 64 Years | 0 (0.0%) | 0 (0.0%) |
| 65 to 74 Years | 0 (0.0%) | 0 (0.0%) |
| 75 Years and over | 0 (0.0%) | 0 (0.0%) |
| Total | 12 (34.3%) | 0 (0.0%) |
Employment Status by Educational Attainment in Trail
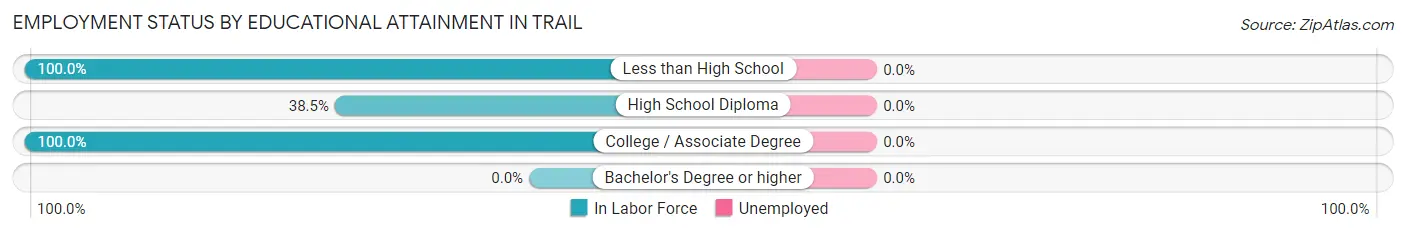
| Educational Attainment | In Labor Force | Unemployed |
| Less than High School | 2 (100.0%) | 0 (0.0%) |
| High School Diploma | 5 (38.5%) | 0 (0.0%) |
| College / Associate Degree | 5 (100.0%) | 0 (0.0%) |
| Bachelor's Degree or higher | 0 (0.0%) | 0 (0.0%) |
| Total | 12 (60.0%) | 0 (0.0%) |
Employment Occupations by Sex in Trail
Management, Business, Science and Arts Occupations
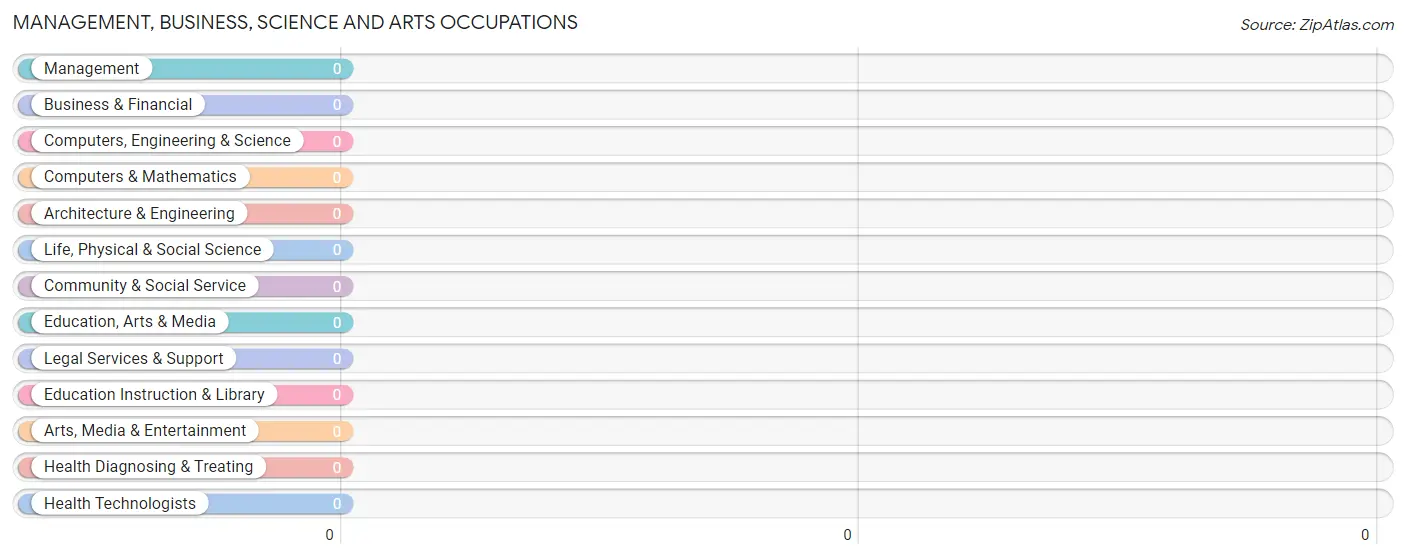
Management, Business, Science and Arts Occupations by Sex
| Occupation | Male | Female |
| Management | 0 (0.0%) | 0 (0.0%) |
| Business & Financial | 0 (0.0%) | 0 (0.0%) |
| Computers, Engineering & Science | 0 (0.0%) | 0 (0.0%) |
| Computers & Mathematics | 0 (0.0%) | 0 (0.0%) |
| Architecture & Engineering | 0 (0.0%) | 0 (0.0%) |
| Life, Physical & Social Science | 0 (0.0%) | 0 (0.0%) |
| Community & Social Service | 0 (0.0%) | 0 (0.0%) |
| Education, Arts & Media | 0 (0.0%) | 0 (0.0%) |
| Legal Services & Support | 0 (0.0%) | 0 (0.0%) |
| Education Instruction & Library | 0 (0.0%) | 0 (0.0%) |
| Arts, Media & Entertainment | 0 (0.0%) | 0 (0.0%) |
| Health Diagnosing & Treating | 0 (0.0%) | 0 (0.0%) |
| Health Technologists | 0 (0.0%) | 0 (0.0%) |
| Total (Category) | 0 (0.0%) | 0 (0.0%) |
| Total (Overall) | 10 (83.3%) | 2 (16.7%) |
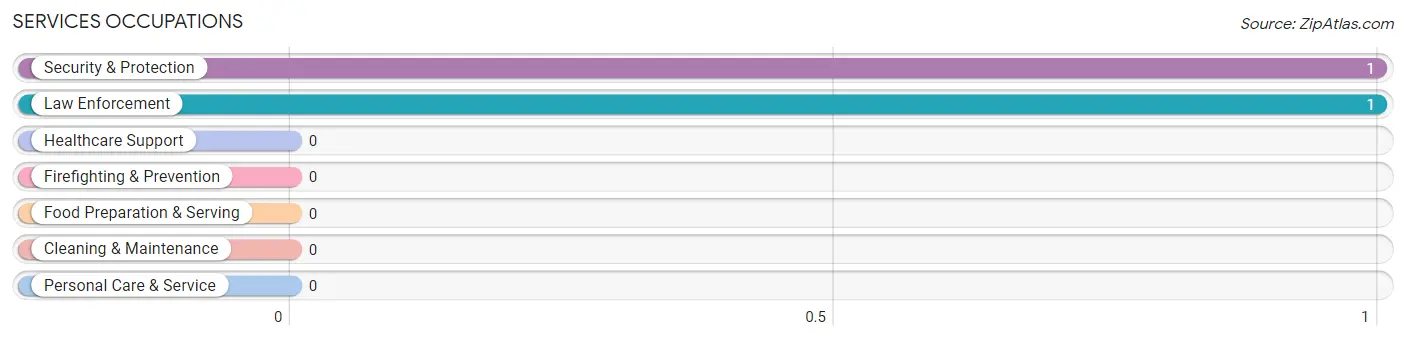
Services Occupations
The most common Services occupations in Trail are Security & Protection (1 | 8.3%), and Law Enforcement (1 | 8.3%).
Services Occupations by Sex
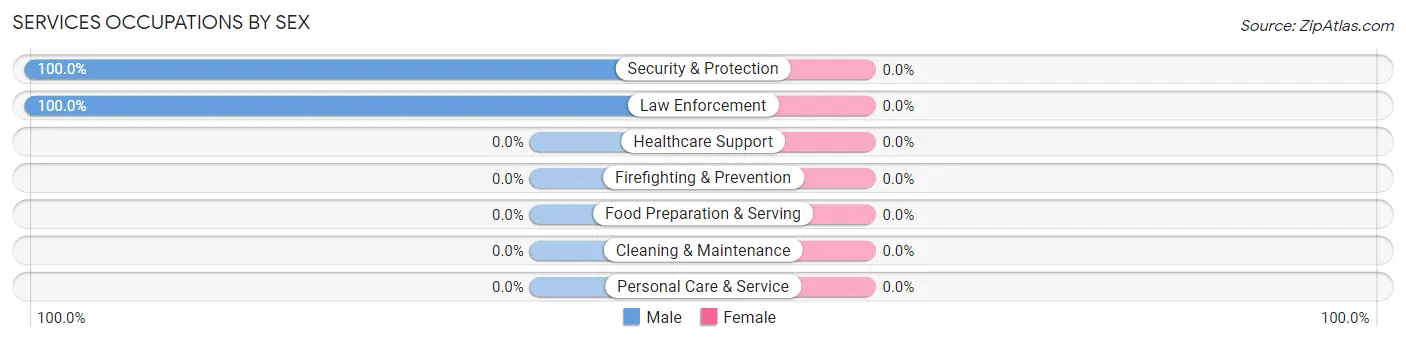
| Occupation | Male | Female |
| Healthcare Support | 0 (0.0%) | 0 (0.0%) |
| Security & Protection | 1 (100.0%) | 0 (0.0%) |
| Firefighting & Prevention | 0 (0.0%) | 0 (0.0%) |
| Law Enforcement | 1 (100.0%) | 0 (0.0%) |
| Food Preparation & Serving | 0 (0.0%) | 0 (0.0%) |
| Cleaning & Maintenance | 0 (0.0%) | 0 (0.0%) |
| Personal Care & Service | 0 (0.0%) | 0 (0.0%) |
| Total (Category) | 1 (100.0%) | 0 (0.0%) |
| Total (Overall) | 10 (83.3%) | 2 (16.7%) |
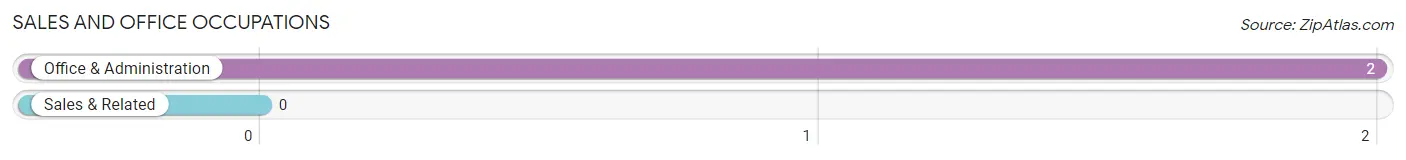
Sales and Office Occupations
The most common Sales and Office occupations in Trail are , and Office & Administration (2 | 16.7%).
Sales and Office Occupations by Sex
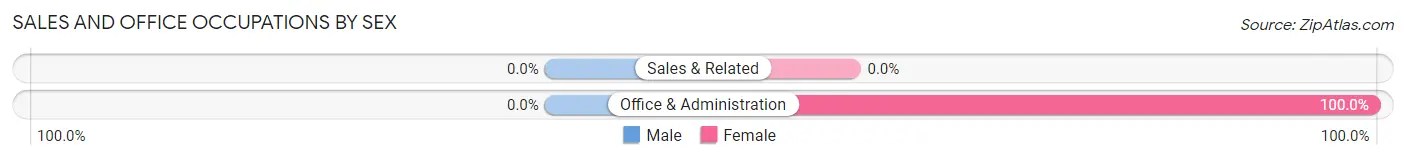
| Occupation | Male | Female |
| Sales & Related | 0 (0.0%) | 0 (0.0%) |
| Office & Administration | 0 (0.0%) | 2 (100.0%) |
| Total (Category) | 0 (0.0%) | 2 (100.0%) |
| Total (Overall) | 10 (83.3%) | 2 (16.7%) |
Natural Resources, Construction and Maintenance Occupations
The most common Natural Resources, Construction and Maintenance occupations in Trail are , and Construction & Extraction (7 | 58.3%).
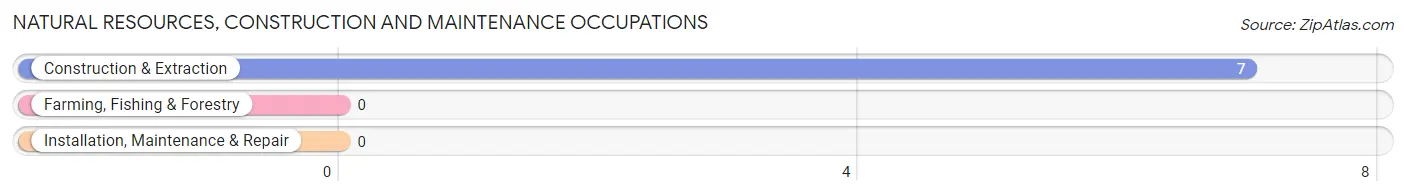
Natural Resources, Construction and Maintenance Occupations by Sex
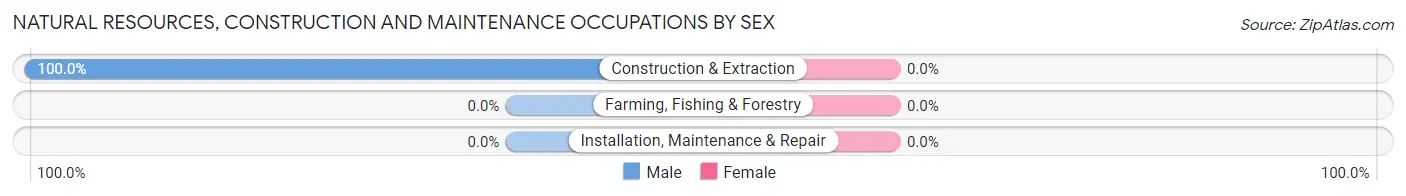
| Occupation | Male | Female |
| Farming, Fishing & Forestry | 0 (0.0%) | 0 (0.0%) |
| Construction & Extraction | 7 (100.0%) | 0 (0.0%) |
| Installation, Maintenance & Repair | 0 (0.0%) | 0 (0.0%) |
| Total (Category) | 7 (100.0%) | 0 (0.0%) |
| Total (Overall) | 10 (83.3%) | 2 (16.7%) |
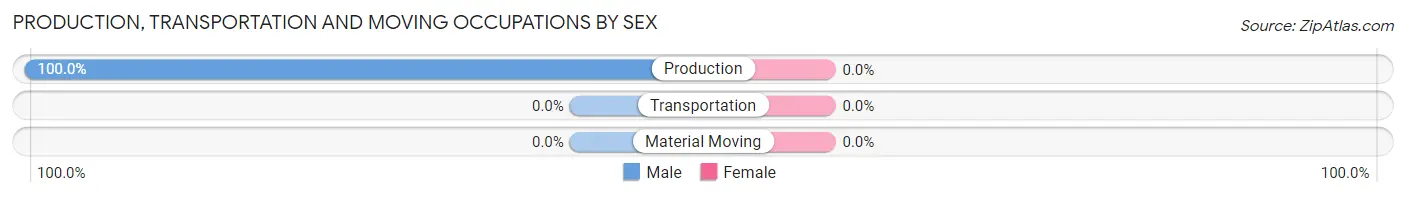
Production, Transportation and Moving Occupations
The most common Production, Transportation and Moving occupations in Trail are , and Production (2 | 16.7%).
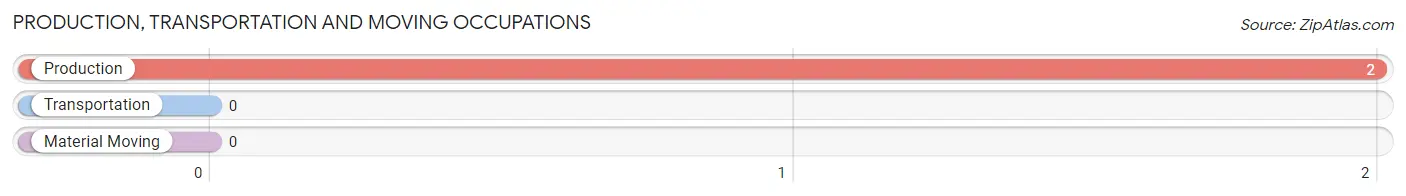
Production, Transportation and Moving Occupations by Sex
| Occupation | Male | Female |
| Production | 2 (100.0%) | 0 (0.0%) |
| Transportation | 0 (0.0%) | 0 (0.0%) |
| Material Moving | 0 (0.0%) | 0 (0.0%) |
| Total (Category) | 2 (100.0%) | 0 (0.0%) |
| Total (Overall) | 10 (83.3%) | 2 (16.7%) |
Employment Industries by Sex in Trail
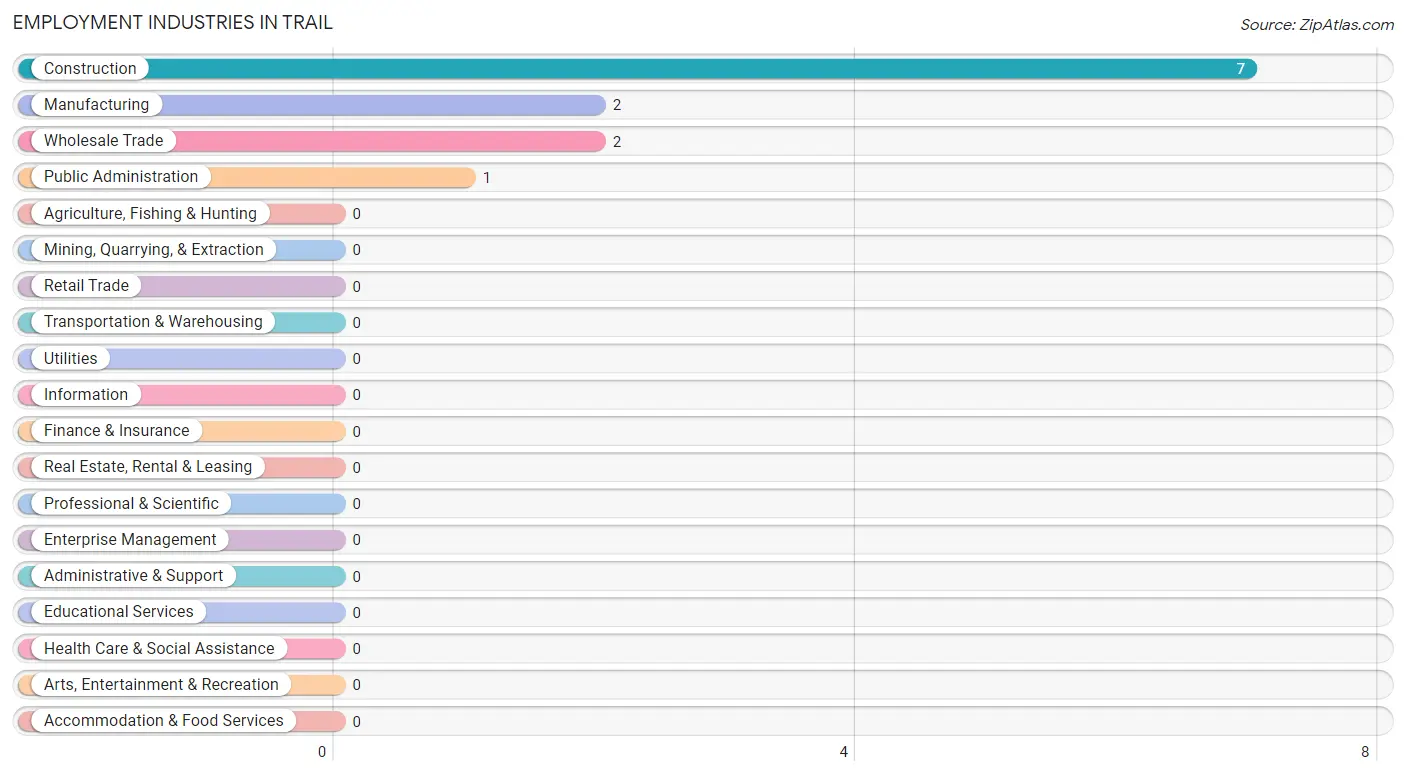
Employment Industries in Trail
The major employment industries in Trail include Construction (7 | 58.3%), Manufacturing (2 | 16.7%), Wholesale Trade (2 | 16.7%), and Public Administration (1 | 8.3%).
Employment Industries by Sex in Trail
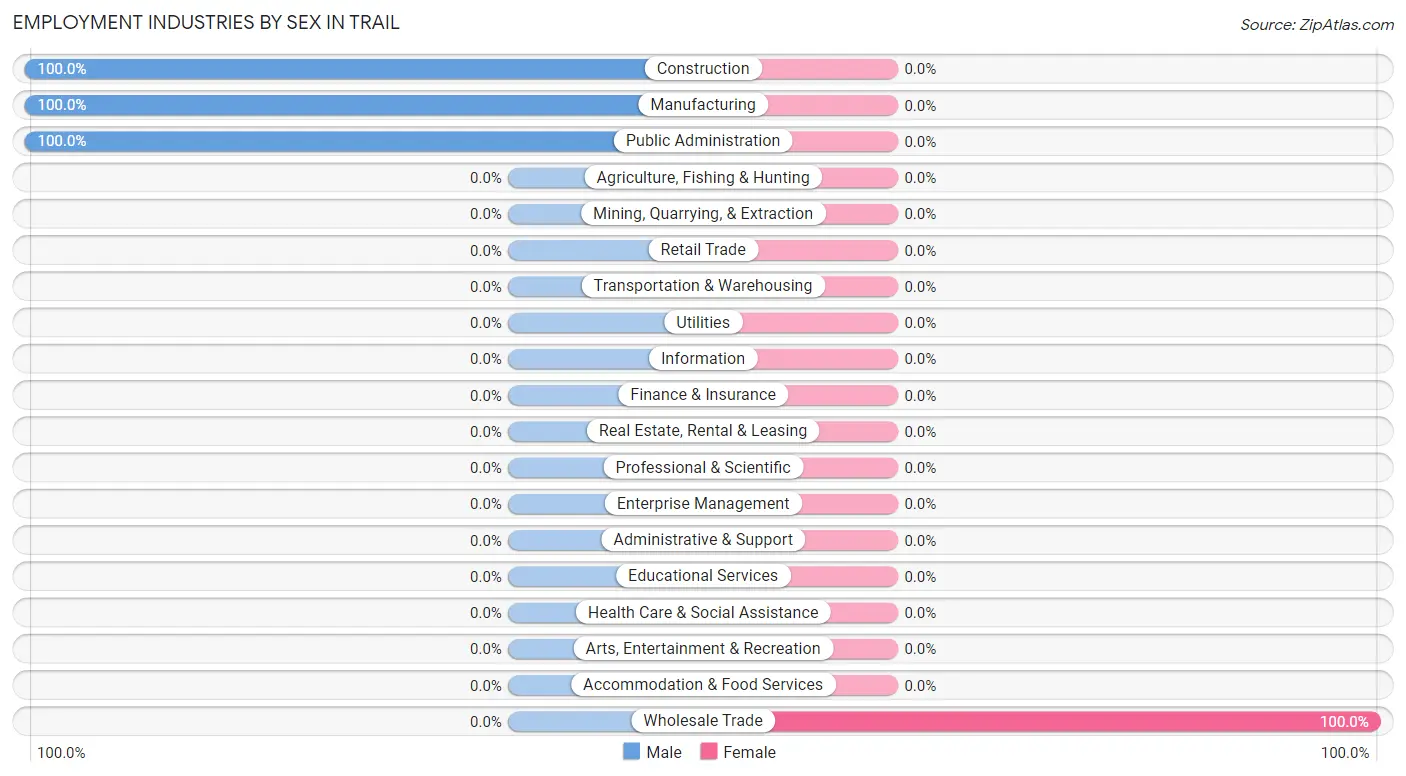
| Industry | Male | Female |
| Agriculture, Fishing & Hunting | 0 (0.0%) | 0 (0.0%) |
| Mining, Quarrying, & Extraction | 0 (0.0%) | 0 (0.0%) |
| Construction | 7 (100.0%) | 0 (0.0%) |
| Manufacturing | 2 (100.0%) | 0 (0.0%) |
| Wholesale Trade | 0 (0.0%) | 2 (100.0%) |
| Retail Trade | 0 (0.0%) | 0 (0.0%) |
| Transportation & Warehousing | 0 (0.0%) | 0 (0.0%) |
| Utilities | 0 (0.0%) | 0 (0.0%) |
| Information | 0 (0.0%) | 0 (0.0%) |
| Finance & Insurance | 0 (0.0%) | 0 (0.0%) |
| Real Estate, Rental & Leasing | 0 (0.0%) | 0 (0.0%) |
| Professional & Scientific | 0 (0.0%) | 0 (0.0%) |
| Enterprise Management | 0 (0.0%) | 0 (0.0%) |
| Administrative & Support | 0 (0.0%) | 0 (0.0%) |
| Educational Services | 0 (0.0%) | 0 (0.0%) |
| Health Care & Social Assistance | 0 (0.0%) | 0 (0.0%) |
| Arts, Entertainment & Recreation | 0 (0.0%) | 0 (0.0%) |
| Accommodation & Food Services | 0 (0.0%) | 0 (0.0%) |
| Public Administration | 1 (100.0%) | 0 (0.0%) |
| Total | 10 (83.3%) | 2 (16.7%) |
Education in Trail
School Enrollment in Trail
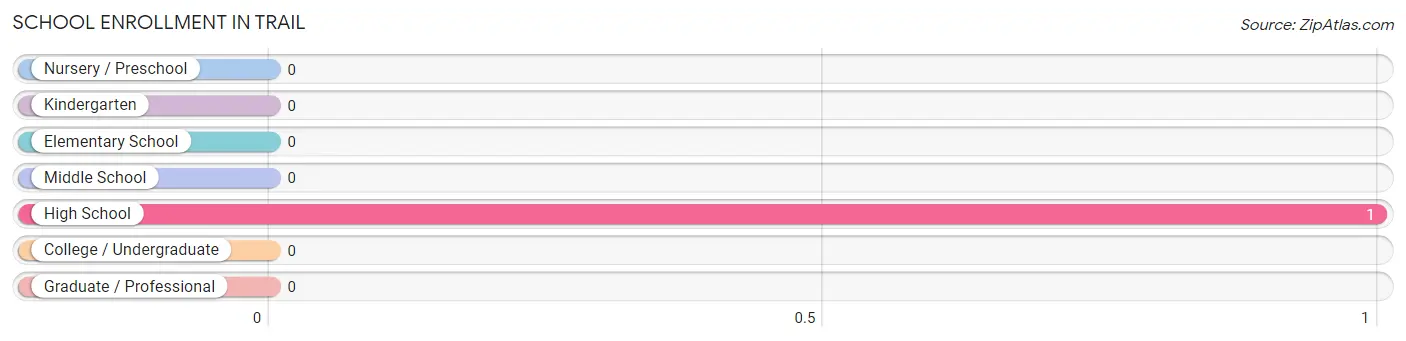
| School Level | # Students | % Students |
| Nursery / Preschool | 0 | 0.0% |
| Kindergarten | 0 | 0.0% |
| Elementary School | 0 | 0.0% |
| Middle School | 0 | 0.0% |
| High School | 1 | 100.0% |
| College / Undergraduate | 0 | 0.0% |
| Graduate / Professional | 0 | 0.0% |
| Total | 1 | 100.0% |
School Enrollment by Age by Funding Source in Trail
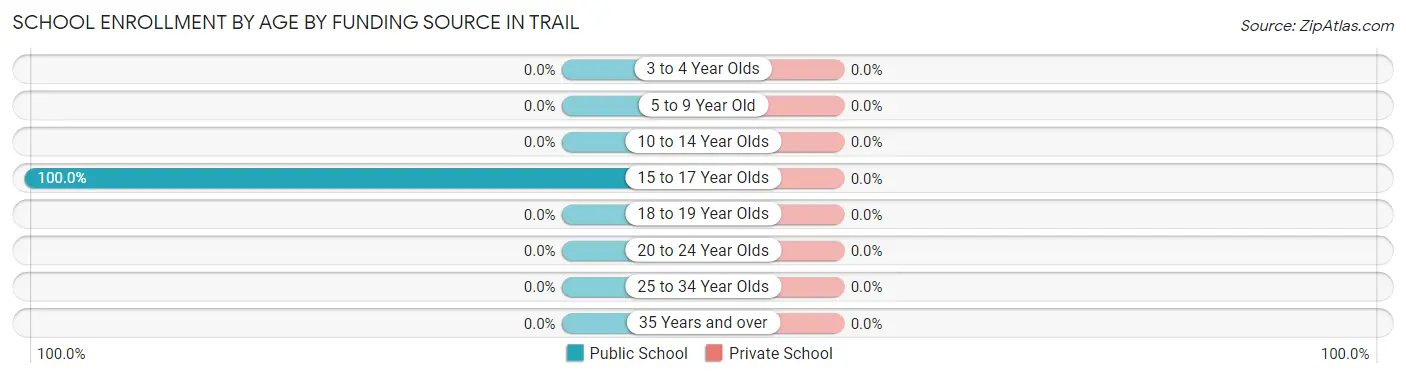
| Age Bracket | Public School | Private School |
| 3 to 4 Year Olds | 0 (0.0%) | 0 (0.0%) |
| 5 to 9 Year Old | 0 (0.0%) | 0 (0.0%) |
| 10 to 14 Year Olds | 0 (0.0%) | 0 (0.0%) |
| 15 to 17 Year Olds | 1 (100.0%) | 0 (0.0%) |
| 18 to 19 Year Olds | 0 (0.0%) | 0 (0.0%) |
| 20 to 24 Year Olds | 0 (0.0%) | 0 (0.0%) |
| 25 to 34 Year Olds | 0 (0.0%) | 0 (0.0%) |
| 35 Years and over | 0 (0.0%) | 0 (0.0%) |
| Total | 1 (100.0%) | 0 (0.0%) |
Educational Attainment by Field of Study in Trail
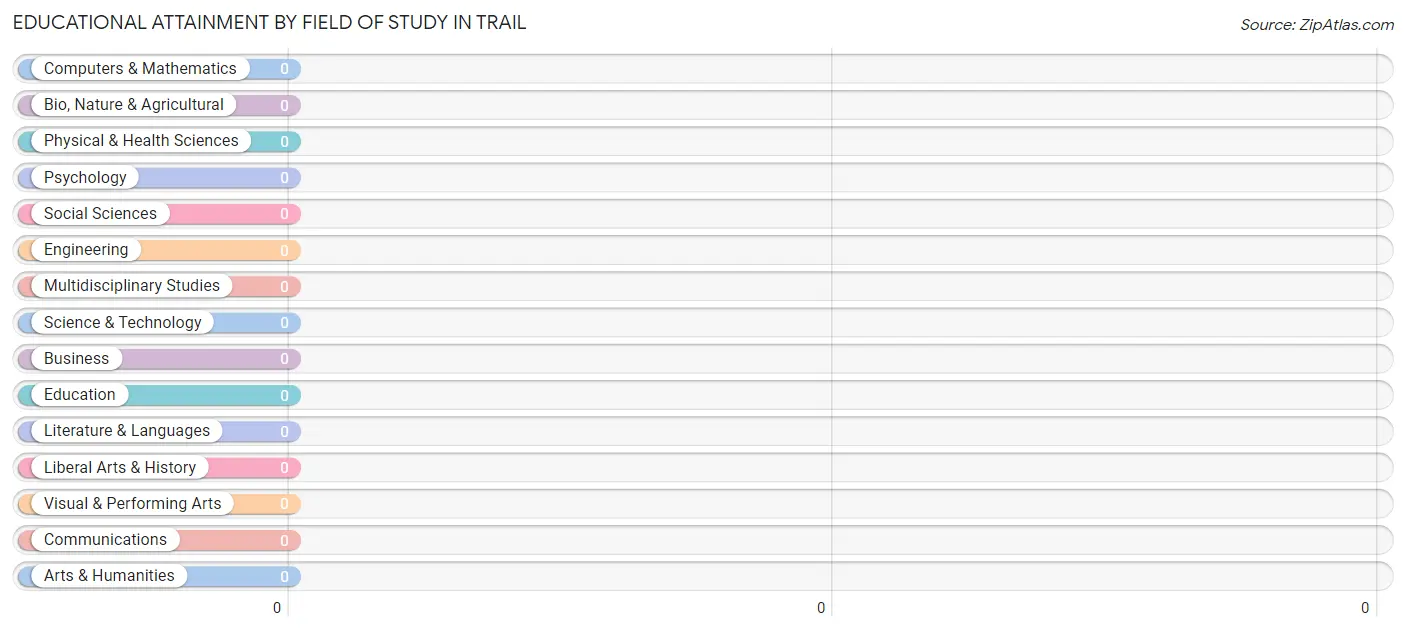
| Field of Study | # Graduates | % Graduates |
| Computers & Mathematics | 0 | 0.0% |
| Bio, Nature & Agricultural | 0 | 0.0% |
| Physical & Health Sciences | 0 | 0.0% |
| Psychology | 0 | 0.0% |
| Social Sciences | 0 | 0.0% |
| Engineering | 0 | 0.0% |
| Multidisciplinary Studies | 0 | 0.0% |
| Science & Technology | 0 | 0.0% |
| Business | 0 | 0.0% |
| Education | 0 | 0.0% |
| Literature & Languages | 0 | 0.0% |
| Liberal Arts & History | 0 | 0.0% |
| Visual & Performing Arts | 0 | 0.0% |
| Communications | 0 | 0.0% |
| Arts & Humanities | 0 | 0.0% |
| Total | 0 | 0.0% |
Transportation & Commute in Trail
Vehicle Availability by Sex in Trail
The most prevalent vehicle ownership categories in Trail are males with 2 vehicles (5, accounting for 50.0%) and females with 2 vehicles (0, making up 250.0%).
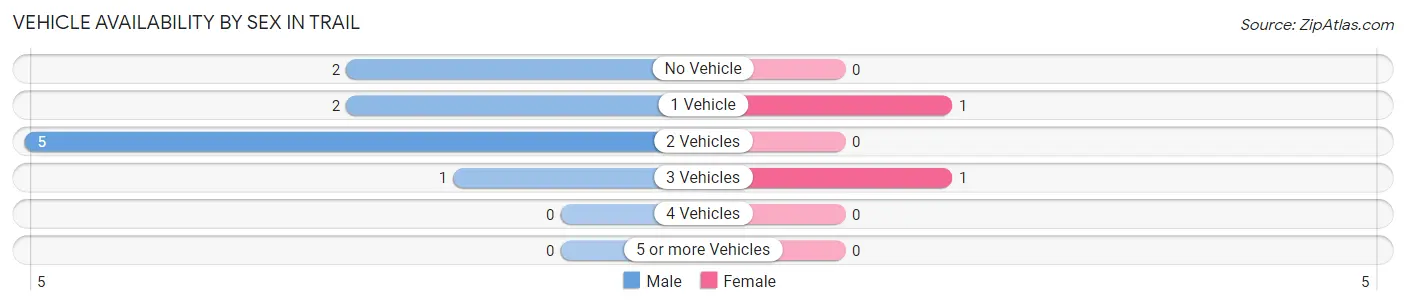
| Vehicles Available | Male | Female |
| No Vehicle | 2 (20.0%) | 0 (0.0%) |
| 1 Vehicle | 2 (20.0%) | 1 (50.0%) |
| 2 Vehicles | 5 (50.0%) | 0 (0.0%) |
| 3 Vehicles | 1 (10.0%) | 1 (50.0%) |
| 4 Vehicles | 0 (0.0%) | 0 (0.0%) |
| 5 or more Vehicles | 0 (0.0%) | 0 (0.0%) |
| Total | 10 (100.0%) | 2 (100.0%) |
Commute Time in Trail
The most frequently occuring commute durations in Trail are less than 5 minutes (5 commuters, 41.7%), 30 to 34 minutes (4 commuters, 33.3%), and 45 to 59 minutes (2 commuters, 16.7%).
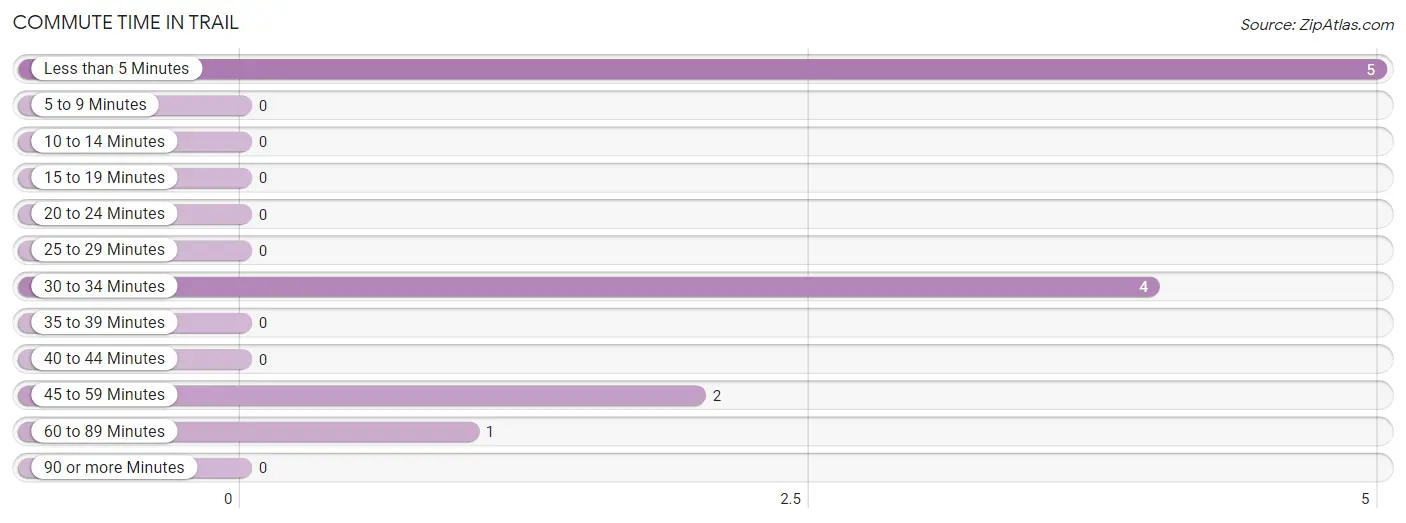
| Commute Time | # Commuters | % Commuters |
| Less than 5 Minutes | 5 | 41.7% |
| 5 to 9 Minutes | 0 | 0.0% |
| 10 to 14 Minutes | 0 | 0.0% |
| 15 to 19 Minutes | 0 | 0.0% |
| 20 to 24 Minutes | 0 | 0.0% |
| 25 to 29 Minutes | 0 | 0.0% |
| 30 to 34 Minutes | 4 | 33.3% |
| 35 to 39 Minutes | 0 | 0.0% |
| 40 to 44 Minutes | 0 | 0.0% |
| 45 to 59 Minutes | 2 | 16.7% |
| 60 to 89 Minutes | 1 | 8.3% |
| 90 or more Minutes | 0 | 0.0% |
Commute Time by Sex in Trail
The most common commute times in Trail are less than 5 minutes (5 commuters, 50.0%) for males and 45 to 59 minutes (1 commuters, 50.0%) for females.
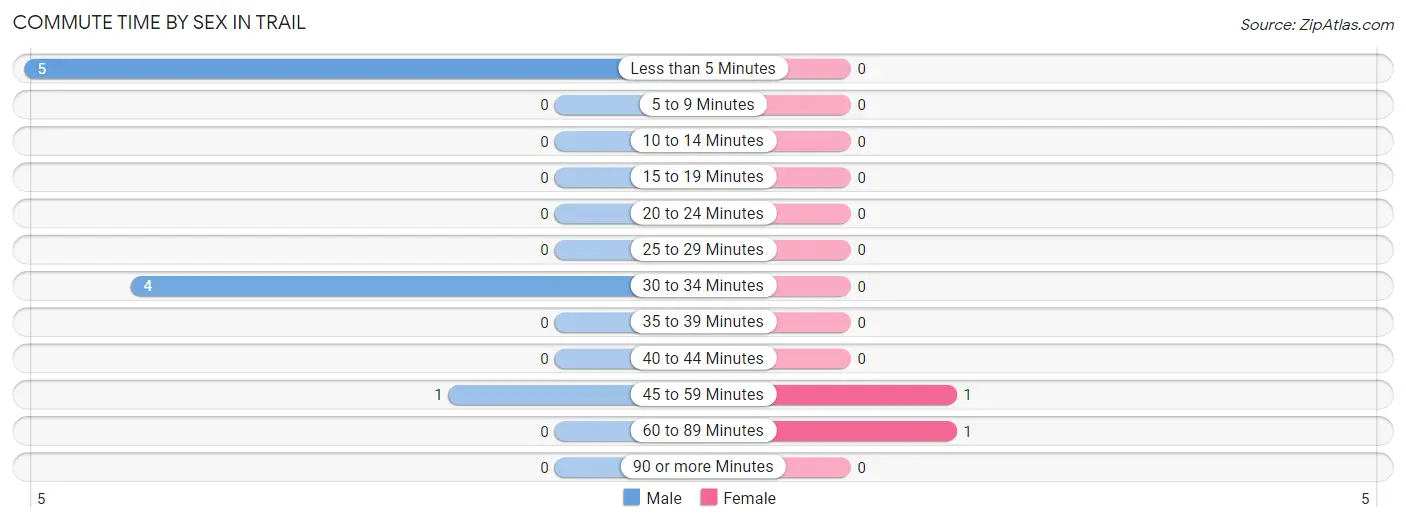
| Commute Time | Male | Female |
| Less than 5 Minutes | 5 (50.0%) | 0 (0.0%) |
| 5 to 9 Minutes | 0 (0.0%) | 0 (0.0%) |
| 10 to 14 Minutes | 0 (0.0%) | 0 (0.0%) |
| 15 to 19 Minutes | 0 (0.0%) | 0 (0.0%) |
| 20 to 24 Minutes | 0 (0.0%) | 0 (0.0%) |
| 25 to 29 Minutes | 0 (0.0%) | 0 (0.0%) |
| 30 to 34 Minutes | 4 (40.0%) | 0 (0.0%) |
| 35 to 39 Minutes | 0 (0.0%) | 0 (0.0%) |
| 40 to 44 Minutes | 0 (0.0%) | 0 (0.0%) |
| 45 to 59 Minutes | 1 (10.0%) | 1 (50.0%) |
| 60 to 89 Minutes | 0 (0.0%) | 1 (50.0%) |
| 90 or more Minutes | 0 (0.0%) | 0 (0.0%) |
Time of Departure to Work by Sex in Trail
The most frequent times of departure to work in Trail are 7:00 AM to 7:29 AM (5, 50.0%) for males and 7:00 AM to 7:29 AM (2, 100.0%) for females.
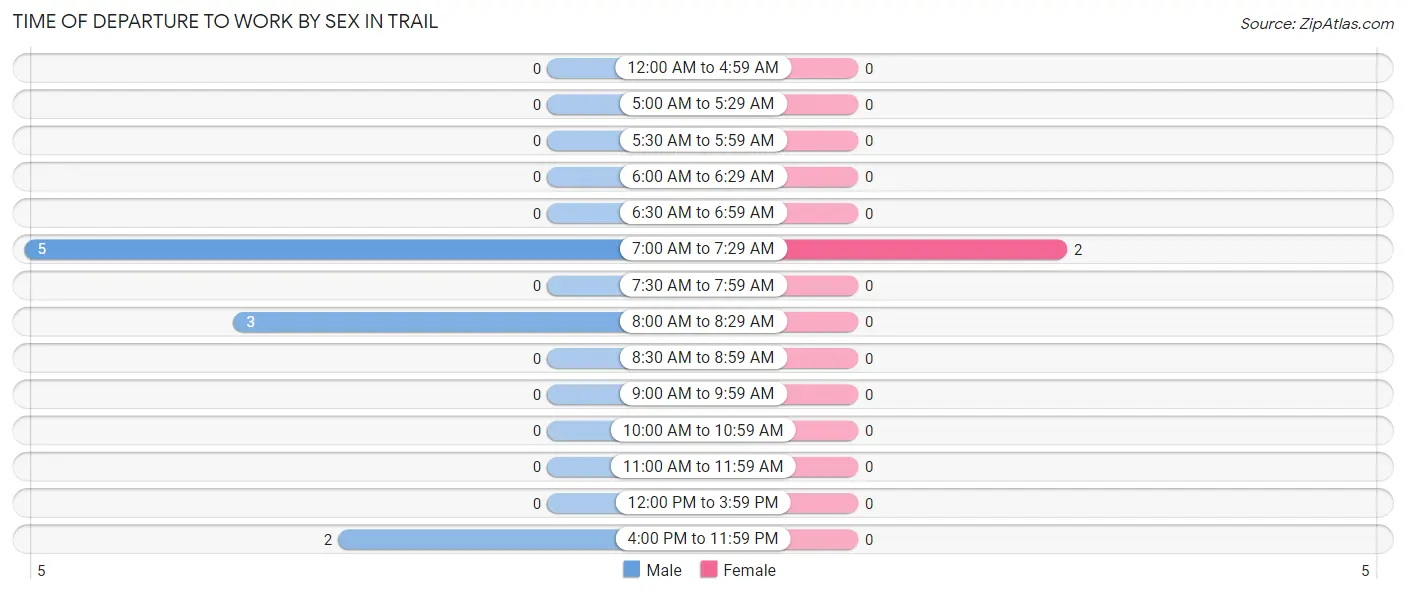
| Time of Departure | Male | Female |
| 12:00 AM to 4:59 AM | 0 (0.0%) | 0 (0.0%) |
| 5:00 AM to 5:29 AM | 0 (0.0%) | 0 (0.0%) |
| 5:30 AM to 5:59 AM | 0 (0.0%) | 0 (0.0%) |
| 6:00 AM to 6:29 AM | 0 (0.0%) | 0 (0.0%) |
| 6:30 AM to 6:59 AM | 0 (0.0%) | 0 (0.0%) |
| 7:00 AM to 7:29 AM | 5 (50.0%) | 2 (100.0%) |
| 7:30 AM to 7:59 AM | 0 (0.0%) | 0 (0.0%) |
| 8:00 AM to 8:29 AM | 3 (30.0%) | 0 (0.0%) |
| 8:30 AM to 8:59 AM | 0 (0.0%) | 0 (0.0%) |
| 9:00 AM to 9:59 AM | 0 (0.0%) | 0 (0.0%) |
| 10:00 AM to 10:59 AM | 0 (0.0%) | 0 (0.0%) |
| 11:00 AM to 11:59 AM | 0 (0.0%) | 0 (0.0%) |
| 12:00 PM to 3:59 PM | 0 (0.0%) | 0 (0.0%) |
| 4:00 PM to 11:59 PM | 2 (20.0%) | 0 (0.0%) |
| Total | 10 (100.0%) | 2 (100.0%) |
Housing Occupancy in Trail
Occupancy by Ownership in Trail
Of the total 19 dwellings in Trail, owner-occupied units account for 17 (89.5%), while renter-occupied units make up 2 (10.5%).
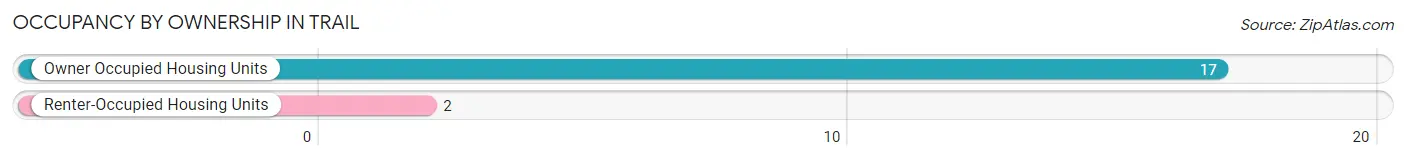
| Occupancy | # Housing Units | % Housing Units |
| Owner Occupied Housing Units | 17 | 89.5% |
| Renter-Occupied Housing Units | 2 | 10.5% |
| Total Occupied Housing Units | 19 | 100.0% |
Occupancy by Household Size in Trail
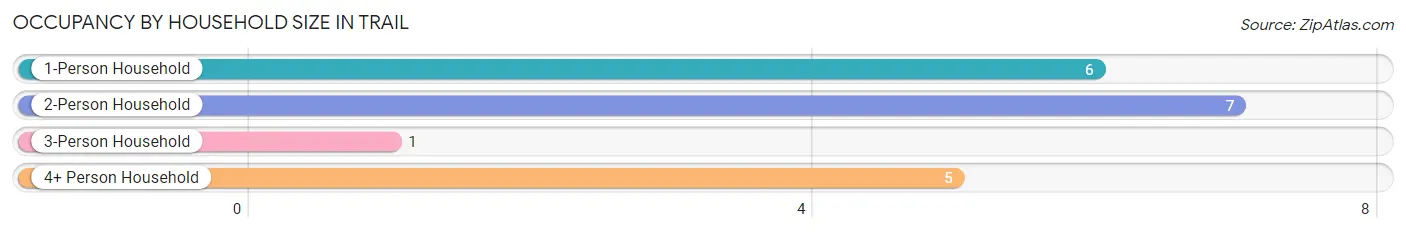
| Household Size | # Housing Units | % Housing Units |
| 1-Person Household | 6 | 31.6% |
| 2-Person Household | 7 | 36.8% |
| 3-Person Household | 1 | 5.3% |
| 4+ Person Household | 5 | 26.3% |
| Total Housing Units | 19 | 100.0% |
Occupancy by Ownership by Household Size in Trail
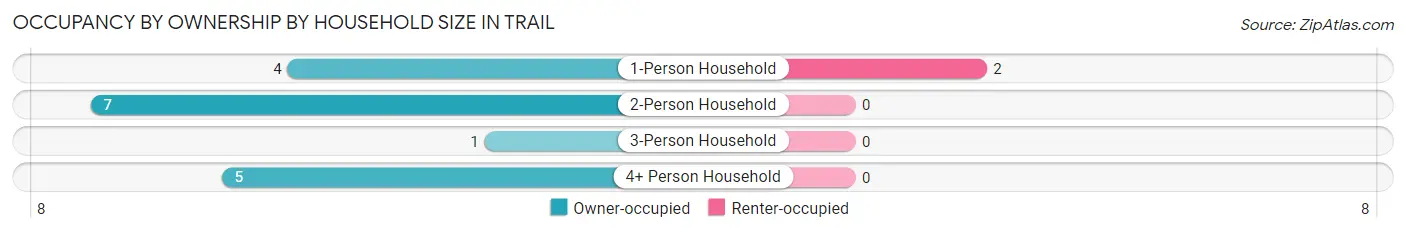
| Household Size | Owner-occupied | Renter-occupied |
| 1-Person Household | 4 (66.7%) | 2 (33.3%) |
| 2-Person Household | 7 (100.0%) | 0 (0.0%) |
| 3-Person Household | 1 (100.0%) | 0 (0.0%) |
| 4+ Person Household | 5 (100.0%) | 0 (0.0%) |
| Total Housing Units | 17 (89.5%) | 2 (10.5%) |
Occupancy by Educational Attainment in Trail
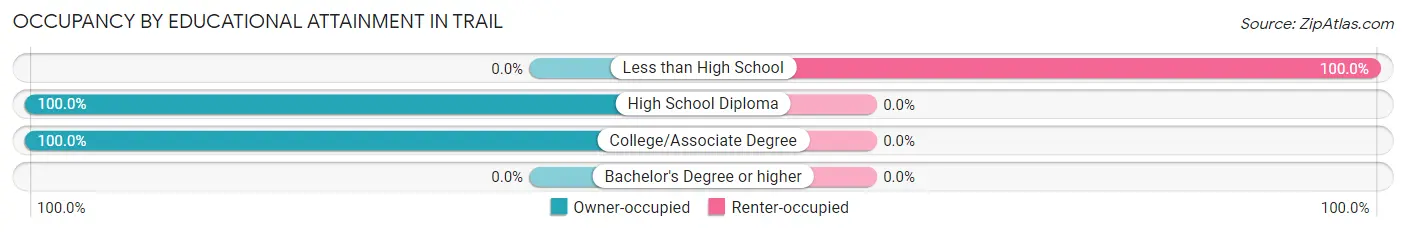
| Household Size | Owner-occupied | Renter-occupied |
| Less than High School | 0 (0.0%) | 2 (100.0%) |
| High School Diploma | 13 (100.0%) | 0 (0.0%) |
| College/Associate Degree | 4 (100.0%) | 0 (0.0%) |
| Bachelor's Degree or higher | 0 (0.0%) | 0 (0.0%) |
Occupancy by Age of Householder in Trail
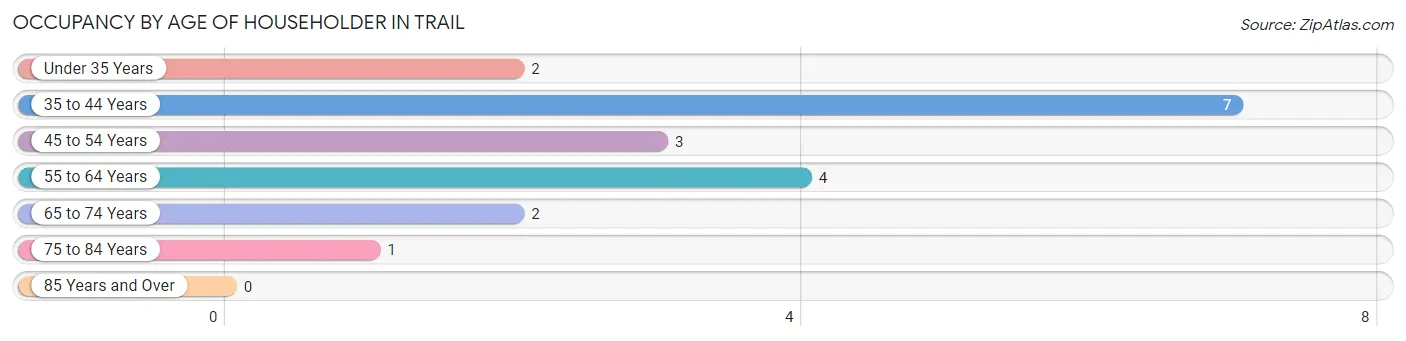
| Age Bracket | # Households | % Households |
| Under 35 Years | 2 | 10.5% |
| 35 to 44 Years | 7 | 36.8% |
| 45 to 54 Years | 3 | 15.8% |
| 55 to 64 Years | 4 | 21.0% |
| 65 to 74 Years | 2 | 10.5% |
| 75 to 84 Years | 1 | 5.3% |
| 85 Years and Over | 0 | 0.0% |
| Total | 19 | 100.0% |
Housing Finances in Trail
Median Income by Occupancy in Trail
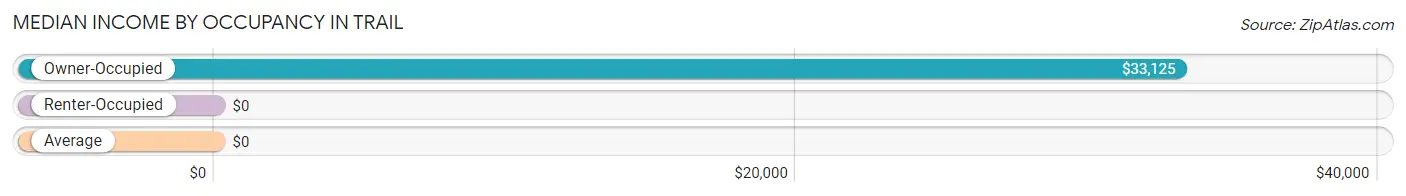
| Occupancy Type | # Households | Median Income |
| Owner-Occupied | 17 (89.5%) | $33,125 |
| Renter-Occupied | 2 (10.5%) | $0 |
| Average | 19 (100.0%) | $0 |
Occupancy by Householder Income Bracket in Trail
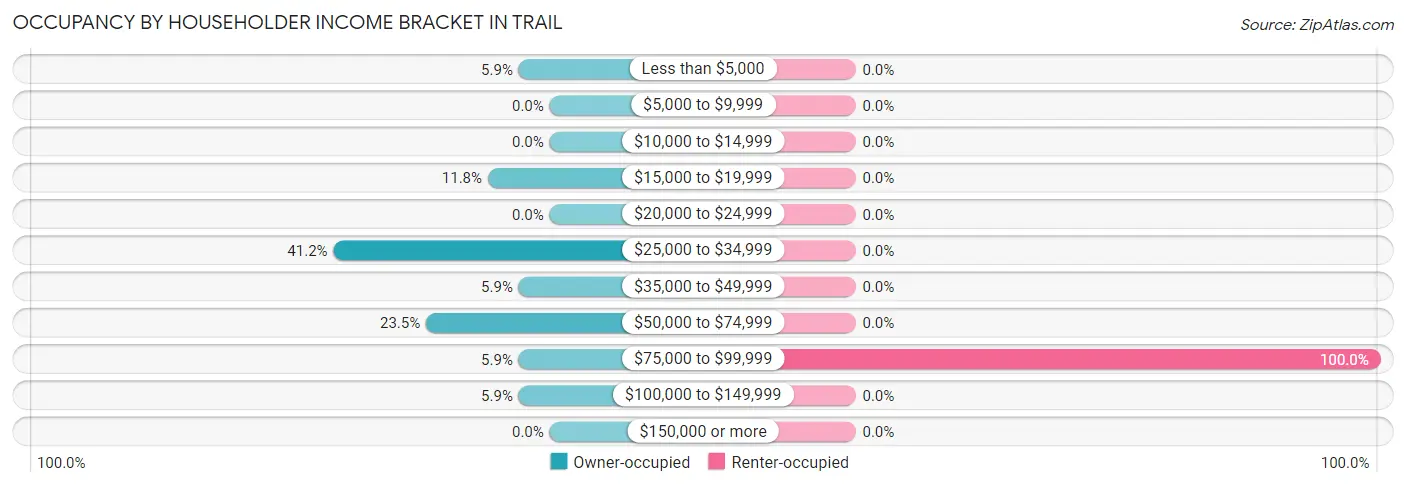
| Income Bracket | Owner-occupied | Renter-occupied |
| Less than $5,000 | 1 (5.9%) | 0 (0.0%) |
| $5,000 to $9,999 | 0 (0.0%) | 0 (0.0%) |
| $10,000 to $14,999 | 0 (0.0%) | 0 (0.0%) |
| $15,000 to $19,999 | 2 (11.8%) | 0 (0.0%) |
| $20,000 to $24,999 | 0 (0.0%) | 0 (0.0%) |
| $25,000 to $34,999 | 7 (41.2%) | 0 (0.0%) |
| $35,000 to $49,999 | 1 (5.9%) | 0 (0.0%) |
| $50,000 to $74,999 | 4 (23.5%) | 0 (0.0%) |
| $75,000 to $99,999 | 1 (5.9%) | 2 (100.0%) |
| $100,000 to $149,999 | 1 (5.9%) | 0 (0.0%) |
| $150,000 or more | 0 (0.0%) | 0 (0.0%) |
| Total | 17 (100.0%) | 2 (100.0%) |
Monthly Housing Cost Tiers in Trail
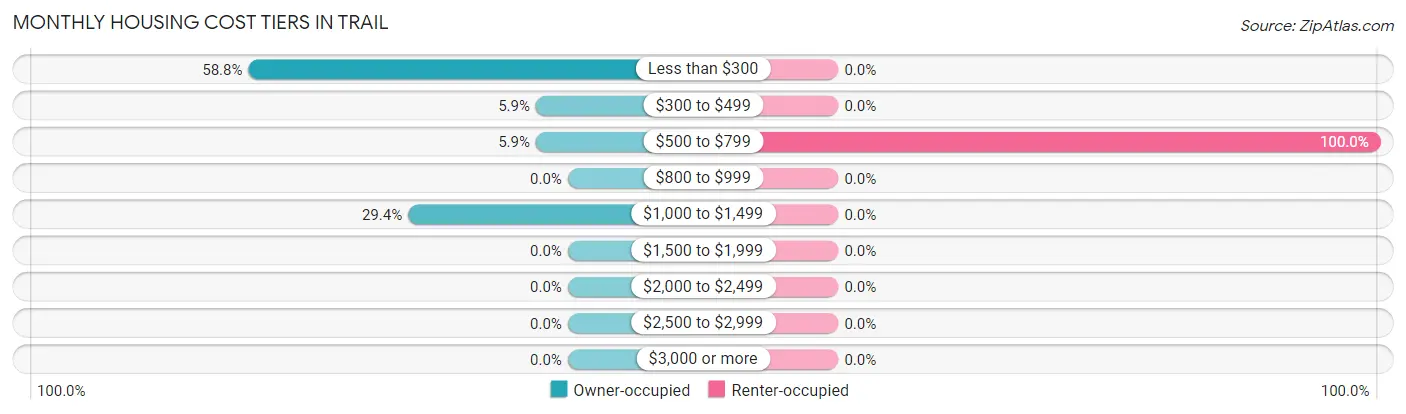
| Monthly Cost | Owner-occupied | Renter-occupied |
| Less than $300 | 10 (58.8%) | 0 (0.0%) |
| $300 to $499 | 1 (5.9%) | 0 (0.0%) |
| $500 to $799 | 1 (5.9%) | 2 (100.0%) |
| $800 to $999 | 0 (0.0%) | 0 (0.0%) |
| $1,000 to $1,499 | 5 (29.4%) | 0 (0.0%) |
| $1,500 to $1,999 | 0 (0.0%) | 0 (0.0%) |
| $2,000 to $2,499 | 0 (0.0%) | 0 (0.0%) |
| $2,500 to $2,999 | 0 (0.0%) | 0 (0.0%) |
| $3,000 or more | 0 (0.0%) | 0 (0.0%) |
| Total | 17 (100.0%) | 2 (100.0%) |
Physical Housing Characteristics in Trail
Housing Structures in Trail
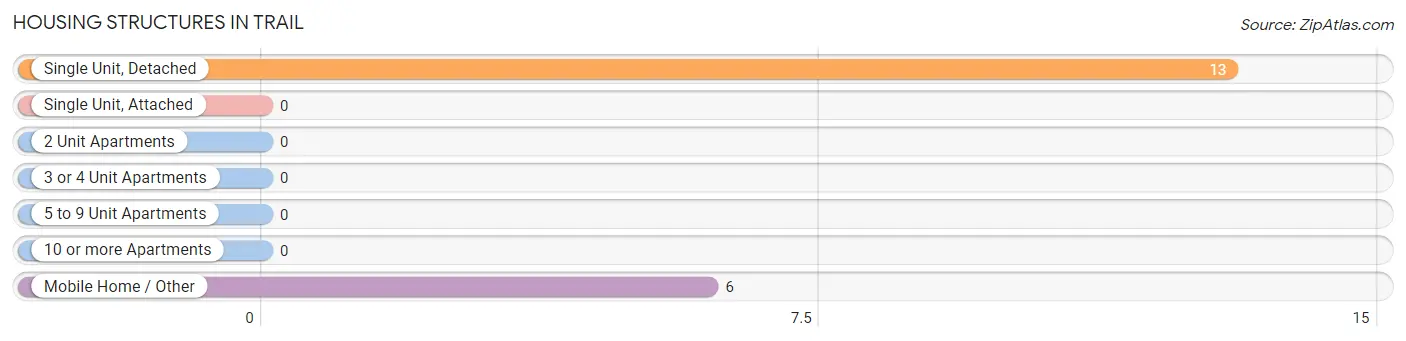
| Structure Type | # Housing Units | % Housing Units |
| Single Unit, Detached | 13 | 68.4% |
| Single Unit, Attached | 0 | 0.0% |
| 2 Unit Apartments | 0 | 0.0% |
| 3 or 4 Unit Apartments | 0 | 0.0% |
| 5 to 9 Unit Apartments | 0 | 0.0% |
| 10 or more Apartments | 0 | 0.0% |
| Mobile Home / Other | 6 | 31.6% |
| Total | 19 | 100.0% |
Housing Structures by Occupancy in Trail
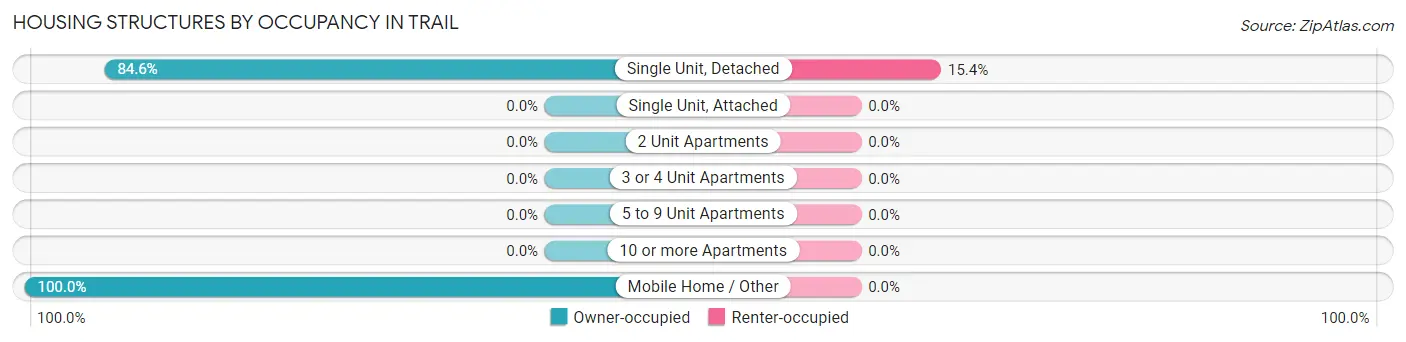
| Structure Type | Owner-occupied | Renter-occupied |
| Single Unit, Detached | 11 (84.6%) | 2 (15.4%) |
| Single Unit, Attached | 0 (0.0%) | 0 (0.0%) |
| 2 Unit Apartments | 0 (0.0%) | 0 (0.0%) |
| 3 or 4 Unit Apartments | 0 (0.0%) | 0 (0.0%) |
| 5 to 9 Unit Apartments | 0 (0.0%) | 0 (0.0%) |
| 10 or more Apartments | 0 (0.0%) | 0 (0.0%) |
| Mobile Home / Other | 6 (100.0%) | 0 (0.0%) |
| Total | 17 (89.5%) | 2 (10.5%) |
Housing Structures by Number of Rooms in Trail
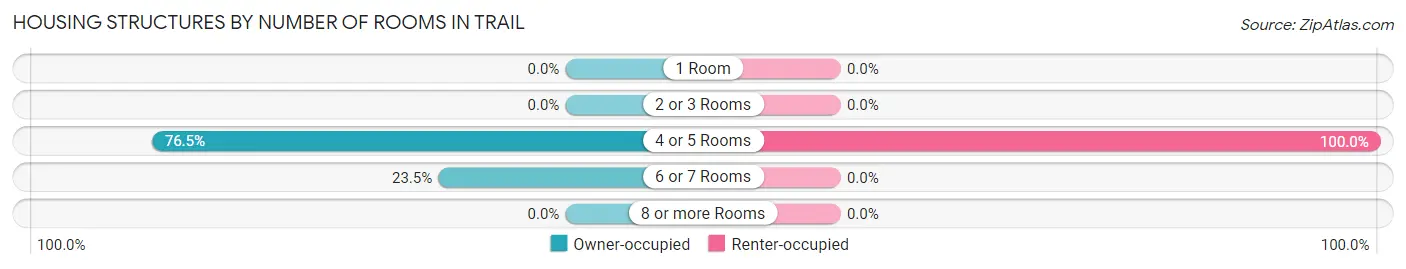
| Number of Rooms | Owner-occupied | Renter-occupied |
| 1 Room | 0 (0.0%) | 0 (0.0%) |
| 2 or 3 Rooms | 0 (0.0%) | 0 (0.0%) |
| 4 or 5 Rooms | 13 (76.5%) | 2 (100.0%) |
| 6 or 7 Rooms | 4 (23.5%) | 0 (0.0%) |
| 8 or more Rooms | 0 (0.0%) | 0 (0.0%) |
| Total | 17 (100.0%) | 2 (100.0%) |
Housing Structure by Heating Type in Trail
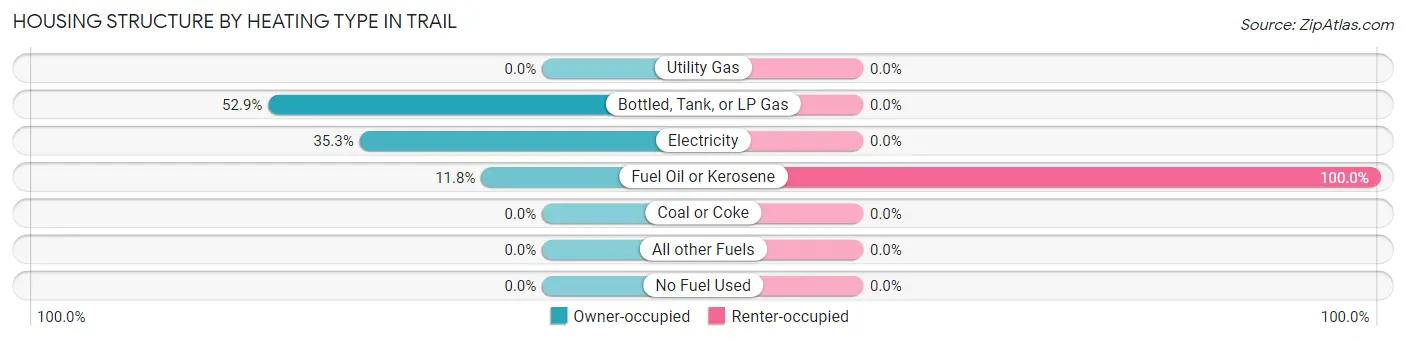
| Heating Type | Owner-occupied | Renter-occupied |
| Utility Gas | 0 (0.0%) | 0 (0.0%) |
| Bottled, Tank, or LP Gas | 9 (52.9%) | 0 (0.0%) |
| Electricity | 6 (35.3%) | 0 (0.0%) |
| Fuel Oil or Kerosene | 2 (11.8%) | 2 (100.0%) |
| Coal or Coke | 0 (0.0%) | 0 (0.0%) |
| All other Fuels | 0 (0.0%) | 0 (0.0%) |
| No Fuel Used | 0 (0.0%) | 0 (0.0%) |
| Total | 17 (100.0%) | 2 (100.0%) |
Household Vehicle Usage in Trail
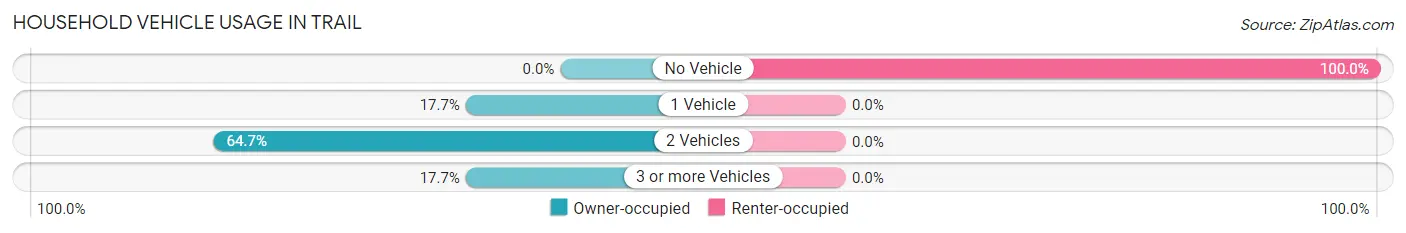
| Vehicles per Household | Owner-occupied | Renter-occupied |
| No Vehicle | 0 (0.0%) | 2 (100.0%) |
| 1 Vehicle | 3 (17.6%) | 0 (0.0%) |
| 2 Vehicles | 11 (64.7%) | 0 (0.0%) |
| 3 or more Vehicles | 3 (17.6%) | 0 (0.0%) |
| Total | 17 (100.0%) | 2 (100.0%) |
Real Estate & Mortgages in Trail
Real Estate and Mortgage Overview in Trail
| Characteristic | Without Mortgage | With Mortgage |
| Housing Units | 11 | 6 |
| Median Property Value | $45,000 | $0 |
| Median Household Income | - | - |
| Monthly Housing Costs | $242 | $0 |
| Real Estate Taxes | - | - |
Property Value by Mortgage Status in Trail
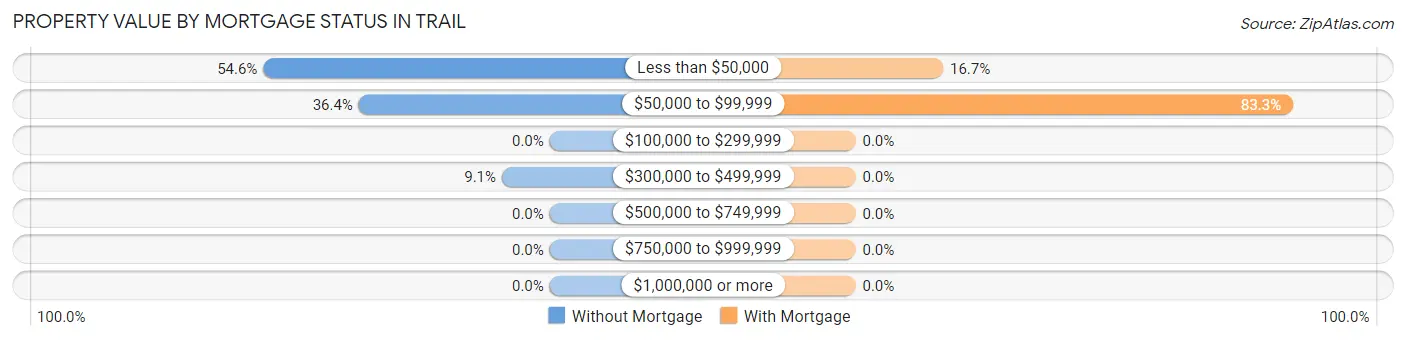
| Property Value | Without Mortgage | With Mortgage |
| Less than $50,000 | 6 (54.5%) | 1 (16.7%) |
| $50,000 to $99,999 | 4 (36.4%) | 5 (83.3%) |
| $100,000 to $299,999 | 0 (0.0%) | 0 (0.0%) |
| $300,000 to $499,999 | 1 (9.1%) | 0 (0.0%) |
| $500,000 to $749,999 | 0 (0.0%) | 0 (0.0%) |
| $750,000 to $999,999 | 0 (0.0%) | 0 (0.0%) |
| $1,000,000 or more | 0 (0.0%) | 0 (0.0%) |
| Total | 11 (100.0%) | 6 (100.0%) |
Household Income by Mortgage Status in Trail
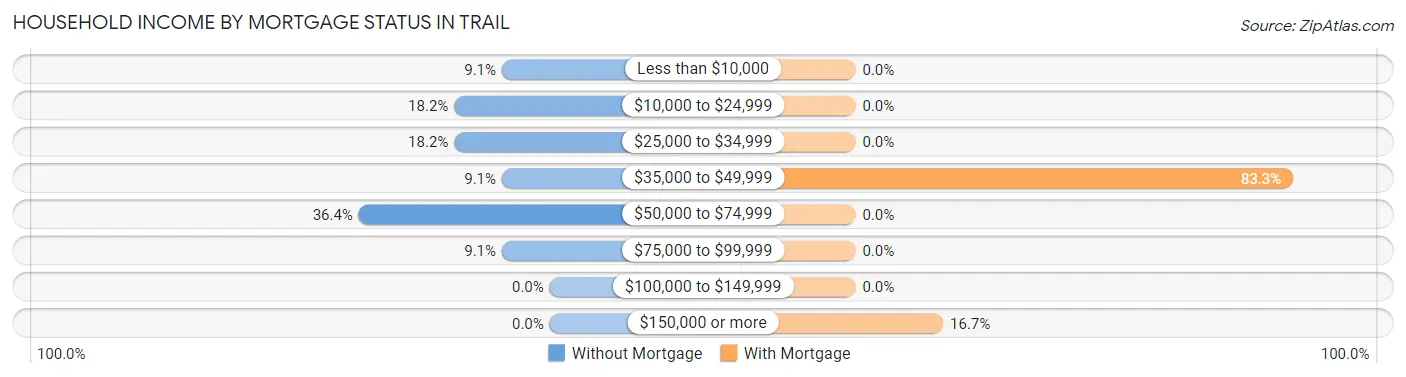
| Household Income | Without Mortgage | With Mortgage |
| Less than $10,000 | 1 (9.1%) | 0 (0.0%) |
| $10,000 to $24,999 | 2 (18.2%) | 0 (0.0%) |
| $25,000 to $34,999 | 2 (18.2%) | 0 (0.0%) |
| $35,000 to $49,999 | 1 (9.1%) | 5 (83.3%) |
| $50,000 to $74,999 | 4 (36.4%) | 0 (0.0%) |
| $75,000 to $99,999 | 1 (9.1%) | 0 (0.0%) |
| $100,000 to $149,999 | 0 (0.0%) | 0 (0.0%) |
| $150,000 or more | 0 (0.0%) | 1 (16.7%) |
| Total | 11 (100.0%) | 6 (100.0%) |
Property Value to Household Income Ratio in Trail
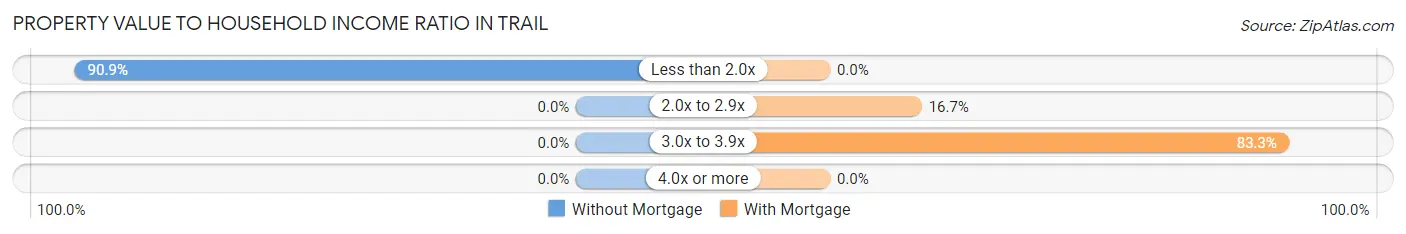
| Value-to-Income Ratio | Without Mortgage | With Mortgage |
| Less than 2.0x | 10 (90.9%) | 0 (0.0%) |
| 2.0x to 2.9x | 0 (0.0%) | 1 (16.7%) |
| 3.0x to 3.9x | 0 (0.0%) | 5 (83.3%) |
| 4.0x or more | 0 (0.0%) | 0 (0.0%) |
| Total | 11 (100.0%) | 6 (100.0%) |
Real Estate Taxes by Mortgage Status in Trail
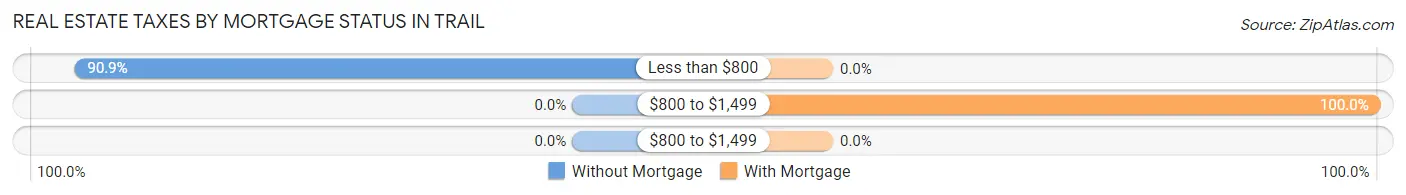
| Property Taxes | Without Mortgage | With Mortgage |
| Less than $800 | 10 (90.9%) | 0 (0.0%) |
| $800 to $1,499 | 0 (0.0%) | 6 (100.0%) |
| $800 to $1,499 | 0 (0.0%) | 0 (0.0%) |
| Total | 11 (100.0%) | 6 (100.0%) |
Health & Disability in Trail
Health Insurance Coverage by Age in Trail
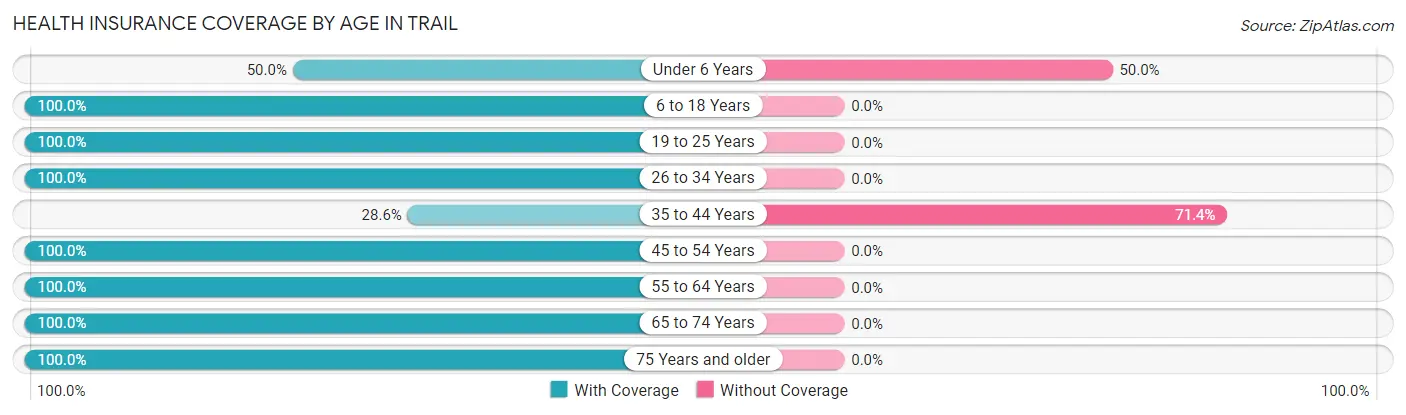
| Age Bracket | With Coverage | Without Coverage |
| Under 6 Years | 6 (50.0%) | 6 (50.0%) |
| 6 to 18 Years | 1 (100.0%) | 0 (0.0%) |
| 19 to 25 Years | 7 (100.0%) | 0 (0.0%) |
| 26 to 34 Years | 2 (100.0%) | 0 (0.0%) |
| 35 to 44 Years | 2 (28.6%) | 5 (71.4%) |
| 45 to 54 Years | 4 (100.0%) | 0 (0.0%) |
| 55 to 64 Years | 7 (100.0%) | 0 (0.0%) |
| 65 to 74 Years | 6 (100.0%) | 0 (0.0%) |
| 75 Years and older | 1 (100.0%) | 0 (0.0%) |
| Total | 36 (76.6%) | 11 (23.4%) |
Health Insurance Coverage by Citizenship Status in Trail
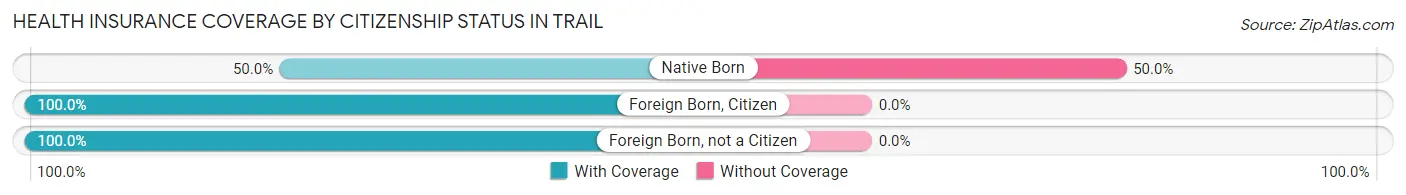
| Citizenship Status | With Coverage | Without Coverage |
| Native Born | 6 (50.0%) | 6 (50.0%) |
| Foreign Born, Citizen | 1 (100.0%) | 0 (0.0%) |
| Foreign Born, not a Citizen | 7 (100.0%) | 0 (0.0%) |
Health Insurance Coverage by Household Income in Trail
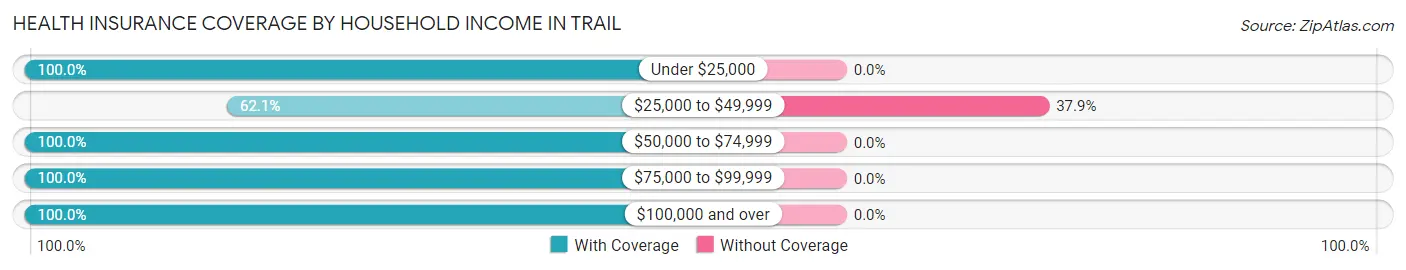
| Household Income | With Coverage | Without Coverage |
| Under $25,000 | 3 (100.0%) | 0 (0.0%) |
| $25,000 to $49,999 | 18 (62.1%) | 11 (37.9%) |
| $50,000 to $74,999 | 8 (100.0%) | 0 (0.0%) |
| $75,000 to $99,999 | 4 (100.0%) | 0 (0.0%) |
| $100,000 and over | 3 (100.0%) | 0 (0.0%) |
Public vs Private Health Insurance Coverage by Age in Trail
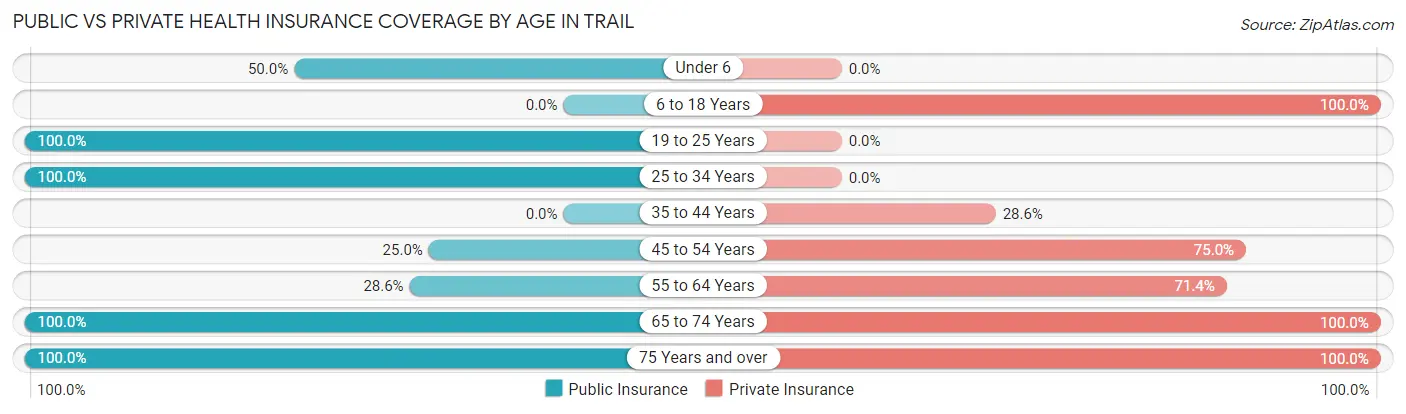
| Age Bracket | Public Insurance | Private Insurance |
| Under 6 | 6 (50.0%) | 0 (0.0%) |
| 6 to 18 Years | 0 (0.0%) | 1 (100.0%) |
| 19 to 25 Years | 7 (100.0%) | 0 (0.0%) |
| 25 to 34 Years | 2 (100.0%) | 0 (0.0%) |
| 35 to 44 Years | 0 (0.0%) | 2 (28.6%) |
| 45 to 54 Years | 1 (25.0%) | 3 (75.0%) |
| 55 to 64 Years | 2 (28.6%) | 5 (71.4%) |
| 65 to 74 Years | 6 (100.0%) | 6 (100.0%) |
| 75 Years and over | 1 (100.0%) | 1 (100.0%) |
| Total | 25 (53.2%) | 18 (38.3%) |
Disability Status by Sex by Age in Trail
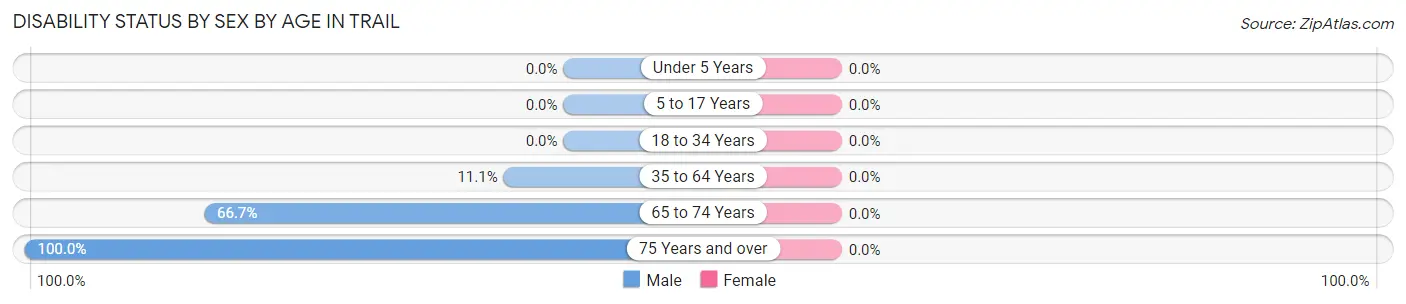
| Age Bracket | Male | Female |
| Under 5 Years | 0 (0.0%) | 0 (0.0%) |
| 5 to 17 Years | 0 (0.0%) | 0 (0.0%) |
| 18 to 34 Years | 0 (0.0%) | 0 (0.0%) |
| 35 to 64 Years | 1 (11.1%) | 0 (0.0%) |
| 65 to 74 Years | 4 (66.7%) | 0 (0.0%) |
| 75 Years and over | 1 (100.0%) | 0 (0.0%) |
Disability Class by Sex by Age in Trail
Disability Class: Hearing Difficulty
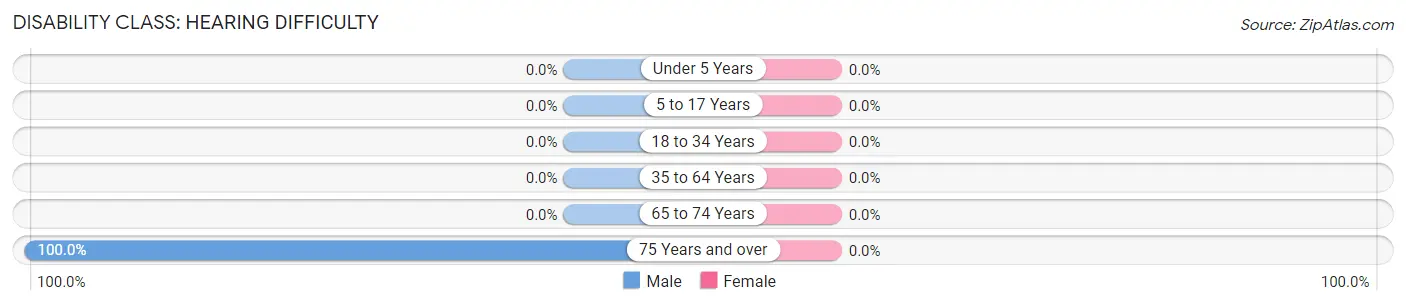
| Age Bracket | Male | Female |
| Under 5 Years | 0 (0.0%) | 0 (0.0%) |
| 5 to 17 Years | 0 (0.0%) | 0 (0.0%) |
| 18 to 34 Years | 0 (0.0%) | 0 (0.0%) |
| 35 to 64 Years | 0 (0.0%) | 0 (0.0%) |
| 65 to 74 Years | 0 (0.0%) | 0 (0.0%) |
| 75 Years and over | 1 (100.0%) | 0 (0.0%) |
Disability Class: Vision Difficulty
| Age Bracket | Male | Female |
| Under 5 Years | 0 (0.0%) | 0 (0.0%) |
| 5 to 17 Years | 0 (0.0%) | 0 (0.0%) |
| 18 to 34 Years | 0 (0.0%) | 0 (0.0%) |
| 35 to 64 Years | 0 (0.0%) | 0 (0.0%) |
| 65 to 74 Years | 0 (0.0%) | 0 (0.0%) |
| 75 Years and over | 0 (0.0%) | 0 (0.0%) |
Disability Class: Cognitive Difficulty
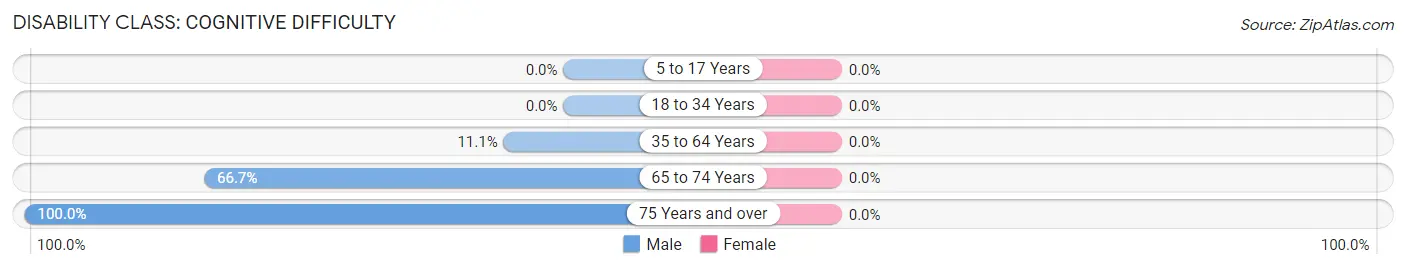
| Age Bracket | Male | Female |
| 5 to 17 Years | 0 (0.0%) | 0 (0.0%) |
| 18 to 34 Years | 0 (0.0%) | 0 (0.0%) |
| 35 to 64 Years | 1 (11.1%) | 0 (0.0%) |
| 65 to 74 Years | 4 (66.7%) | 0 (0.0%) |
| 75 Years and over | 1 (100.0%) | 0 (0.0%) |
Disability Class: Ambulatory Difficulty
| Age Bracket | Male | Female |
| 5 to 17 Years | 0 (0.0%) | 0 (0.0%) |
| 18 to 34 Years | 0 (0.0%) | 0 (0.0%) |
| 35 to 64 Years | 0 (0.0%) | 0 (0.0%) |
| 65 to 74 Years | 0 (0.0%) | 0 (0.0%) |
| 75 Years and over | 0 (0.0%) | 0 (0.0%) |
Disability Class: Self-Care Difficulty
| Age Bracket | Male | Female |
| 5 to 17 Years | 0 (0.0%) | 0 (0.0%) |
| 18 to 34 Years | 0 (0.0%) | 0 (0.0%) |
| 35 to 64 Years | 0 (0.0%) | 0 (0.0%) |
| 65 to 74 Years | 0 (0.0%) | 0 (0.0%) |
| 75 Years and over | 0 (0.0%) | 0 (0.0%) |
Technology Access in Trail
Computing Device Access in Trail
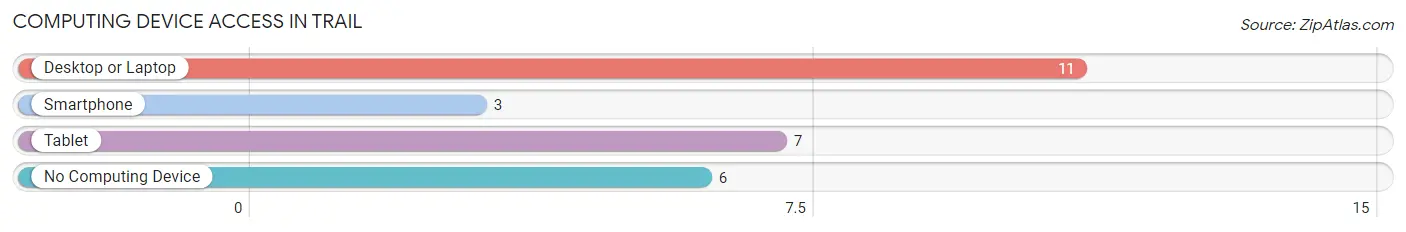
| Device Type | # Households | % Households |
| Desktop or Laptop | 11 | 57.9% |
| Smartphone | 3 | 15.8% |
| Tablet | 7 | 36.8% |
| No Computing Device | 6 | 31.6% |
| Total | 19 | 100.0% |
Internet Access in Trail
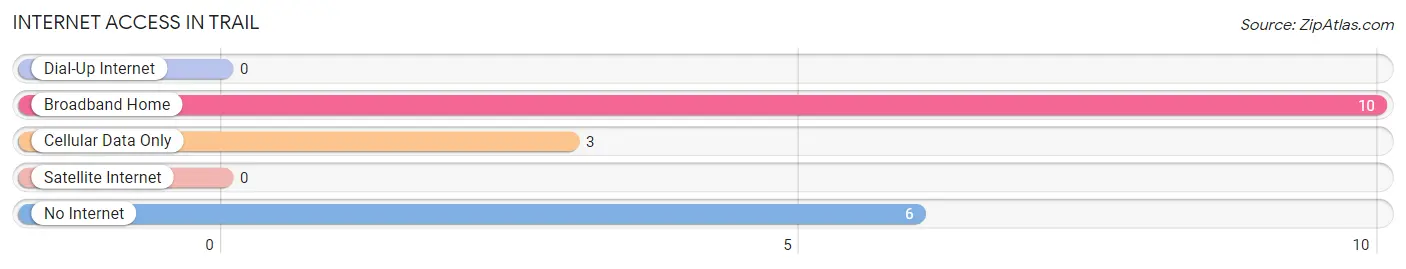
| Internet Type | # Households | % Households |
| Dial-Up Internet | 0 | 0.0% |
| Broadband Home | 10 | 52.6% |
| Cellular Data Only | 3 | 15.8% |
| Satellite Internet | 0 | 0.0% |
| No Internet | 6 | 31.6% |
| Total | 19 | 100.0% |
Trail Summary
MN History
Minnesota is a state located in the Midwestern United States. It was admitted to the Union as the 32nd state on May 11, 1858. Minnesota was originally part of the French colony of New France, which was ceded to the British in 1763. The area was then part of the Northwest Territory until 1803, when it became part of the Indiana Territory. In 1805, the area was part of the Louisiana Purchase. In 1819, the area was part of the Michigan Territory, and in 1834, it became part of the Wisconsin Territory.
The first permanent settlement in Minnesota was established in 1819 by the French-Canadian fur trader Pierre-Charles Le Sueur. He established a trading post near present-day St. Paul. The area was then part of the United States, and in 1849, Minnesota became a territory. The first territorial governor was Alexander Ramsey, who served from 1849 to 1853.
In 1858, Minnesota became the 32nd state in the Union. The state was admitted to the Union with the Dakota Territory, which was split into North and South Dakota in 1889. The state's name is derived from the Dakota word for "sky-tinted water," referring to the Minnesota River.
Minnesota has a rich history of immigration. The first immigrants to the state were French-Canadians, who were followed by German, Scandinavian, and Irish immigrants. In the late 19th century, many African Americans moved to Minnesota, and in the early 20th century, many immigrants from Eastern Europe and Asia arrived.
Geography
Minnesota is located in the Midwestern United States, bordered by the Canadian provinces of Ontario and Manitoba to the north, and by the states of Wisconsin to the east, Iowa to the south, and North and South Dakota to the west. The state has a total area of 86,943 square miles, making it the 12th largest state in the United States.
The state is divided into 87 counties, and its capital is St. Paul. The state is home to the Boundary Waters Canoe Area Wilderness, the largest wilderness area east of the Mississippi River. The state also has numerous lakes, including Lake Superior, the largest of the Great Lakes.
Economy
Minnesota has a diversified economy, with a mix of industries including agriculture, manufacturing, technology, and services. The state is a major producer of corn, soybeans, and other grains, and is also a major producer of dairy products.
Manufacturing is a major part of the state's economy, with products ranging from medical devices to food processing. The state is also home to several major technology companies, including 3M, Cargill, and Medtronic.
The state's service sector is also important, with tourism, finance, and health care being major contributors to the state's economy. The state is home to several major companies, including Target, Best Buy, and UnitedHealth Group.
Demographics
As of the 2010 census, Minnesota had a population of 5,303,925. The state is home to a diverse population, with the largest ethnic groups being German (25.2%), Norwegian (17.2%), and Irish (13.2%).
The state has a median household income of $60,828, and a poverty rate of 11.2%. The state's largest cities are Minneapolis, St. Paul, Rochester, Duluth, and Bloomington.
Minnesota is home to a variety of religions, with the largest being Christianity (63.2%), followed by Judaism (2.2%), Islam (1.2%), and Buddhism (0.7%). The state is also home to a variety of languages, with the most common being English (90.2%), followed by Spanish (3.2%), and Hmong (1.2%).
Common Questions
What is Per Capita Income in Trail?
Per Capita income in Trail is $19,862.
What is Inequality or Gini Index in Trail?
Inequality or Gini Index in Trail is 0.34.
What is the Total Population of Trail?
Total Population of Trail is 47.
What is the Total Male Population of Trail?
Total Male Population of Trail is 30.
What is the Total Female Population of Trail?
Total Female Population of Trail is 17.
What is the Ratio of Males per 100 Females in Trail?
There are 176.47 Males per 100 Females in Trail.
What is the Ratio of Females per 100 Males in Trail?
There are 56.67 Females per 100 Males in Trail.
What is the Median Population Age in Trail?
Median Population Age in Trail is 39.3 Years.
What is the Average Family Size in Trail
Average Family Size in Trail is 2.6 People.
What is the Average Household Size in Trail
Average Household Size in Trail is 2.5 People.
How Large is the Labor Force in Trail?
There are 12 People in the Labor Forcein in Trail.
What is the Percentage of People in the Labor Force in Trail?
34.3% of People are in the Labor Force in Trail.