South African vs Nigerian Wage/Income Gap
COMPARE
South African
Nigerian
Wage/Income Gap
Wage/Income Gap Comparison
South Africans
Nigerians
28.0%
WAGE/INCOME GAP
0.5/ 100
METRIC RATING
282nd/ 347
METRIC RANK
23.0%
WAGE/INCOME GAP
99.9/ 100
METRIC RATING
78th/ 347
METRIC RANK
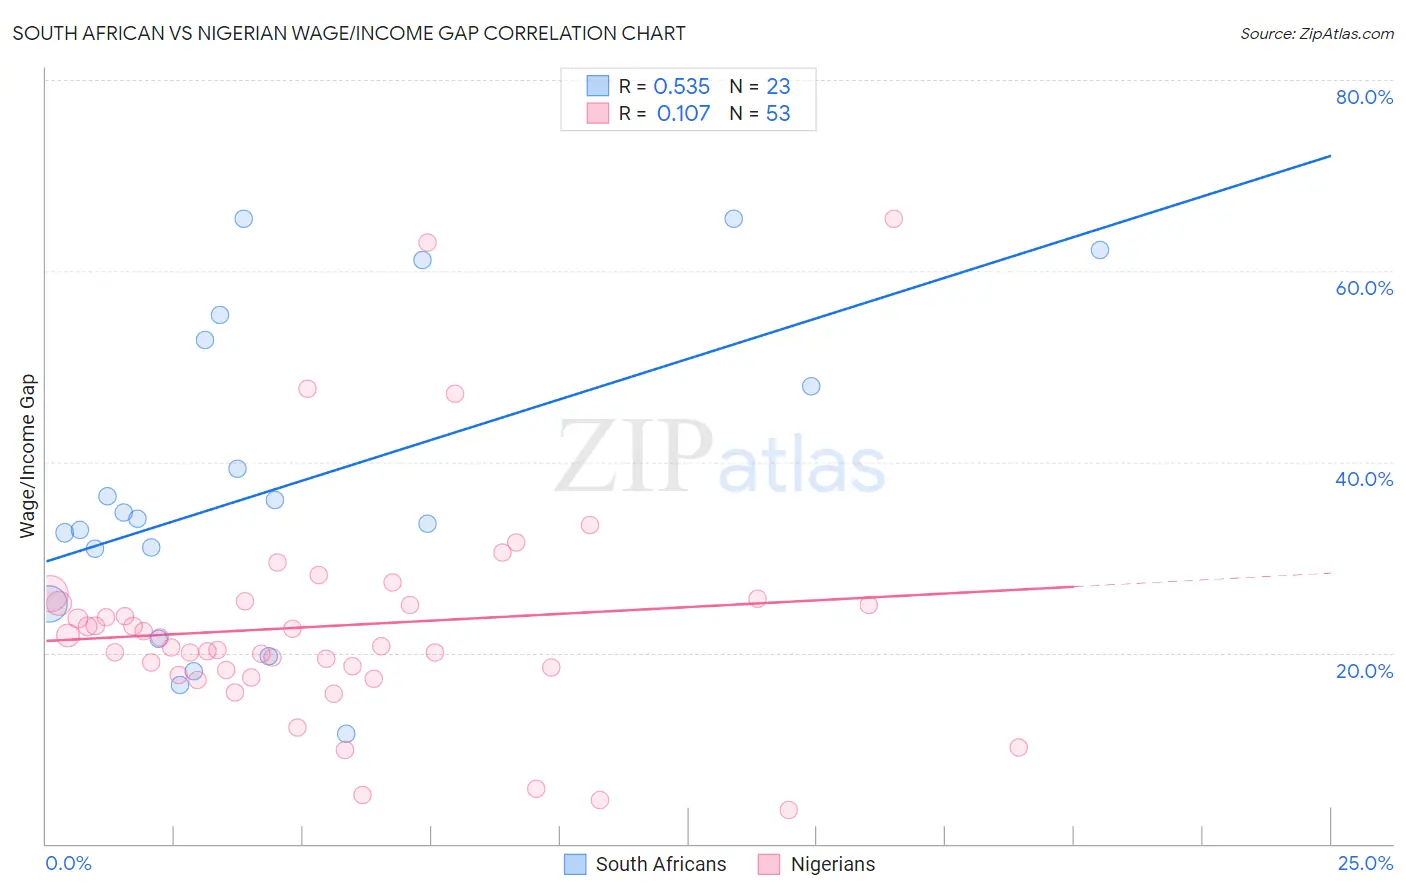
South African vs Nigerian Wage/Income Gap Correlation Chart
The statistical analysis conducted on geographies consisting of 182,544,146 people shows a substantial positive correlation between the proportion of South Africans and wage/income gap percentage in the United States with a correlation coefficient (R) of 0.535 and weighted average of 28.0%. Similarly, the statistical analysis conducted on geographies consisting of 332,662,722 people shows a poor positive correlation between the proportion of Nigerians and wage/income gap percentage in the United States with a correlation coefficient (R) of 0.107 and weighted average of 23.0%, a difference of 22.0%.
Wage/Income Gap Correlation Summary
| Measurement | South African | Nigerian |
| Minimum | 11.5% | 3.6% |
| Maximum | 65.5% | 65.4% |
| Range | 54.0% | 61.9% |
| Mean | 37.6% | 22.8% |
| Median | 34.0% | 20.7% |
| Interquartile 25% (IQ1) | 25.1% | 17.9% |
| Interquartile 75% (IQ3) | 52.7% | 25.3% |
| Interquartile Range (IQR) | 27.6% | 7.3% |
| Standard Deviation (Sample) | 16.2% | 11.7% |
| Standard Deviation (Population) | 15.9% | 11.6% |
Similar Demographics by Wage/Income Gap
Demographics Similar to South Africans by Wage/Income Gap
In terms of wage/income gap, the demographic groups most similar to South Africans are Burmese (28.0%, a difference of 0.030%), Russian (28.0%, a difference of 0.080%), French Canadian (28.1%, a difference of 0.18%), Immigrants from Sweden (28.1%, a difference of 0.18%), and Romanian (28.0%, a difference of 0.23%).
| Demographics | Rating | Rank | Wage/Income Gap |
| Immigrants | Japan | 0.7 /100 | #275 | Tragic 27.9% |
| Lebanese | 0.7 /100 | #276 | Tragic 27.9% |
| Latvians | 0.7 /100 | #277 | Tragic 27.9% |
| Immigrants | England | 0.6 /100 | #278 | Tragic 27.9% |
| Romanians | 0.5 /100 | #279 | Tragic 28.0% |
| Russians | 0.5 /100 | #280 | Tragic 28.0% |
| Burmese | 0.5 /100 | #281 | Tragic 28.0% |
| South Africans | 0.5 /100 | #282 | Tragic 28.0% |
| French Canadians | 0.4 /100 | #283 | Tragic 28.1% |
| Immigrants | Sweden | 0.4 /100 | #284 | Tragic 28.1% |
| Italians | 0.4 /100 | #285 | Tragic 28.1% |
| Immigrants | Austria | 0.4 /100 | #286 | Tragic 28.1% |
| Okinawans | 0.4 /100 | #287 | Tragic 28.1% |
| Choctaw | 0.4 /100 | #288 | Tragic 28.1% |
| Canadians | 0.3 /100 | #289 | Tragic 28.1% |
Demographics Similar to Nigerians by Wage/Income Gap
In terms of wage/income gap, the demographic groups most similar to Nigerians are Immigrants from Nicaragua (23.0%, a difference of 0.090%), African (22.9%, a difference of 0.11%), Salvadoran (23.0%, a difference of 0.15%), Ecuadorian (22.9%, a difference of 0.24%), and Fijian (22.9%, a difference of 0.25%).
| Demographics | Rating | Rank | Wage/Income Gap |
| Immigrants | El Salvador | 99.9 /100 | #71 | Exceptional 22.8% |
| Sub-Saharan Africans | 99.9 /100 | #72 | Exceptional 22.8% |
| Immigrants | Eastern Africa | 99.9 /100 | #73 | Exceptional 22.8% |
| Immigrants | Burma/Myanmar | 99.9 /100 | #74 | Exceptional 22.8% |
| Fijians | 99.9 /100 | #75 | Exceptional 22.9% |
| Ecuadorians | 99.9 /100 | #76 | Exceptional 22.9% |
| Africans | 99.9 /100 | #77 | Exceptional 22.9% |
| Nigerians | 99.9 /100 | #78 | Exceptional 23.0% |
| Immigrants | Nicaragua | 99.9 /100 | #79 | Exceptional 23.0% |
| Salvadorans | 99.9 /100 | #80 | Exceptional 23.0% |
| Bermudans | 99.8 /100 | #81 | Exceptional 23.1% |
| Central Americans | 99.8 /100 | #82 | Exceptional 23.1% |
| Immigrants | Africa | 99.8 /100 | #83 | Exceptional 23.2% |
| Cubans | 99.7 /100 | #84 | Exceptional 23.3% |
| Immigrants | Cambodia | 99.7 /100 | #85 | Exceptional 23.3% |