Sioux vs Immigrants from Somalia Wage/Income Gap
COMPARE
Sioux
Immigrants from Somalia
Wage/Income Gap
Wage/Income Gap Comparison
Sioux
Immigrants from Somalia
24.3%
WAGE/INCOME GAP
96.9/ 100
METRIC RATING
113th/ 347
METRIC RANK
21.2%
WAGE/INCOME GAP
100.0/ 100
METRIC RATING
37th/ 347
METRIC RANK
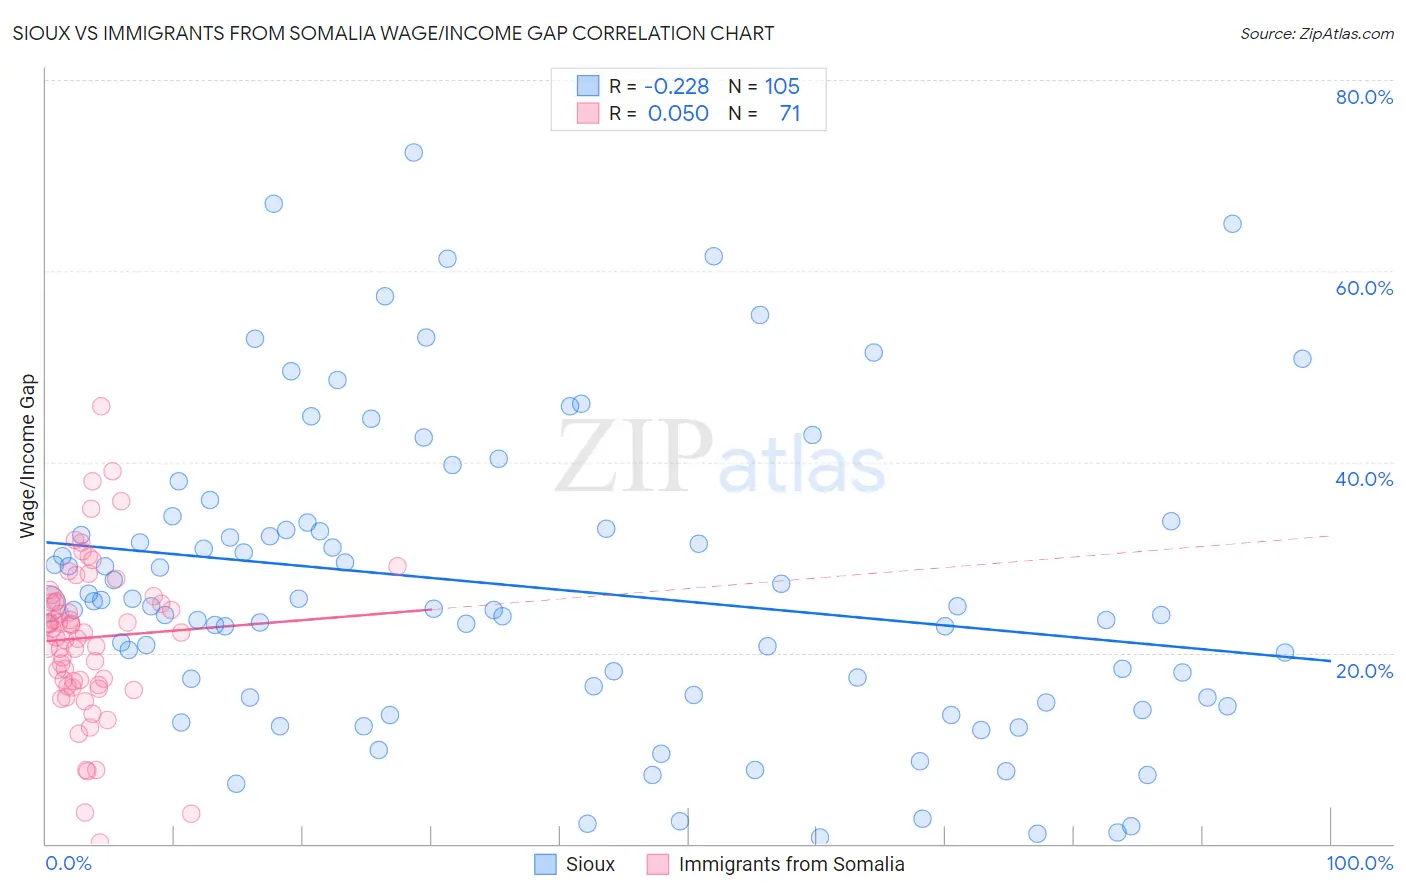
Sioux vs Immigrants from Somalia Wage/Income Gap Correlation Chart
The statistical analysis conducted on geographies consisting of 233,992,822 people shows a weak negative correlation between the proportion of Sioux and wage/income gap percentage in the United States with a correlation coefficient (R) of -0.228 and weighted average of 24.3%. Similarly, the statistical analysis conducted on geographies consisting of 92,095,099 people shows a slight positive correlation between the proportion of Immigrants from Somalia and wage/income gap percentage in the United States with a correlation coefficient (R) of 0.050 and weighted average of 21.2%, a difference of 14.5%.
Wage/Income Gap Correlation Summary
| Measurement | Sioux | Immigrants from Somalia |
| Minimum | 0.72% | 0.17% |
| Maximum | 72.4% | 45.8% |
| Range | 71.7% | 45.6% |
| Mean | 26.9% | 21.6% |
| Median | 24.9% | 22.2% |
| Interquartile 25% (IQ1) | 15.3% | 16.7% |
| Interquartile 75% (IQ3) | 33.4% | 25.9% |
| Interquartile Range (IQR) | 18.1% | 9.2% |
| Standard Deviation (Sample) | 15.9% | 8.3% |
| Standard Deviation (Population) | 15.8% | 8.2% |
Similar Demographics by Wage/Income Gap
Demographics Similar to Sioux by Wage/Income Gap
In terms of wage/income gap, the demographic groups most similar to Sioux are Immigrants from Colombia (24.3%, a difference of 0.050%), Panamanian (24.4%, a difference of 0.20%), Immigrants from Kenya (24.4%, a difference of 0.26%), Alaska Native (24.4%, a difference of 0.43%), and Soviet Union (24.2%, a difference of 0.45%).
| Demographics | Rating | Rank | Wage/Income Gap |
| Sudanese | 98.6 /100 | #106 | Exceptional 24.0% |
| Yaqui | 98.4 /100 | #107 | Exceptional 24.0% |
| Immigrants | Albania | 98.4 /100 | #108 | Exceptional 24.0% |
| Ugandans | 98.3 /100 | #109 | Exceptional 24.1% |
| Immigrants | Morocco | 98.1 /100 | #110 | Exceptional 24.1% |
| Soviet Union | 97.6 /100 | #111 | Exceptional 24.2% |
| Immigrants | Colombia | 97.0 /100 | #112 | Exceptional 24.3% |
| Sioux | 96.9 /100 | #113 | Exceptional 24.3% |
| Panamanians | 96.5 /100 | #114 | Exceptional 24.4% |
| Immigrants | Kenya | 96.4 /100 | #115 | Exceptional 24.4% |
| Alaska Natives | 96.0 /100 | #116 | Exceptional 24.4% |
| Immigrants | Afghanistan | 95.9 /100 | #117 | Exceptional 24.4% |
| Immigrants | Micronesia | 95.8 /100 | #118 | Exceptional 24.4% |
| Kenyans | 95.8 /100 | #119 | Exceptional 24.5% |
| Cree | 95.6 /100 | #120 | Exceptional 24.5% |
Demographics Similar to Immigrants from Somalia by Wage/Income Gap
In terms of wage/income gap, the demographic groups most similar to Immigrants from Somalia are Immigrants from Belize (21.3%, a difference of 0.050%), Belizean (21.2%, a difference of 0.070%), Somali (21.2%, a difference of 0.090%), Colville (21.3%, a difference of 0.16%), and Lumbee (21.3%, a difference of 0.36%).
| Demographics | Rating | Rank | Wage/Income Gap |
| Immigrants | Bangladesh | 100.0 /100 | #30 | Exceptional 20.9% |
| Vietnamese | 100.0 /100 | #31 | Exceptional 21.0% |
| Immigrants | Yemen | 100.0 /100 | #32 | Exceptional 21.1% |
| Immigrants | Bahamas | 100.0 /100 | #33 | Exceptional 21.1% |
| Pima | 100.0 /100 | #34 | Exceptional 21.1% |
| Somalis | 100.0 /100 | #35 | Exceptional 21.2% |
| Belizeans | 100.0 /100 | #36 | Exceptional 21.2% |
| Immigrants | Somalia | 100.0 /100 | #37 | Exceptional 21.2% |
| Immigrants | Belize | 100.0 /100 | #38 | Exceptional 21.3% |
| Colville | 100.0 /100 | #39 | Exceptional 21.3% |
| Lumbee | 100.0 /100 | #40 | Exceptional 21.3% |
| Liberians | 100.0 /100 | #41 | Exceptional 21.4% |
| Immigrants | Sierra Leone | 100.0 /100 | #42 | Exceptional 21.4% |
| Sierra Leoneans | 100.0 /100 | #43 | Exceptional 21.4% |
| Immigrants | Eritrea | 100.0 /100 | #44 | Exceptional 21.4% |