Sioux vs Immigrants from Western Europe Wage/Income Gap
COMPARE
Sioux
Immigrants from Western Europe
Wage/Income Gap
Wage/Income Gap Comparison
Sioux
Immigrants from Western Europe
24.3%
WAGE/INCOME GAP
96.9/ 100
METRIC RATING
113th/ 347
METRIC RANK
27.8%
WAGE/INCOME GAP
0.9/ 100
METRIC RATING
270th/ 347
METRIC RANK
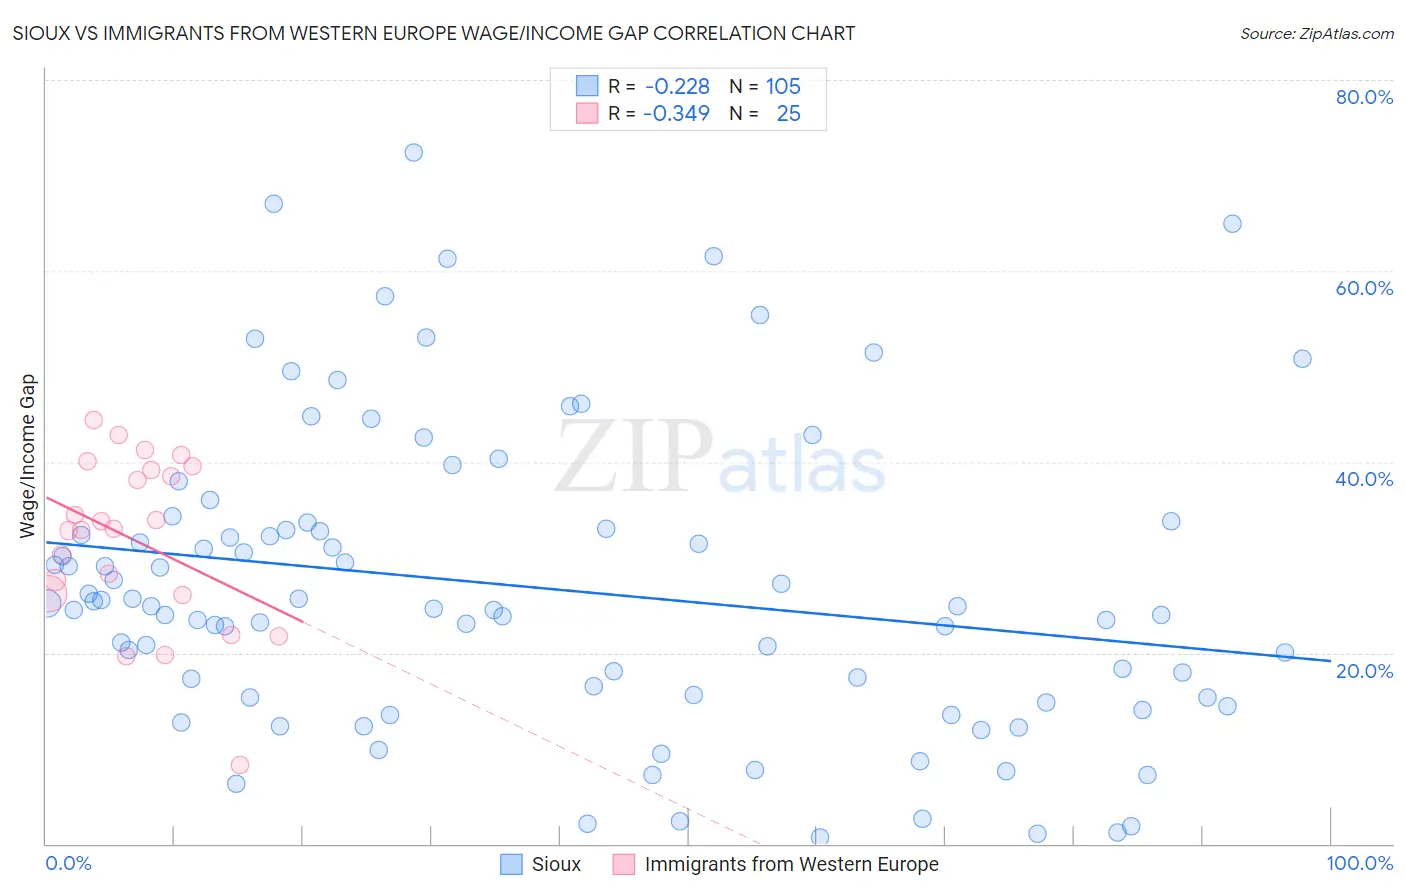
Sioux vs Immigrants from Western Europe Wage/Income Gap Correlation Chart
The statistical analysis conducted on geographies consisting of 233,992,822 people shows a weak negative correlation between the proportion of Sioux and wage/income gap percentage in the United States with a correlation coefficient (R) of -0.228 and weighted average of 24.3%. Similarly, the statistical analysis conducted on geographies consisting of 493,207,642 people shows a mild negative correlation between the proportion of Immigrants from Western Europe and wage/income gap percentage in the United States with a correlation coefficient (R) of -0.349 and weighted average of 27.8%, a difference of 14.1%.
Wage/Income Gap Correlation Summary
| Measurement | Sioux | Immigrants from Western Europe |
| Minimum | 0.72% | 8.2% |
| Maximum | 72.4% | 44.3% |
| Range | 71.7% | 36.1% |
| Mean | 26.9% | 31.8% |
| Median | 24.9% | 33.0% |
| Interquartile 25% (IQ1) | 15.3% | 26.1% |
| Interquartile 75% (IQ3) | 33.4% | 39.4% |
| Interquartile Range (IQR) | 18.1% | 13.2% |
| Standard Deviation (Sample) | 15.9% | 8.8% |
| Standard Deviation (Population) | 15.8% | 8.7% |
Similar Demographics by Wage/Income Gap
Demographics Similar to Sioux by Wage/Income Gap
In terms of wage/income gap, the demographic groups most similar to Sioux are Immigrants from Colombia (24.3%, a difference of 0.050%), Panamanian (24.4%, a difference of 0.20%), Immigrants from Kenya (24.4%, a difference of 0.26%), Alaska Native (24.4%, a difference of 0.43%), and Soviet Union (24.2%, a difference of 0.45%).
| Demographics | Rating | Rank | Wage/Income Gap |
| Sudanese | 98.6 /100 | #106 | Exceptional 24.0% |
| Yaqui | 98.4 /100 | #107 | Exceptional 24.0% |
| Immigrants | Albania | 98.4 /100 | #108 | Exceptional 24.0% |
| Ugandans | 98.3 /100 | #109 | Exceptional 24.1% |
| Immigrants | Morocco | 98.1 /100 | #110 | Exceptional 24.1% |
| Soviet Union | 97.6 /100 | #111 | Exceptional 24.2% |
| Immigrants | Colombia | 97.0 /100 | #112 | Exceptional 24.3% |
| Sioux | 96.9 /100 | #113 | Exceptional 24.3% |
| Panamanians | 96.5 /100 | #114 | Exceptional 24.4% |
| Immigrants | Kenya | 96.4 /100 | #115 | Exceptional 24.4% |
| Alaska Natives | 96.0 /100 | #116 | Exceptional 24.4% |
| Immigrants | Afghanistan | 95.9 /100 | #117 | Exceptional 24.4% |
| Immigrants | Micronesia | 95.8 /100 | #118 | Exceptional 24.4% |
| Kenyans | 95.8 /100 | #119 | Exceptional 24.5% |
| Cree | 95.6 /100 | #120 | Exceptional 24.5% |
Demographics Similar to Immigrants from Western Europe by Wage/Income Gap
In terms of wage/income gap, the demographic groups most similar to Immigrants from Western Europe are Ute (27.8%, a difference of 0.080%), Potawatomi (27.7%, a difference of 0.12%), New Zealander (27.7%, a difference of 0.13%), Immigrants from Korea (27.8%, a difference of 0.15%), and Turkish (27.7%, a difference of 0.21%).
| Demographics | Rating | Rank | Wage/Income Gap |
| Syrians | 1.4 /100 | #263 | Tragic 27.6% |
| Immigrants | Switzerland | 1.0 /100 | #264 | Tragic 27.7% |
| Serbians | 1.0 /100 | #265 | Tragic 27.7% |
| Hmong | 1.0 /100 | #266 | Tragic 27.7% |
| Turks | 1.0 /100 | #267 | Tragic 27.7% |
| New Zealanders | 1.0 /100 | #268 | Tragic 27.7% |
| Potawatomi | 0.9 /100 | #269 | Tragic 27.7% |
| Immigrants | Western Europe | 0.9 /100 | #270 | Tragic 27.8% |
| Ute | 0.8 /100 | #271 | Tragic 27.8% |
| Immigrants | Korea | 0.8 /100 | #272 | Tragic 27.8% |
| Bulgarians | 0.7 /100 | #273 | Tragic 27.8% |
| Americans | 0.7 /100 | #274 | Tragic 27.8% |
| Immigrants | Japan | 0.7 /100 | #275 | Tragic 27.9% |
| Lebanese | 0.7 /100 | #276 | Tragic 27.9% |
| Latvians | 0.7 /100 | #277 | Tragic 27.9% |