Indian (Asian) vs Immigrants from Croatia Wage/Income Gap
COMPARE
Indian (Asian)
Immigrants from Croatia
Wage/Income Gap
Wage/Income Gap Comparison
Indians (Asian)
Immigrants from Croatia
26.4%
WAGE/INCOME GAP
16.5/ 100
METRIC RATING
206th/ 347
METRIC RANK
26.2%
WAGE/INCOME GAP
24.8/ 100
METRIC RATING
190th/ 347
METRIC RANK
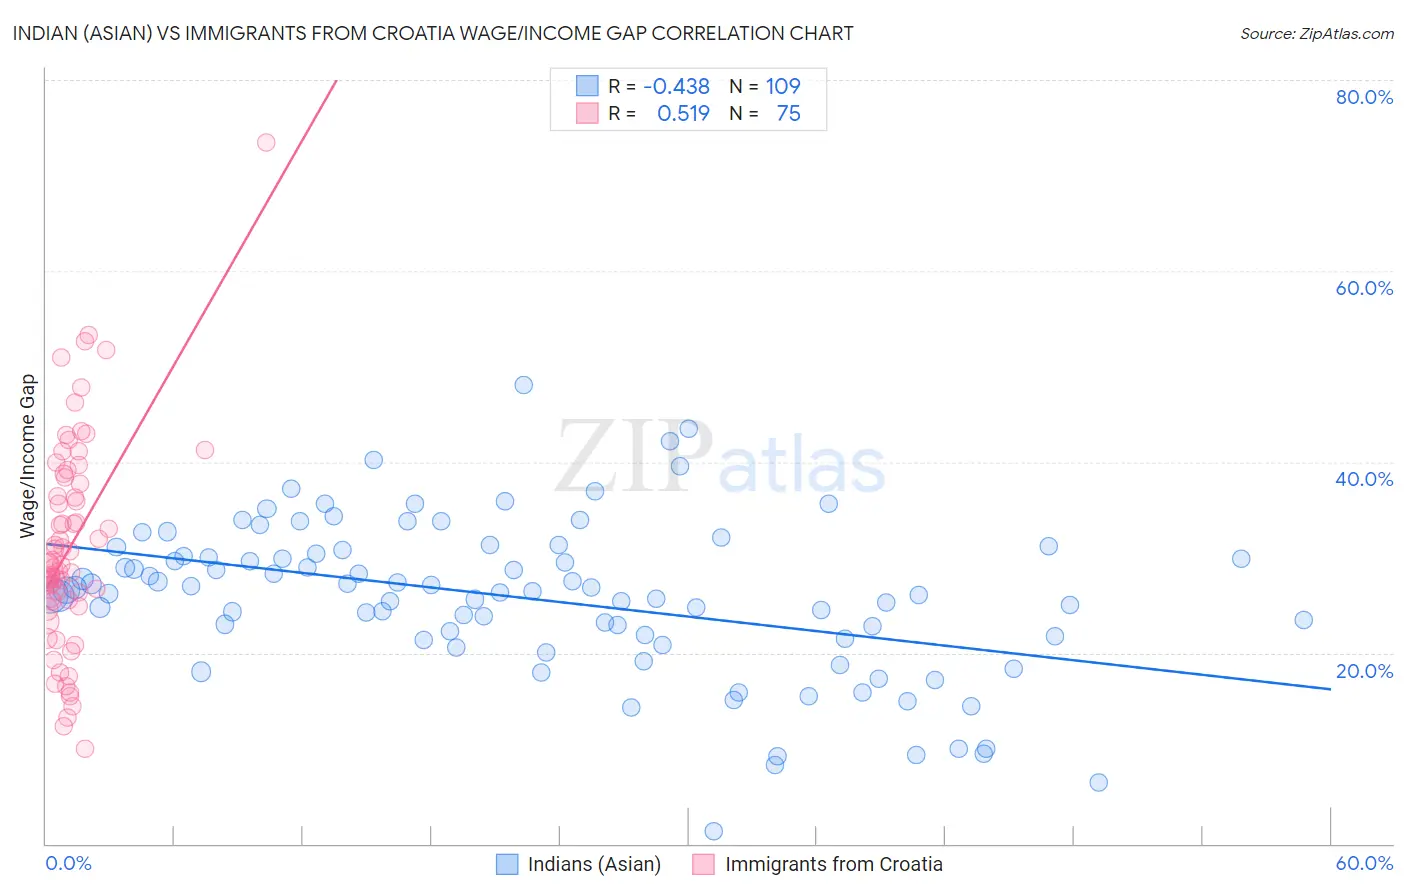
Indian (Asian) vs Immigrants from Croatia Wage/Income Gap Correlation Chart
The statistical analysis conducted on geographies consisting of 494,711,771 people shows a moderate negative correlation between the proportion of Indians (Asian) and wage/income gap percentage in the United States with a correlation coefficient (R) of -0.438 and weighted average of 26.4%. Similarly, the statistical analysis conducted on geographies consisting of 132,560,364 people shows a substantial positive correlation between the proportion of Immigrants from Croatia and wage/income gap percentage in the United States with a correlation coefficient (R) of 0.519 and weighted average of 26.2%, a difference of 0.82%.
Wage/Income Gap Correlation Summary
| Measurement | Indian (Asian) | Immigrants from Croatia |
| Minimum | 1.2% | 10.0% |
| Maximum | 48.1% | 73.5% |
| Range | 46.8% | 63.5% |
| Mean | 25.8% | 31.2% |
| Median | 26.4% | 29.4% |
| Interquartile 25% (IQ1) | 21.6% | 25.4% |
| Interquartile 75% (IQ3) | 30.6% | 38.4% |
| Interquartile Range (IQR) | 9.0% | 13.0% |
| Standard Deviation (Sample) | 8.2% | 11.1% |
| Standard Deviation (Population) | 8.1% | 11.0% |
Demographics Similar to Indians (Asian) and Immigrants from Croatia by Wage/Income Gap
In terms of wage/income gap, the demographic groups most similar to Indians (Asian) are Immigrants from Italy (26.5%, a difference of 0.080%), Immigrants from Southern Europe (26.4%, a difference of 0.090%), Immigrants from Russia (26.4%, a difference of 0.27%), Laotian (26.4%, a difference of 0.29%), and Immigrants from Eastern Europe (26.4%, a difference of 0.29%). Similarly, the demographic groups most similar to Immigrants from Croatia are Immigrants from Venezuela (26.2%, a difference of 0.020%), Immigrants from Moldova (26.2%, a difference of 0.15%), Immigrants from Bulgaria (26.3%, a difference of 0.20%), Immigrants from Jordan (26.3%, a difference of 0.22%), and Chilean (26.3%, a difference of 0.22%).
| Demographics | Rating | Rank | Wage/Income Gap |
| Immigrants | Egypt | 29.9 /100 | #188 | Fair 26.1% |
| Immigrants | Moldova | 26.6 /100 | #189 | Fair 26.2% |
| Immigrants | Croatia | 24.8 /100 | #190 | Fair 26.2% |
| Immigrants | Venezuela | 24.7 /100 | #191 | Fair 26.2% |
| Immigrants | Bulgaria | 22.5 /100 | #192 | Fair 26.3% |
| Immigrants | Jordan | 22.4 /100 | #193 | Fair 26.3% |
| Chileans | 22.3 /100 | #194 | Fair 26.3% |
| Immigrants | Malaysia | 22.2 /100 | #195 | Fair 26.3% |
| Immigrants | Western Asia | 21.7 /100 | #196 | Fair 26.3% |
| Zimbabweans | 21.6 /100 | #197 | Fair 26.3% |
| Venezuelans | 21.5 /100 | #198 | Fair 26.3% |
| Dutch West Indians | 21.0 /100 | #199 | Fair 26.3% |
| Delaware | 20.9 /100 | #200 | Fair 26.3% |
| Immigrants | Syria | 19.3 /100 | #201 | Poor 26.4% |
| Laotians | 19.2 /100 | #202 | Poor 26.4% |
| Immigrants | Eastern Europe | 19.2 /100 | #203 | Poor 26.4% |
| Immigrants | Russia | 19.0 /100 | #204 | Poor 26.4% |
| Immigrants | Southern Europe | 17.3 /100 | #205 | Poor 26.4% |
| Indians (Asian) | 16.5 /100 | #206 | Poor 26.4% |
| Immigrants | Italy | 15.8 /100 | #207 | Poor 26.5% |
| Egyptians | 12.7 /100 | #208 | Poor 26.6% |