Immigrants from Southern Europe Disability Age 5 to 17

COMPARE

Immigrants from Southern Europe
Race
Ancestry
AfghanAfricanAlaska NativeAlaskan AthabascanAlbanianAleutAlsatianAmericanApacheArabArapahoArgentineanArmenianAssyrian/Chaldean/SyriacAustralianAustrianBahamianBangladeshiBarbadianBasqueBelgianBelizeanBermudanBhutaneseBlackfeetBolivianBrazilianBritishBritish West IndianBulgarianBurmeseCajunCambodianCanadianCape VerdeanCarpatho RusynCelticCentral AmericanCentral American IndianCherokeeCheyenneChickasawChileanChineseChippewaChoctawColombianColvilleComancheCosta RicanCreeCreekCroatianCrowCubanCypriotCzechCzechoslovakianDanishDelawareDominicanDutchDutch West IndianEastern EuropeanEcuadorianEgyptianEnglishEstonianEthiopianEuropeanFijianFilipinoFinnishFrenchFrench American IndianFrench CanadianGermanGerman RussianGhanaianGreekGuamanian/ChamorroGuatemalanGuyaneseHaitianHmongHonduranHopiHoumaHungarianIcelanderIndian (Asian)IndonesianInupiatIranianIraqiIrishIroquoisIsraeliItalianJamaicanJapaneseJordanianKenyanKiowaKoreanLaotianLatvianLebaneseLiberianLithuanianLumbeeLuxembourgerMacedonianMalaysianMalteseMarshalleseMenomineeMexicanMexican American IndianMongolianMoroccanNative HawaiianNavajoNepaleseNew ZealanderNicaraguanNigerianNorthern EuropeanNorwegianOkinawanOsageOttawaPaiutePakistaniPalestinianPanamanianParaguayanPennsylvania GermanPeruvianPimaPolishPortuguesePotawatomiPuebloPuerto RicanPuget Sound SalishRomanianRussianSalvadoranSamoanScandinavianScotch-IrishScottishSeminoleSenegaleseSerbianShoshoneSierra LeoneanSiouxSlavicSlovakSloveneSomaliSouth AfricanSouth AmericanSouth American IndianSoviet UnionSpaniardSpanishSpanish AmericanSpanish American IndianSri LankanSubsaharan AfricanSudaneseSwedishSwissSyrianTaiwaneseThaiTlingit-HaidaTohono O'OdhamTonganTrinidadian and TobagonianTsimshianTurkishU.S. Virgin IslanderUgandanUkrainianUruguayanUteVenezuelanVietnameseWelshWest IndianYakamaYaquiYugoslavianYumanYup'ikZimbabwean
Immigration
NonimmigrantsImmigrantsAfghanistanAfricaAlbaniaArgentinaArmeniaAsiaAustraliaAustriaBahamasBangladeshBarbadosBelarusBelgiumBelizeBoliviaBosnia and HerzegovinaBrazilBulgariaBurma/MyanmarCabo VerdeCambodiaCameroonCanadaCaribbeanCentral AmericaChileChinaColombiaCongoCosta RicaCroatiaCubaCzechoslovakiaDenmarkDominicaDominican RepublicEastern AfricaEastern AsiaEastern EuropeEcuadorEgyptEl SalvadorEnglandEritreaEthiopiaEuropeFijiFranceGermanyGhanaGreeceGrenadaGuatemalaGuyanaHaitiHondurasHong KongHungaryIndiaIndonesiaIranIraqIrelandIsraelItalyJamaicaJapanJordanKazakhstanKenyaKoreaKuwaitLaosLatin AmericaLatviaLebanonLiberiaLithuaniaMalaysiaMexicoMicronesiaMiddle AfricaMoldovaMoroccoNepalNetherlandsNicaraguaNigeriaNorth AmericaNorth MacedoniaNorthern AfricaNorthern EuropeNorwayOceaniaPakistanPanamaPeruPhilippinesPolandPortugalRomaniaRussiaSaudi ArabiaScotlandSenegalSerbiaSierra LeoneSingaporeSomaliaSouth AfricaSouth AmericaSouth Central AsiaSouth Eastern AsiaSouthern EuropeSpainSri LankaSt. Vincent and the GrenadinesSudanSwedenSwitzerlandSyriaTaiwanThailandTrinidad and TobagoTurkeyUgandaUkraineUruguayUzbekistanVenezuelaVietnamWest IndiesWestern AfricaWestern AsiaWestern EuropeYemenZaireZimbabweAzores
Select to Compare
Race
Ancestry
AfghanAfricanAlaska NativeAlaskan AthabascanAlbanianAleutAlsatianAmericanApacheArabArapahoArgentineanArmenianAssyrian/Chaldean/SyriacAustralianAustrianBahamianBangladeshiBarbadianBasqueBelgianBelizeanBermudanBhutaneseBlackfeetBolivianBrazilianBritishBritish West IndianBulgarianBurmeseCajunCambodianCanadianCape VerdeanCarpatho RusynCelticCentral AmericanCentral American IndianCherokeeCheyenneChickasawChileanChineseChippewaChoctawColombianColvilleComancheCosta RicanCreeCreekCroatianCrowCubanCypriotCzechCzechoslovakianDanishDelawareDominicanDutchDutch West IndianEastern EuropeanEcuadorianEgyptianEnglishEstonianEthiopianEuropeanFijianFilipinoFinnishFrenchFrench American IndianFrench CanadianGermanGerman RussianGhanaianGreekGuamanian/ChamorroGuatemalanGuyaneseHaitianHmongHonduranHopiHoumaHungarianIcelanderIndian (Asian)IndonesianInupiatIranianIraqiIrishIroquoisIsraeliItalianJamaicanJapaneseJordanianKenyanKiowaKoreanLaotianLatvianLebaneseLiberianLithuanianLumbeeLuxembourgerMacedonianMalaysianMalteseMarshalleseMenomineeMexicanMexican American IndianMongolianMoroccanNative HawaiianNavajoNepaleseNew ZealanderNicaraguanNigerianNorthern EuropeanNorwegianOkinawanOsageOttawaPaiutePakistaniPalestinianPanamanianParaguayanPennsylvania GermanPeruvianPimaPolishPortuguesePotawatomiPuebloPuerto RicanPuget Sound SalishRomanianRussianSalvadoranSamoanScandinavianScotch-IrishScottishSeminoleSenegaleseSerbianShoshoneSierra LeoneanSiouxSlavicSlovakSloveneSomaliSouth AfricanSouth AmericanSouth American IndianSoviet UnionSpaniardSpanishSpanish AmericanSpanish American IndianSri LankanSubsaharan AfricanSudaneseSwedishSwissSyrianTaiwaneseThaiTlingit-HaidaTohono O'OdhamTonganTrinidadian and TobagonianTsimshianTurkishU.S. Virgin IslanderUgandanUkrainianUruguayanUteVenezuelanVietnameseWelshWest IndianYakamaYaquiYugoslavianYumanYup'ikZimbabwean
Immigration
NonimmigrantsImmigrantsAfghanistanAfricaAlbaniaArgentinaArmeniaAsiaAustraliaAustriaBahamasBangladeshBarbadosBelarusBelgiumBelizeBoliviaBosnia and HerzegovinaBrazilBulgariaBurma/MyanmarCabo VerdeCambodiaCameroonCanadaCaribbeanCentral AmericaChileChinaColombiaCongoCosta RicaCroatiaCubaCzechoslovakiaDenmarkDominicaDominican RepublicEastern AfricaEastern AsiaEastern EuropeEcuadorEgyptEl SalvadorEnglandEritreaEthiopiaEuropeFijiFranceGermanyGhanaGreeceGrenadaGuatemalaGuyanaHaitiHondurasHong KongHungaryIndiaIndonesiaIranIraqIrelandIsraelItalyJamaicaJapanJordanKazakhstanKenyaKoreaKuwaitLaosLatin AmericaLatviaLebanonLiberiaLithuaniaMalaysiaMexicoMicronesiaMiddle AfricaMoldovaMoroccoNepalNetherlandsNicaraguaNigeriaNorth AmericaNorth MacedoniaNorthern AfricaNorthern EuropeNorwayOceaniaPakistanPanamaPeruPhilippinesPolandPortugalRomaniaRussiaSaudi ArabiaScotlandSenegalSerbiaSierra LeoneSingaporeSomaliaSouth AfricaSouth AmericaSouth Central AsiaSouth Eastern AsiaSpainSri LankaSt. Vincent and the GrenadinesSudanSwedenSwitzerlandSyriaTaiwanThailandTrinidad and TobagoTurkeyUgandaUkraineUruguayUzbekistanVenezuelaVietnamWest IndiesWestern AfricaWestern AsiaWestern EuropeYemenZaireZimbabweAzores
Disability Age 5 to 17
Income
Poverty
Unemployment
Labor Participation
Family Structure
Vehicle Availability
Education Level
Disability

Immigrants from Southern Europe Disability Age 5 to 17
Good

5.6%
DISABILITY | AGE 5 TO 17
64.0/ 100
METRIC RATING
163rd/ 347
METRIC RANK

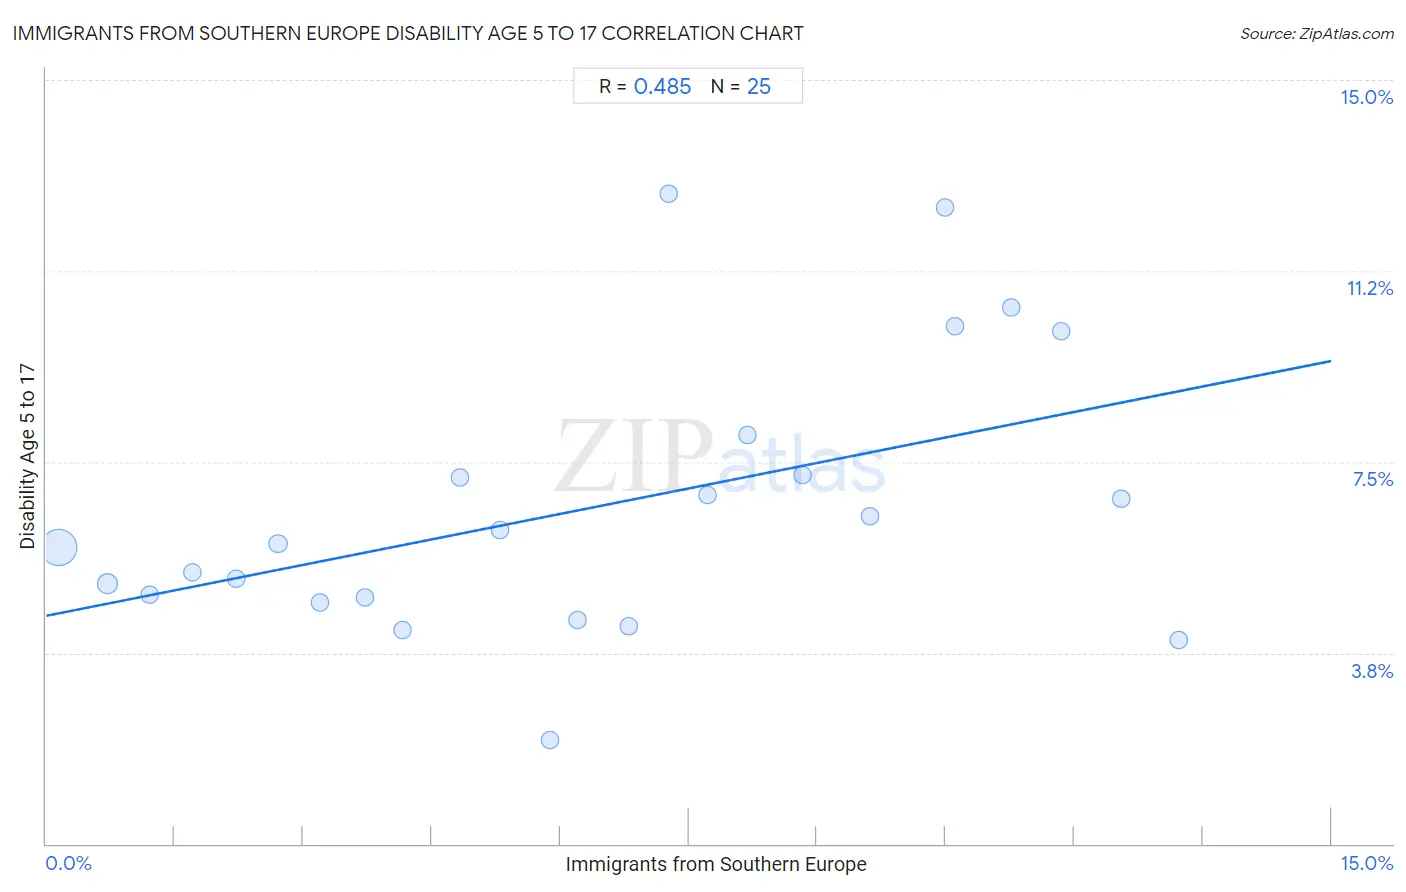
Immigrants from Southern Europe Disability Age 5 to 17 Correlation Chart

The statistical analysis conducted on geographies consisting of 398,595,383 people shows a moderate positive correlation between the proportion of Immigrants from Southern Europe and percentage of population with a disability between the ages 5 and 17 in the United States with a correlation coefficient (R) of 0.485 and weighted average of 5.6%. On average, for every 1% (one percent) increase in Immigrants from Southern Europe within a typical geography, there is an increase of 0.33% in percentage of population with a disability between the ages 5 and 17.
Immigrants from Southern Europe Disability Age 5 to 17
It is essential to understand that the correlation between the percentage of Immigrants from Southern Europe and percentage of population with a disability between the ages 5 and 17 does not imply a direct cause-and-effect relationship. It remains uncertain whether the presence of Immigrants from Southern Europe influences an upward or downward trend in the level of percentage of population with a disability between the ages 5 and 17 within an area, or if Immigrants from Southern Europe simply ended up residing in those areas with higher or lower levels of percentage of population with a disability between the ages 5 and 17 due to other factors.

Demographics Similar to Immigrants from Southern Europe by Disability Age 5 to 17

In terms of disability age 5 to 17, the demographic groups most similar to Immigrants from Southern Europe are Immigrants from Scotland (5.6%, a difference of 0.11%), Lebanese (5.6%, a difference of 0.14%), Zimbabwean (5.5%, a difference of 0.18%), Greek (5.6%, a difference of 0.18%), and Immigrants from Burma/Myanmar (5.6%, a difference of 0.25%).
DemographicsRating | RankDisability Age 5 to 17
Hawaiians
78.0
/100
|
#156
Good
5.5%
Immigrants from Costa Rica
77.9
/100
|
#157
Good
5.5%
Immigrants from Nepal
77.1
/100
|
#158
Good
5.5%
Immigrants from Zimbabwe
75.3
/100
|
#159
Good
5.5%
South Africans
73.3
/100
|
#160
Good
5.5%
Immigrants from Saudi Arabia
69.1
/100
|
#161
Good
5.5%
Zimbabweans
67.2
/100
|
#162
Good
5.5%
Immigrants from Southern Europe
64.0
/100
|
#163
Good
5.6%
Immigrants from Scotland
61.9
/100
|
#164
Good
5.6%
Lebanese
61.4
/100
|
#165
Good
5.6%
Greeks
60.6
/100
|
#166
Good
5.6%
Immigrants from Burma/Myanmar
59.3
/100
|
#167
Average
5.6%
Iraqis
56.0
/100
|
#168
Average
5.6%
Immigrants from Norway
55.7
/100
|
#169
Average
5.6%
Serbians
54.0
/100
|
#170
Average
5.6%

Immigrants from Southern Europe Disability Age 5 to 17 Correlation Summary

MeasurementImmigrants from Southern Europe DataDisability Age 5 to 17 Data
Minimum0.15%2.0%
Maximum13.2%12.8%
Range13.1%10.7%
Mean6.4%6.6%
Median6.2%5.9%
Interquartile 25% (IQ1)3.0%4.8%
Interquartile 75% (IQ3)10.1%7.6%
Interquartile Range (IQR)7.1%2.8%
Standard Deviation (Sample)3.9%2.7%
Standard Deviation (Population)3.9%2.7%

Correlation Details

Immigrants from Southern Europe PercentileSample SizeDisability Age 5 to 17
[
0.0%
-
0.5%
]
0.15%
331,047,4945.8%
[
0.5%
-
1.0%
]
0.71%
45,030,2915.1%
[
1.0%
-
1.5%
]
1.21%
11,545,8694.9%
[
1.5%
-
2.0%
]
1.70%
4,477,5825.3%
[
2.0%
-
2.5%
]
2.22%
1,749,6045.2%
[
2.5%
-
3.0%
]
2.71%
1,659,1795.9%
[
3.0%
-
3.5%
]
3.20%
877,7234.7%
[
3.5%
-
4.0%
]
3.72%
552,0084.8%
[
4.0%
-
4.5%
]
4.16%
239,3574.2%
[
4.5%
-
5.0%
]
4.83%
272,5597.2%
[
5.0%
-
5.5%
]
5.30%
198,1786.2%
[
5.5%
-
6.0%
]
5.88%
86,6352.0%
[
6.0%
-
6.5%
]
6.20%
87,6064.4%
[
6.5%
-
7.0%
]
6.81%
95,5714.3%
[
7.0%
-
7.5%
]
7.27%
14,36712.8%
[
7.5%
-
8.0%
]
7.72%
215,6386.9%
[
8.0%
-
8.5%
]
8.19%
84,7658.0%
[
8.5%
-
9.0%
]
8.82%
49,5957.2%
[
9.5%
-
10.0%
]
9.61%
43,5296.4%
[
10.0%
-
10.5%
]
10.50%
56,69612.5%
[
10.5%
-
11.0%
]
10.61%
12,46510.2%
[
11.0%
-
11.5%
]
11.27%
124,19610.5%
[
11.5%
-
12.0%
]
11.85%
25,92710.1%
[
12.5%
-
13.0%
]
12.55%
26,8076.8%
[
13.0%
-
13.5%
]
13.22%
21,7424.0%