Immigrants from Southern Europe 1 or more Vehicles in Household
COMPARE
Immigrants from Southern Europe
Select to Compare
1 or more Vehicles in Household
Immigrants from Southern Europe 1 or more Vehicles in Household
87.1%
1+ VEHICLES AVAILABLE
0.1/ 100
METRIC RATING
278th/ 347
METRIC RANK
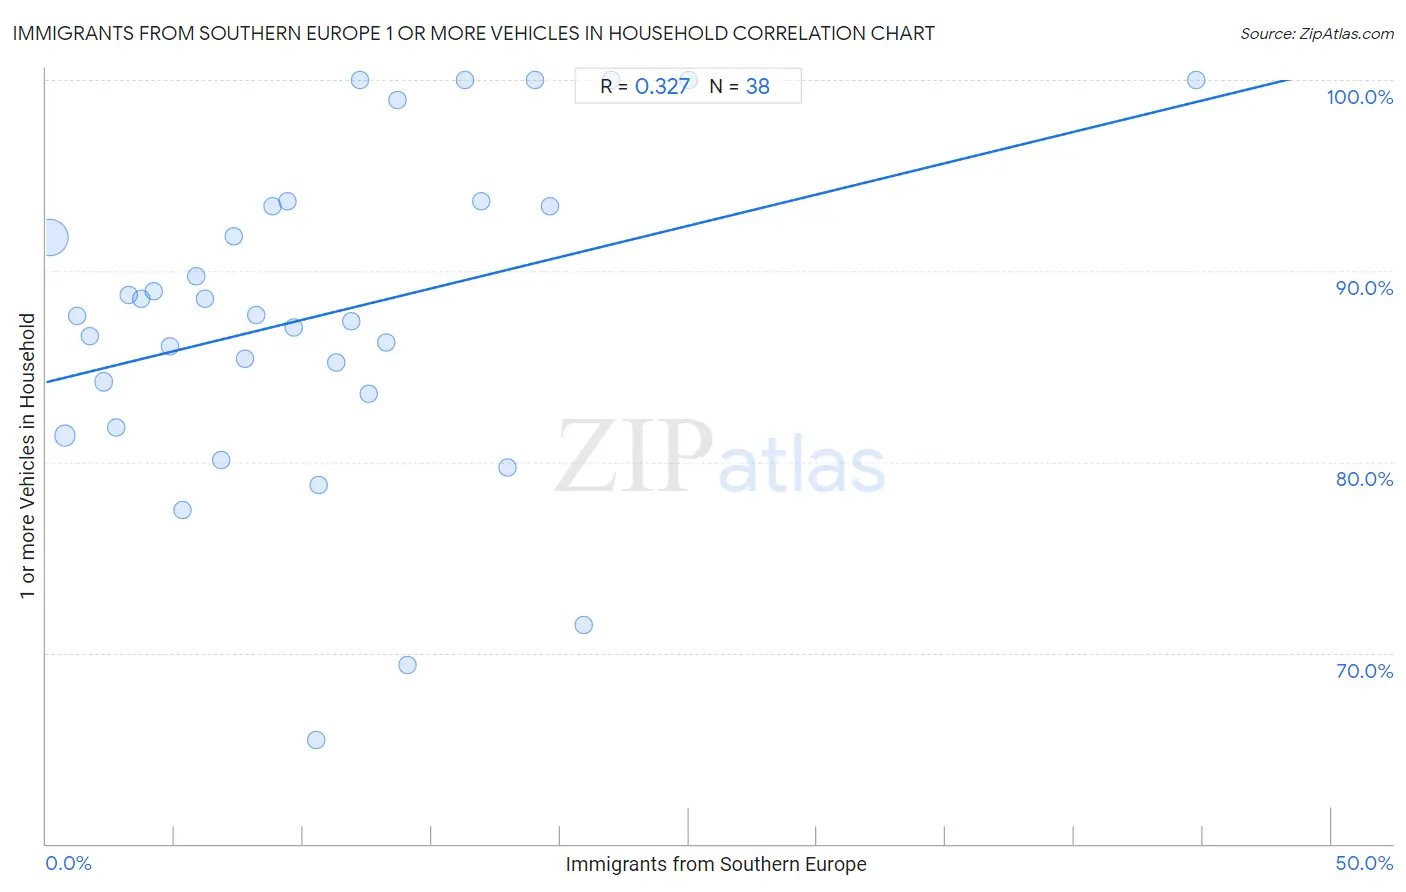
Immigrants from Southern Europe 1 or more Vehicles in Household Correlation Chart
The statistical analysis conducted on geographies consisting of 402,667,102 people shows a mild positive correlation between the proportion of Immigrants from Southern Europe and percentage of households with 1 or more vehicles available in the United States with a correlation coefficient (R) of 0.327 and weighted average of 87.1%. On average, for every 1% (one percent) increase in Immigrants from Southern Europe within a typical geography, there is an increase of 0.33% in percentage of households with 1 or more vehicles available.
It is essential to understand that the correlation between the percentage of Immigrants from Southern Europe and percentage of households with 1 or more vehicles available does not imply a direct cause-and-effect relationship. It remains uncertain whether the presence of Immigrants from Southern Europe influences an upward or downward trend in the level of percentage of households with 1 or more vehicles available within an area, or if Immigrants from Southern Europe simply ended up residing in those areas with higher or lower levels of percentage of households with 1 or more vehicles available due to other factors.
Demographics Similar to Immigrants from Southern Europe by 1 or more Vehicles in Household
In terms of 1 or more vehicles in household, the demographic groups most similar to Immigrants from Southern Europe are Immigrants from Albania (87.1%, a difference of 0.0%), Immigrants from Croatia (87.0%, a difference of 0.030%), Alsatian (87.1%, a difference of 0.040%), Immigrants from France (87.1%, a difference of 0.10%), and Mongolian (87.0%, a difference of 0.10%).
| Demographics | Rating | Rank | 1 or more Vehicles in Household |
| Bermudans | 0.2 /100 | #271 | Tragic 87.5% |
| Aleuts | 0.2 /100 | #272 | Tragic 87.5% |
| Immigrants from Northern Africa | 0.2 /100 | #273 | Tragic 87.4% |
| Immigrants from Morocco | 0.1 /100 | #274 | Tragic 87.4% |
| Immigrants from Singapore | 0.1 /100 | #275 | Tragic 87.2% |
| Immigrants from France | 0.1 /100 | #276 | Tragic 87.1% |
| Alsatians | 0.1 /100 | #277 | Tragic 87.1% |
| Immigrants from Southern Europe | 0.1 /100 | #278 | Tragic 87.1% |
| Immigrants from Albania | 0.1 /100 | #279 | Tragic 87.1% |
| Immigrants from Croatia | 0.0 /100 | #280 | Tragic 87.0% |
| Mongolians | 0.0 /100 | #281 | Tragic 87.0% |
| Colville | 0.0 /100 | #282 | Tragic 86.8% |
| Immigrants from Eastern Europe | 0.0 /100 | #283 | Tragic 86.7% |
| Central American Indians | 0.0 /100 | #284 | Tragic 86.7% |
| Immigrants from Kazakhstan | 0.0 /100 | #285 | Tragic 86.6% |
Immigrants from Southern Europe 1 or more Vehicles in Household Correlation Summary
| Measurement | Immigrants from Southern Europe Data | 1 or more Vehicles in Household Data |
| Minimum | 0.15% | 65.4% |
| Maximum | 44.7% | 100.0% |
| Range | 44.6% | 34.6% |
| Mean | 10.8% | 87.7% |
| Median | 9.5% | 87.7% |
| Interquartile 25% (IQ1) | 4.8% | 83.6% |
| Interquartile 75% (IQ3) | 14.0% | 93.4% |
| Interquartile Range (IQR) | 9.2% | 9.8% |
| Standard Deviation (Sample) | 8.6% | 8.6% |
| Standard Deviation (Population) | 8.5% | 8.5% |
Correlation Details
| Immigrants from Southern Europe Percentile | Sample Size | 1 or more Vehicles in Household |
[ 0.0% - 0.5% ] 0.15% | 333,239,777 | 91.7% |
[ 0.5% - 1.0% ] 0.71% | 45,915,783 | 81.4% |
[ 1.0% - 1.5% ] 1.21% | 11,994,801 | 87.6% |
[ 1.5% - 2.0% ] 1.70% | 4,674,992 | 86.6% |
[ 2.0% - 2.5% ] 2.22% | 1,876,410 | 84.2% |
[ 2.5% - 3.0% ] 2.71% | 1,718,197 | 81.8% |
[ 3.0% - 3.5% ] 3.19% | 907,805 | 88.8% |
[ 3.5% - 4.0% ] 3.72% | 579,623 | 88.6% |
[ 4.0% - 4.5% ] 4.16% | 259,870 | 89.0% |
[ 4.5% - 5.0% ] 4.82% | 289,329 | 86.0% |
[ 5.0% - 5.5% ] 5.30% | 206,372 | 77.5% |
[ 5.5% - 6.0% ] 5.86% | 93,741 | 89.7% |
[ 6.0% - 6.5% ] 6.19% | 93,912 | 88.5% |
[ 6.5% - 7.0% ] 6.80% | 100,450 | 80.1% |
[ 7.0% - 7.5% ] 7.29% | 18,197 | 91.8% |
[ 7.5% - 8.0% ] 7.72% | 219,764 | 85.4% |
[ 8.0% - 8.5% ] 8.19% | 85,590 | 87.7% |
[ 8.5% - 9.0% ] 8.83% | 55,874 | 93.4% |
[ 9.0% - 9.5% ] 9.37% | 1,089 | 93.7% |
[ 9.5% - 10.0% ] 9.63% | 46,102 | 87.1% |
[ 10.0% - 10.5% ] 10.48% | 59,333 | 65.4% |
[ 10.5% - 11.0% ] 10.61% | 12,465 | 78.8% |
[ 11.0% - 11.5% ] 11.27% | 125,203 | 85.2% |
[ 11.5% - 12.0% ] 11.85% | 26,345 | 87.4% |
[ 12.0% - 12.5% ] 12.20% | 41 | 100.0% |
[ 12.5% - 13.0% ] 12.55% | 26,807 | 83.6% |
[ 13.0% - 13.5% ] 13.21% | 24,740 | 86.2% |
[ 13.5% - 14.0% ] 13.69% | 6,903 | 99.0% |
[ 14.0% - 14.5% ] 14.05% | 121 | 69.4% |
[ 16.0% - 16.5% ] 16.30% | 92 | 100.0% |
[ 16.5% - 17.0% ] 16.90% | 5,194 | 93.6% |
[ 17.5% - 18.0% ] 17.95% | 234 | 79.7% |
[ 19.0% - 19.5% ] 19.01% | 142 | 100.0% |
[ 19.5% - 20.0% ] 19.58% | 1,144 | 93.4% |
[ 20.5% - 21.0% ] 20.92% | 239 | 71.4% |
[ 21.5% - 22.0% ] 21.98% | 323 | 100.0% |
[ 25.0% - 25.5% ] 25.00% | 60 | 100.0% |
[ 44.5% - 45.0% ] 44.74% | 38 | 100.0% |