Immigrants from Southern Europe Self-Care Disability

COMPARE

Immigrants from Southern Europe
Race
Ancestry
AfghanAfricanAlaska NativeAlaskan AthabascanAlbanianAleutAlsatianAmericanApacheArabArapahoArgentineanArmenianAssyrian/Chaldean/SyriacAustralianAustrianBahamianBangladeshiBarbadianBasqueBelgianBelizeanBermudanBhutaneseBlackfeetBolivianBrazilianBritishBritish West IndianBulgarianBurmeseCajunCambodianCanadianCape VerdeanCarpatho RusynCelticCentral AmericanCentral American IndianCherokeeCheyenneChickasawChileanChineseChippewaChoctawColombianColvilleComancheCosta RicanCreeCreekCroatianCrowCubanCypriotCzechCzechoslovakianDanishDelawareDominicanDutchDutch West IndianEastern EuropeanEcuadorianEgyptianEnglishEstonianEthiopianEuropeanFijianFilipinoFinnishFrenchFrench American IndianFrench CanadianGermanGerman RussianGhanaianGreekGuamanian/ChamorroGuatemalanGuyaneseHaitianHmongHonduranHopiHoumaHungarianIcelanderIndian (Asian)IndonesianInupiatIranianIraqiIrishIroquoisIsraeliItalianJamaicanJapaneseJordanianKenyanKiowaKoreanLaotianLatvianLebaneseLiberianLithuanianLumbeeLuxembourgerMacedonianMalaysianMalteseMarshalleseMenomineeMexicanMexican American IndianMongolianMoroccanNative HawaiianNavajoNepaleseNew ZealanderNicaraguanNigerianNorthern EuropeanNorwegianOkinawanOsageOttawaPaiutePakistaniPalestinianPanamanianParaguayanPennsylvania GermanPeruvianPimaPolishPortuguesePotawatomiPuebloPuerto RicanPuget Sound SalishRomanianRussianSalvadoranSamoanScandinavianScotch-IrishScottishSeminoleSenegaleseSerbianShoshoneSierra LeoneanSiouxSlavicSlovakSloveneSomaliSouth AfricanSouth AmericanSouth American IndianSoviet UnionSpaniardSpanishSpanish AmericanSpanish American IndianSri LankanSubsaharan AfricanSudaneseSwedishSwissSyrianTaiwaneseThaiTlingit-HaidaTohono O'OdhamTonganTrinidadian and TobagonianTsimshianTurkishU.S. Virgin IslanderUgandanUkrainianUruguayanUteVenezuelanVietnameseWelshWest IndianYakamaYaquiYugoslavianYumanYup'ikZimbabwean
Immigration
NonimmigrantsImmigrantsAfghanistanAfricaAlbaniaArgentinaArmeniaAsiaAustraliaAustriaBahamasBangladeshBarbadosBelarusBelgiumBelizeBoliviaBosnia and HerzegovinaBrazilBulgariaBurma/MyanmarCabo VerdeCambodiaCameroonCanadaCaribbeanCentral AmericaChileChinaColombiaCongoCosta RicaCroatiaCubaCzechoslovakiaDenmarkDominicaDominican RepublicEastern AfricaEastern AsiaEastern EuropeEcuadorEgyptEl SalvadorEnglandEritreaEthiopiaEuropeFijiFranceGermanyGhanaGreeceGrenadaGuatemalaGuyanaHaitiHondurasHong KongHungaryIndiaIndonesiaIranIraqIrelandIsraelItalyJamaicaJapanJordanKazakhstanKenyaKoreaKuwaitLaosLatin AmericaLatviaLebanonLiberiaLithuaniaMalaysiaMexicoMicronesiaMiddle AfricaMoldovaMoroccoNepalNetherlandsNicaraguaNigeriaNorth AmericaNorth MacedoniaNorthern AfricaNorthern EuropeNorwayOceaniaPakistanPanamaPeruPhilippinesPolandPortugalRomaniaRussiaSaudi ArabiaScotlandSenegalSerbiaSierra LeoneSingaporeSomaliaSouth AfricaSouth AmericaSouth Central AsiaSouth Eastern AsiaSouthern EuropeSpainSri LankaSt. Vincent and the GrenadinesSudanSwedenSwitzerlandSyriaTaiwanThailandTrinidad and TobagoTurkeyUgandaUkraineUruguayUzbekistanVenezuelaVietnamWest IndiesWestern AfricaWestern AsiaWestern EuropeYemenZaireZimbabweAzores
Select to Compare
Race
Ancestry
AfghanAfricanAlaska NativeAlaskan AthabascanAlbanianAleutAlsatianAmericanApacheArabArapahoArgentineanArmenianAssyrian/Chaldean/SyriacAustralianAustrianBahamianBangladeshiBarbadianBasqueBelgianBelizeanBermudanBhutaneseBlackfeetBolivianBrazilianBritishBritish West IndianBulgarianBurmeseCajunCambodianCanadianCape VerdeanCarpatho RusynCelticCentral AmericanCentral American IndianCherokeeCheyenneChickasawChileanChineseChippewaChoctawColombianColvilleComancheCosta RicanCreeCreekCroatianCrowCubanCypriotCzechCzechoslovakianDanishDelawareDominicanDutchDutch West IndianEastern EuropeanEcuadorianEgyptianEnglishEstonianEthiopianEuropeanFijianFilipinoFinnishFrenchFrench American IndianFrench CanadianGermanGerman RussianGhanaianGreekGuamanian/ChamorroGuatemalanGuyaneseHaitianHmongHonduranHopiHoumaHungarianIcelanderIndian (Asian)IndonesianInupiatIranianIraqiIrishIroquoisIsraeliItalianJamaicanJapaneseJordanianKenyanKiowaKoreanLaotianLatvianLebaneseLiberianLithuanianLumbeeLuxembourgerMacedonianMalaysianMalteseMarshalleseMenomineeMexicanMexican American IndianMongolianMoroccanNative HawaiianNavajoNepaleseNew ZealanderNicaraguanNigerianNorthern EuropeanNorwegianOkinawanOsageOttawaPaiutePakistaniPalestinianPanamanianParaguayanPennsylvania GermanPeruvianPimaPolishPortuguesePotawatomiPuebloPuerto RicanPuget Sound SalishRomanianRussianSalvadoranSamoanScandinavianScotch-IrishScottishSeminoleSenegaleseSerbianShoshoneSierra LeoneanSiouxSlavicSlovakSloveneSomaliSouth AfricanSouth AmericanSouth American IndianSoviet UnionSpaniardSpanishSpanish AmericanSpanish American IndianSri LankanSubsaharan AfricanSudaneseSwedishSwissSyrianTaiwaneseThaiTlingit-HaidaTohono O'OdhamTonganTrinidadian and TobagonianTsimshianTurkishU.S. Virgin IslanderUgandanUkrainianUruguayanUteVenezuelanVietnameseWelshWest IndianYakamaYaquiYugoslavianYumanYup'ikZimbabwean
Immigration
NonimmigrantsImmigrantsAfghanistanAfricaAlbaniaArgentinaArmeniaAsiaAustraliaAustriaBahamasBangladeshBarbadosBelarusBelgiumBelizeBoliviaBosnia and HerzegovinaBrazilBulgariaBurma/MyanmarCabo VerdeCambodiaCameroonCanadaCaribbeanCentral AmericaChileChinaColombiaCongoCosta RicaCroatiaCubaCzechoslovakiaDenmarkDominicaDominican RepublicEastern AfricaEastern AsiaEastern EuropeEcuadorEgyptEl SalvadorEnglandEritreaEthiopiaEuropeFijiFranceGermanyGhanaGreeceGrenadaGuatemalaGuyanaHaitiHondurasHong KongHungaryIndiaIndonesiaIranIraqIrelandIsraelItalyJamaicaJapanJordanKazakhstanKenyaKoreaKuwaitLaosLatin AmericaLatviaLebanonLiberiaLithuaniaMalaysiaMexicoMicronesiaMiddle AfricaMoldovaMoroccoNepalNetherlandsNicaraguaNigeriaNorth AmericaNorth MacedoniaNorthern AfricaNorthern EuropeNorwayOceaniaPakistanPanamaPeruPhilippinesPolandPortugalRomaniaRussiaSaudi ArabiaScotlandSenegalSerbiaSierra LeoneSingaporeSomaliaSouth AfricaSouth AmericaSouth Central AsiaSouth Eastern AsiaSpainSri LankaSt. Vincent and the GrenadinesSudanSwedenSwitzerlandSyriaTaiwanThailandTrinidad and TobagoTurkeyUgandaUkraineUruguayUzbekistanVenezuelaVietnamWest IndiesWestern AfricaWestern AsiaWestern EuropeYemenZaireZimbabweAzores
Self-Care Disability
Income
Poverty
Unemployment
Labor Participation
Family Structure
Vehicle Availability
Education Level
Disability

Immigrants from Southern Europe Self-Care Disability
Poor

2.5%
SELF-CARE DISABILITY
15.6/ 100
METRIC RATING
195th/ 347
METRIC RANK

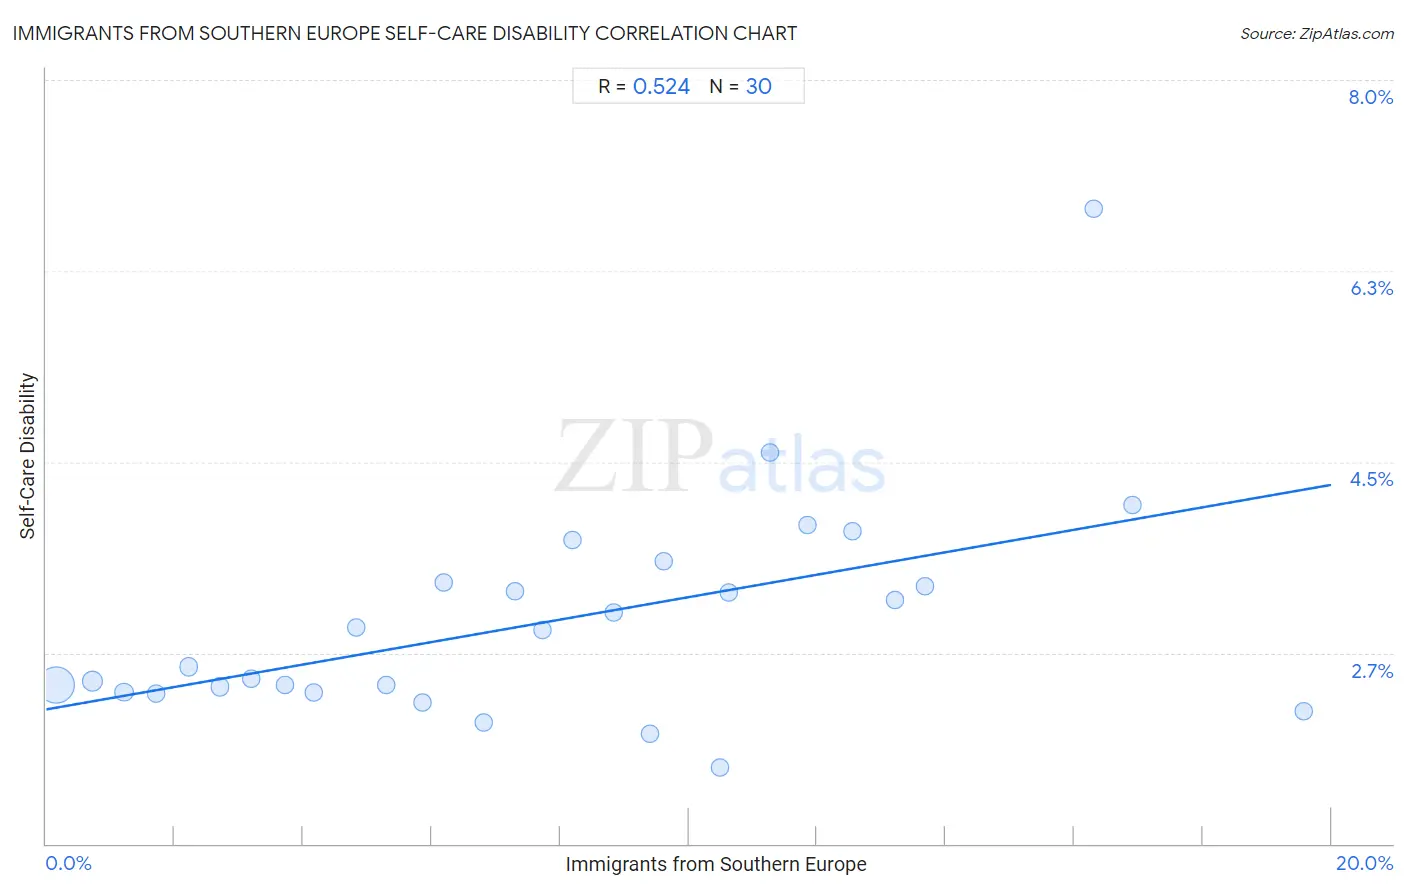
Immigrants from Southern Europe Self-Care Disability Correlation Chart

The statistical analysis conducted on geographies consisting of 402,329,644 people shows a substantial positive correlation between the proportion of Immigrants from Southern Europe and percentage of population with self-care disability in the United States with a correlation coefficient (R) of 0.524 and weighted average of 2.5%. On average, for every 1% (one percent) increase in Immigrants from Southern Europe within a typical geography, there is an increase of 0.10% in percentage of population with self-care disability.
Immigrants from Southern Europe Self-Care Disability
It is essential to understand that the correlation between the percentage of Immigrants from Southern Europe and percentage of population with self-care disability does not imply a direct cause-and-effect relationship. It remains uncertain whether the presence of Immigrants from Southern Europe influences an upward or downward trend in the level of percentage of population with self-care disability within an area, or if Immigrants from Southern Europe simply ended up residing in those areas with higher or lower levels of percentage of population with self-care disability due to other factors.

Demographics Similar to Immigrants from Southern Europe by Self-Care Disability

In terms of self-care disability, the demographic groups most similar to Immigrants from Southern Europe are Korean (2.5%, a difference of 0.010%), Crow (2.5%, a difference of 0.030%), Immigrants (2.5%, a difference of 0.060%), Immigrants from Ghana (2.5%, a difference of 0.080%), and Immigrants from Germany (2.5%, a difference of 0.19%).
DemographicsRating | RankSelf-Care Disability
Immigrants from Oceania
28.3
/100
|
#188
Fair
2.5%
Immigrants from Eastern Europe
28.0
/100
|
#189
Fair
2.5%
Sioux
24.6
/100
|
#190
Fair
2.5%
Moroccans
22.9
/100
|
#191
Fair
2.5%
Soviet Union
22.2
/100
|
#192
Fair
2.5%
Ukrainians
21.4
/100
|
#193
Fair
2.5%
Immigrants from Germany
17.9
/100
|
#194
Poor
2.5%
Immigrants from Southern Europe
15.6
/100
|
#195
Poor
2.5%
Koreans
15.5
/100
|
#196
Poor
2.5%
Crow
15.2
/100
|
#197
Poor
2.5%
Immigrants
15.0
/100
|
#198
Poor
2.5%
Immigrants from Ghana
14.7
/100
|
#199
Poor
2.5%
Immigrants from Western Africa
13.3
/100
|
#200
Poor
2.5%
Immigrants from South Eastern Asia
12.9
/100
|
#201
Poor
2.5%
Slovaks
12.6
/100
|
#202
Poor
2.5%

Immigrants from Southern Europe Self-Care Disability Correlation Summary

MeasurementImmigrants from Southern Europe DataSelf-Care Disability Data
Minimum0.15%1.7%
Maximum19.6%6.8%
Range19.4%5.1%
Mean7.9%3.0%
Median7.5%2.8%
Interquartile 25% (IQ1)3.7%2.4%
Interquartile 75% (IQ3)11.3%3.4%
Interquartile Range (IQR)7.5%1.00%
Standard Deviation (Sample)5.1%1.00%
Standard Deviation (Population)5.0%0.98%

Correlation Details

Immigrants from Southern Europe PercentileSample SizeSelf-Care Disability
[
0.0%
-
0.5%
]
0.15%
333,059,1532.5%
[
0.5%
-
1.0%
]
0.71%
45,849,5542.5%
[
1.0%
-
1.5%
]
1.21%
11,972,5342.4%
[
1.5%
-
2.0%
]
1.70%
4,657,2742.4%
[
2.0%
-
2.5%
]
2.21%
1,850,9502.6%
[
2.5%
-
3.0%
]
2.71%
1,714,3592.4%
[
3.0%
-
3.5%
]
3.19%
902,1082.5%
[
3.5%
-
4.0%
]
3.72%
574,1522.5%
[
4.0%
-
4.5%
]
4.16%
259,7742.4%
[
4.5%
-
5.0%
]
4.82%
286,3293.0%
[
5.0%
-
5.5%
]
5.30%
206,0182.5%
[
5.5%
-
6.0%
]
5.86%
92,6532.3%
[
6.0%
-
6.5%
]
6.19%
93,5513.4%
[
6.5%
-
7.0%
]
6.80%
99,9342.1%
[
7.0%
-
7.5%
]
7.29%
18,1973.3%
[
7.5%
-
8.0%
]
7.72%
219,5973.0%
[
8.0%
-
8.5%
]
8.19%
85,3923.8%
[
8.5%
-
9.0%
]
8.83%
55,1863.1%
[
9.0%
-
9.5%
]
9.40%
9572.0%
[
9.5%
-
10.0%
]
9.62%
44,8083.6%
[
10.0%
-
10.5%
]
10.49%
58,8631.7%
[
10.5%
-
11.0%
]
10.61%
12,4653.3%
[
11.0%
-
11.5%
]
11.27%
125,0604.6%
[
11.5%
-
12.0%
]
11.85%
26,3453.9%
[
12.5%
-
13.0%
]
12.55%
26,8073.9%
[
13.0%
-
13.5%
]
13.21%
24,7403.2%
[
13.5%
-
14.0%
]
13.68%
6,6143.4%
[
16.0%
-
16.5%
]
16.30%
926.8%
[
16.5%
-
17.0%
]
16.91%
5,0344.1%
[
19.5%
-
20.0%
]
19.58%
1,1442.2%