Immigrants from Southern Europe Married-couple Households
COMPARE
Immigrants from Southern Europe
Select to Compare
Married-couple Households
Immigrants from Southern Europe Married-couple Households
46.8%
MARRIED-COUPLE HOUSEHOLDS
69.9/ 100
METRIC RATING
165th/ 347
METRIC RANK
Immigrants from Southern Europe Married-couple Households Correlation Chart
The statistical analysis conducted on geographies consisting of 402,620,740 people shows a poor positive correlation between the proportion of Immigrants from Southern Europe and percentage of married-couple family households in the United States with a correlation coefficient (R) of 0.183 and weighted average of 46.8%. On average, for every 1% (one percent) increase in Immigrants from Southern Europe within a typical geography, there is an increase of 0.27% in percentage of married-couple family households.
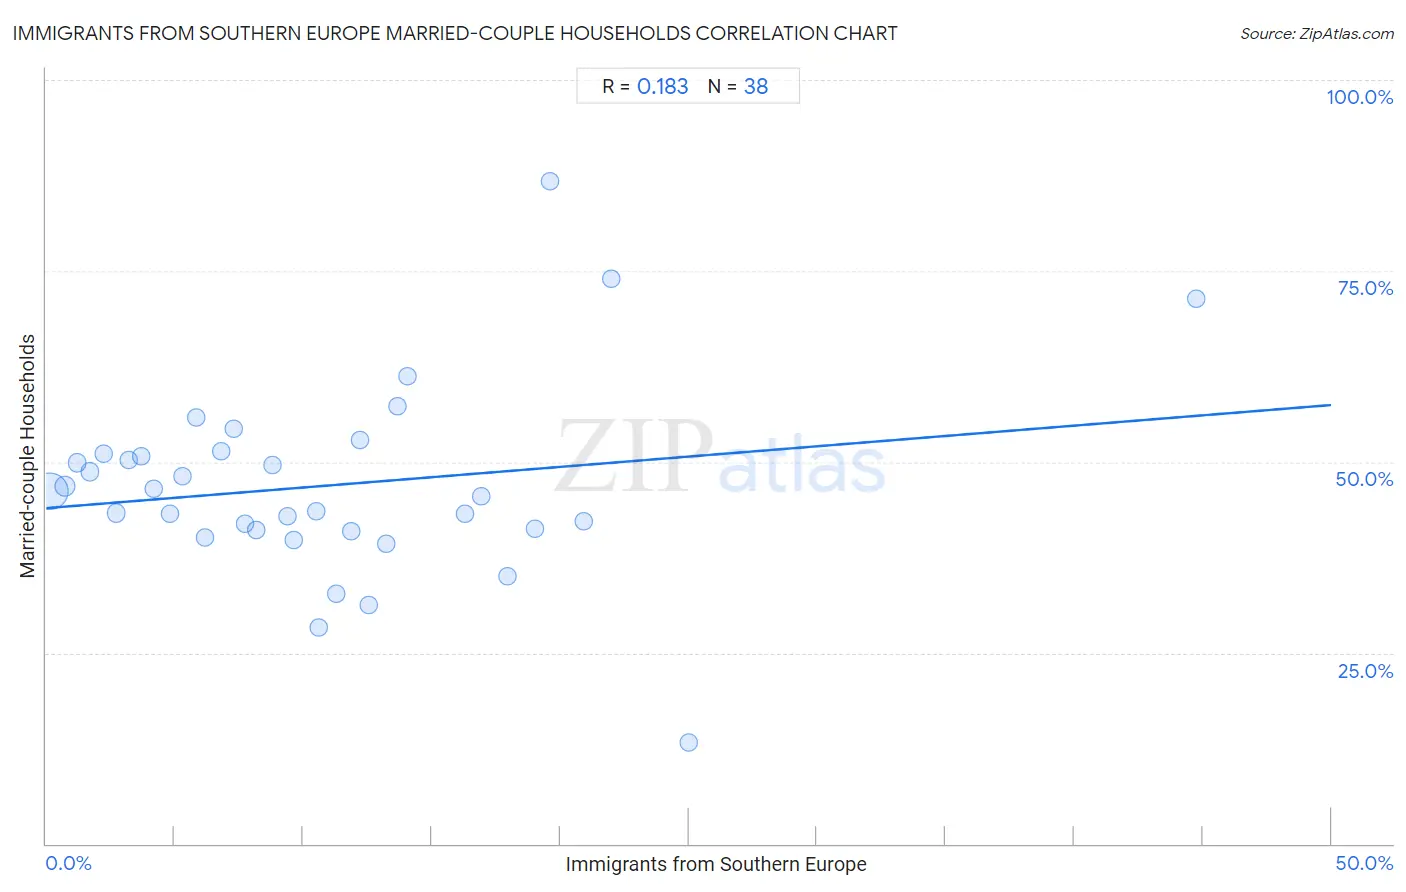
It is essential to understand that the correlation between the percentage of Immigrants from Southern Europe and percentage of married-couple family households does not imply a direct cause-and-effect relationship. It remains uncertain whether the presence of Immigrants from Southern Europe influences an upward or downward trend in the level of percentage of married-couple family households within an area, or if Immigrants from Southern Europe simply ended up residing in those areas with higher or lower levels of percentage of married-couple family households due to other factors.
Demographics Similar to Immigrants from Southern Europe by Married-couple Households
In terms of married-couple households, the demographic groups most similar to Immigrants from Southern Europe are Immigrants from Kazakhstan (46.8%, a difference of 0.0%), Immigrants from Turkey (46.8%, a difference of 0.010%), Colombian (46.8%, a difference of 0.050%), Delaware (46.8%, a difference of 0.060%), and Iraqi (46.9%, a difference of 0.080%).
| Demographics | Rating | Rank | Married-couple Households |
| Nonimmigrants | 73.3 /100 | #158 | Good 46.9% |
| Osage | 73.2 /100 | #159 | Good 46.9% |
| Iraqis | 71.7 /100 | #160 | Good 46.9% |
| Delaware | 71.2 /100 | #161 | Good 46.8% |
| Colombians | 71.0 /100 | #162 | Good 46.8% |
| Immigrants from Turkey | 70.2 /100 | #163 | Good 46.8% |
| Immigrants from Kazakhstan | 70.0 /100 | #164 | Good 46.8% |
| Immigrants from Southern Europe | 69.9 /100 | #165 | Good 46.8% |
| Cherokee | 65.7 /100 | #166 | Good 46.7% |
| Immigrants from Croatia | 64.2 /100 | #167 | Good 46.7% |
| Israelis | 62.3 /100 | #168 | Good 46.7% |
| Spanish American Indians | 59.4 /100 | #169 | Average 46.6% |
| South Americans | 58.0 /100 | #170 | Average 46.6% |
| Immigrants from Chile | 55.7 /100 | #171 | Average 46.5% |
| Immigrants from Australia | 54.6 /100 | #172 | Average 46.5% |
Immigrants from Southern Europe Married-couple Households Correlation Summary
| Measurement | Immigrants from Southern Europe Data | Married-couple Households Data |
| Minimum | 0.15% | 13.2% |
| Maximum | 44.7% | 86.8% |
| Range | 44.6% | 73.6% |
| Mean | 10.8% | 46.9% |
| Median | 9.5% | 45.8% |
| Interquartile 25% (IQ1) | 4.8% | 41.1% |
| Interquartile 75% (IQ3) | 14.0% | 51.1% |
| Interquartile Range (IQR) | 9.2% | 10.0% |
| Standard Deviation (Sample) | 8.6% | 12.7% |
| Standard Deviation (Population) | 8.5% | 12.5% |
Correlation Details
| Immigrants from Southern Europe Percentile | Sample Size | Married-couple Households |
[ 0.0% - 0.5% ] 0.15% | 333,203,348 | 46.1% |
[ 0.5% - 1.0% ] 0.71% | 45,906,209 | 46.8% |
[ 1.0% - 1.5% ] 1.21% | 11,994,521 | 49.9% |
[ 1.5% - 2.0% ] 1.70% | 4,674,992 | 48.7% |
[ 2.0% - 2.5% ] 2.22% | 1,876,410 | 51.1% |
[ 2.5% - 3.0% ] 2.71% | 1,718,118 | 43.3% |
[ 3.0% - 3.5% ] 3.19% | 907,805 | 50.3% |
[ 3.5% - 4.0% ] 3.72% | 579,623 | 50.7% |
[ 4.0% - 4.5% ] 4.16% | 259,870 | 46.5% |
[ 4.5% - 5.0% ] 4.82% | 289,329 | 43.2% |
[ 5.0% - 5.5% ] 5.30% | 206,372 | 48.1% |
[ 5.5% - 6.0% ] 5.86% | 93,741 | 55.8% |
[ 6.0% - 6.5% ] 6.19% | 93,912 | 40.1% |
[ 6.5% - 7.0% ] 6.80% | 100,450 | 51.4% |
[ 7.0% - 7.5% ] 7.29% | 18,197 | 54.3% |
[ 7.5% - 8.0% ] 7.72% | 219,764 | 41.9% |
[ 8.0% - 8.5% ] 8.19% | 85,590 | 41.1% |
[ 8.5% - 9.0% ] 8.83% | 55,874 | 49.6% |
[ 9.0% - 9.5% ] 9.37% | 1,089 | 42.9% |
[ 9.5% - 10.0% ] 9.63% | 46,102 | 39.7% |
[ 10.0% - 10.5% ] 10.48% | 59,333 | 43.5% |
[ 10.5% - 11.0% ] 10.61% | 12,465 | 28.3% |
[ 11.0% - 11.5% ] 11.27% | 125,203 | 32.7% |
[ 11.5% - 12.0% ] 11.85% | 26,345 | 40.9% |
[ 12.0% - 12.5% ] 12.20% | 41 | 52.9% |
[ 12.5% - 13.0% ] 12.55% | 26,807 | 31.3% |
[ 13.0% - 13.5% ] 13.21% | 24,740 | 39.3% |
[ 13.5% - 14.0% ] 13.69% | 6,903 | 57.3% |
[ 14.0% - 14.5% ] 14.05% | 121 | 61.3% |
[ 16.0% - 16.5% ] 16.30% | 92 | 43.1% |
[ 16.5% - 17.0% ] 16.90% | 5,194 | 45.4% |
[ 17.5% - 18.0% ] 17.95% | 234 | 35.0% |
[ 19.0% - 19.5% ] 19.01% | 142 | 41.3% |
[ 19.5% - 20.0% ] 19.58% | 1,144 | 86.8% |
[ 20.5% - 21.0% ] 20.92% | 239 | 42.2% |
[ 21.5% - 22.0% ] 21.98% | 323 | 73.9% |
[ 25.0% - 25.5% ] 25.00% | 60 | 13.2% |
[ 44.5% - 45.0% ] 44.74% | 38 | 71.4% |