Immigrants from Peru vs Immigrants from Hong Kong Wage/Income Gap
COMPARE
Immigrants from Peru
Immigrants from Hong Kong
Wage/Income Gap
Wage/Income Gap Comparison
Immigrants from Peru
Immigrants from Hong Kong
25.1%
WAGE/INCOME GAP
82.6/ 100
METRIC RATING
149th/ 347
METRIC RANK
25.5%
WAGE/INCOME GAP
64.0/ 100
METRIC RATING
165th/ 347
METRIC RANK
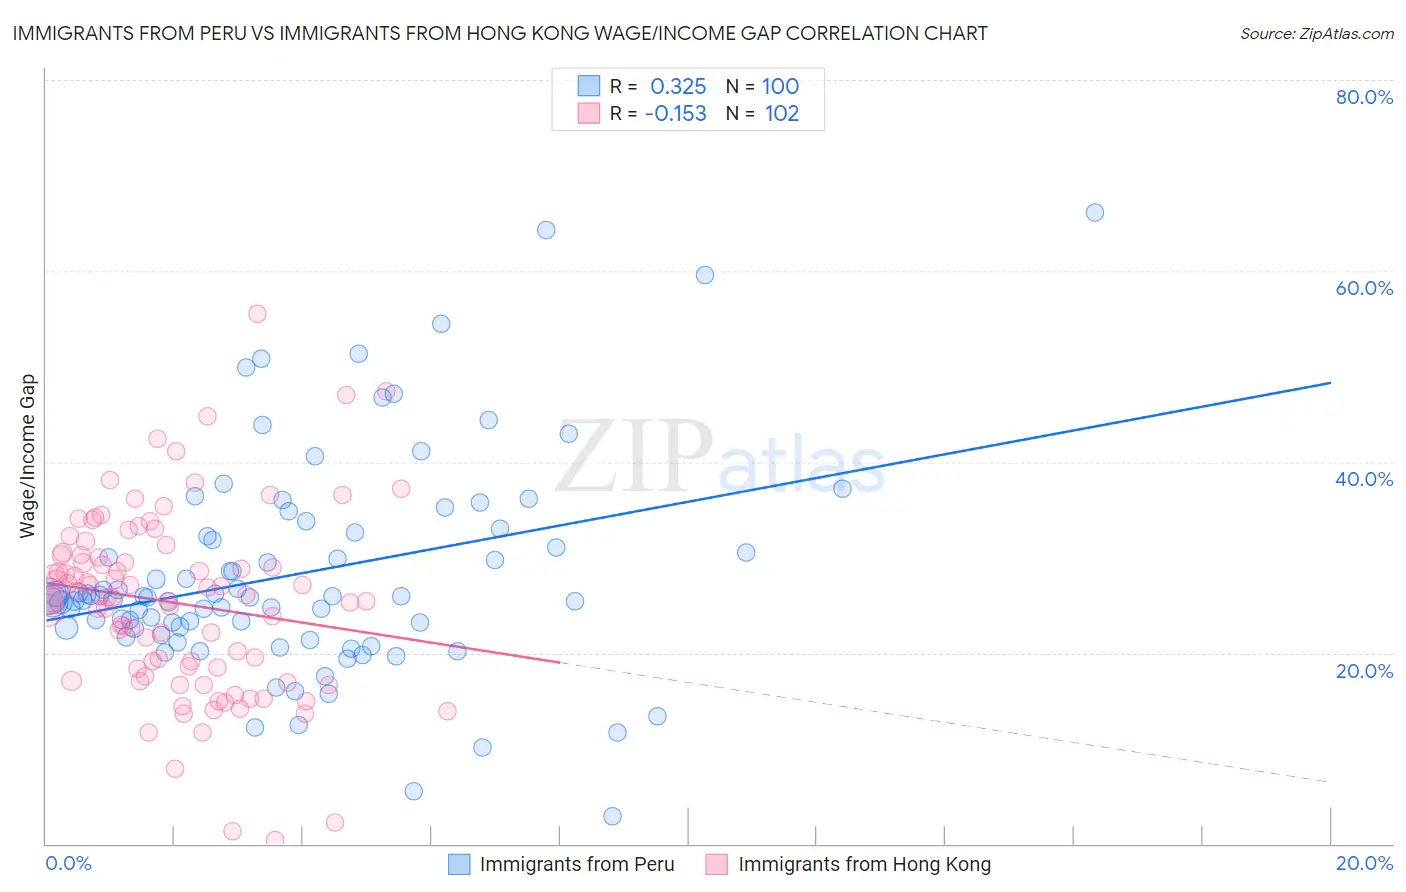
Immigrants from Peru vs Immigrants from Hong Kong Wage/Income Gap Correlation Chart
The statistical analysis conducted on geographies consisting of 328,741,739 people shows a mild positive correlation between the proportion of Immigrants from Peru and wage/income gap percentage in the United States with a correlation coefficient (R) of 0.325 and weighted average of 25.1%. Similarly, the statistical analysis conducted on geographies consisting of 253,936,651 people shows a poor negative correlation between the proportion of Immigrants from Hong Kong and wage/income gap percentage in the United States with a correlation coefficient (R) of -0.153 and weighted average of 25.5%, a difference of 1.7%.
Wage/Income Gap Correlation Summary
| Measurement | Immigrants from Peru | Immigrants from Hong Kong |
| Minimum | 2.9% | 0.36% |
| Maximum | 66.2% | 55.6% |
| Range | 63.3% | 55.2% |
| Mean | 28.2% | 25.2% |
| Median | 25.8% | 25.8% |
| Interquartile 25% (IQ1) | 22.6% | 18.3% |
| Interquartile 75% (IQ3) | 32.4% | 30.3% |
| Interquartile Range (IQR) | 9.8% | 11.9% |
| Standard Deviation (Sample) | 11.3% | 9.6% |
| Standard Deviation (Population) | 11.2% | 9.6% |
Demographics Similar to Immigrants from Peru and Immigrants from Hong Kong by Wage/Income Gap
In terms of wage/income gap, the demographic groups most similar to Immigrants from Peru are Immigrants (25.1%, a difference of 0.040%), Taiwanese (25.1%, a difference of 0.12%), Iroquois (25.1%, a difference of 0.15%), Uruguayan (25.2%, a difference of 0.16%), and Malaysian (25.0%, a difference of 0.28%). Similarly, the demographic groups most similar to Immigrants from Hong Kong are Immigrants from Ukraine (25.5%, a difference of 0.010%), Paiute (25.5%, a difference of 0.070%), Korean (25.4%, a difference of 0.34%), Native Hawaiian (25.4%, a difference of 0.37%), and Shoshone (25.4%, a difference of 0.38%).
| Demographics | Rating | Rank | Wage/Income Gap |
| Malaysians | 84.9 /100 | #147 | Excellent 25.0% |
| Iroquois | 83.9 /100 | #148 | Excellent 25.1% |
| Immigrants | Peru | 82.6 /100 | #149 | Excellent 25.1% |
| Immigrants | Immigrants | 82.3 /100 | #150 | Excellent 25.1% |
| Taiwanese | 81.6 /100 | #151 | Excellent 25.1% |
| Uruguayans | 81.3 /100 | #152 | Excellent 25.2% |
| Blackfeet | 78.1 /100 | #153 | Good 25.2% |
| Immigrants | Northern Africa | 78.1 /100 | #154 | Good 25.2% |
| Immigrants | Vietnam | 77.7 /100 | #155 | Good 25.2% |
| Immigrants | Mexico | 76.4 /100 | #156 | Good 25.3% |
| Costa Ricans | 75.8 /100 | #157 | Good 25.3% |
| Immigrants | Zimbabwe | 73.7 /100 | #158 | Good 25.3% |
| Puget Sound Salish | 73.0 /100 | #159 | Good 25.3% |
| French American Indians | 72.5 /100 | #160 | Good 25.4% |
| Albanians | 69.4 /100 | #161 | Good 25.4% |
| Shoshone | 69.0 /100 | #162 | Good 25.4% |
| Native Hawaiians | 69.0 /100 | #163 | Good 25.4% |
| Koreans | 68.6 /100 | #164 | Good 25.4% |
| Immigrants | Hong Kong | 64.0 /100 | #165 | Good 25.5% |
| Immigrants | Ukraine | 63.8 /100 | #166 | Good 25.5% |
| Paiute | 62.9 /100 | #167 | Good 25.5% |