Hmong vs Immigrants from Singapore Wage/Income Gap
COMPARE
Hmong
Immigrants from Singapore
Wage/Income Gap
Wage/Income Gap Comparison
Hmong
Immigrants from Singapore
27.7%
WAGE/INCOME GAP
1.0/ 100
METRIC RATING
266th/ 347
METRIC RANK
28.9%
WAGE/INCOME GAP
0.1/ 100
METRIC RATING
322nd/ 347
METRIC RANK
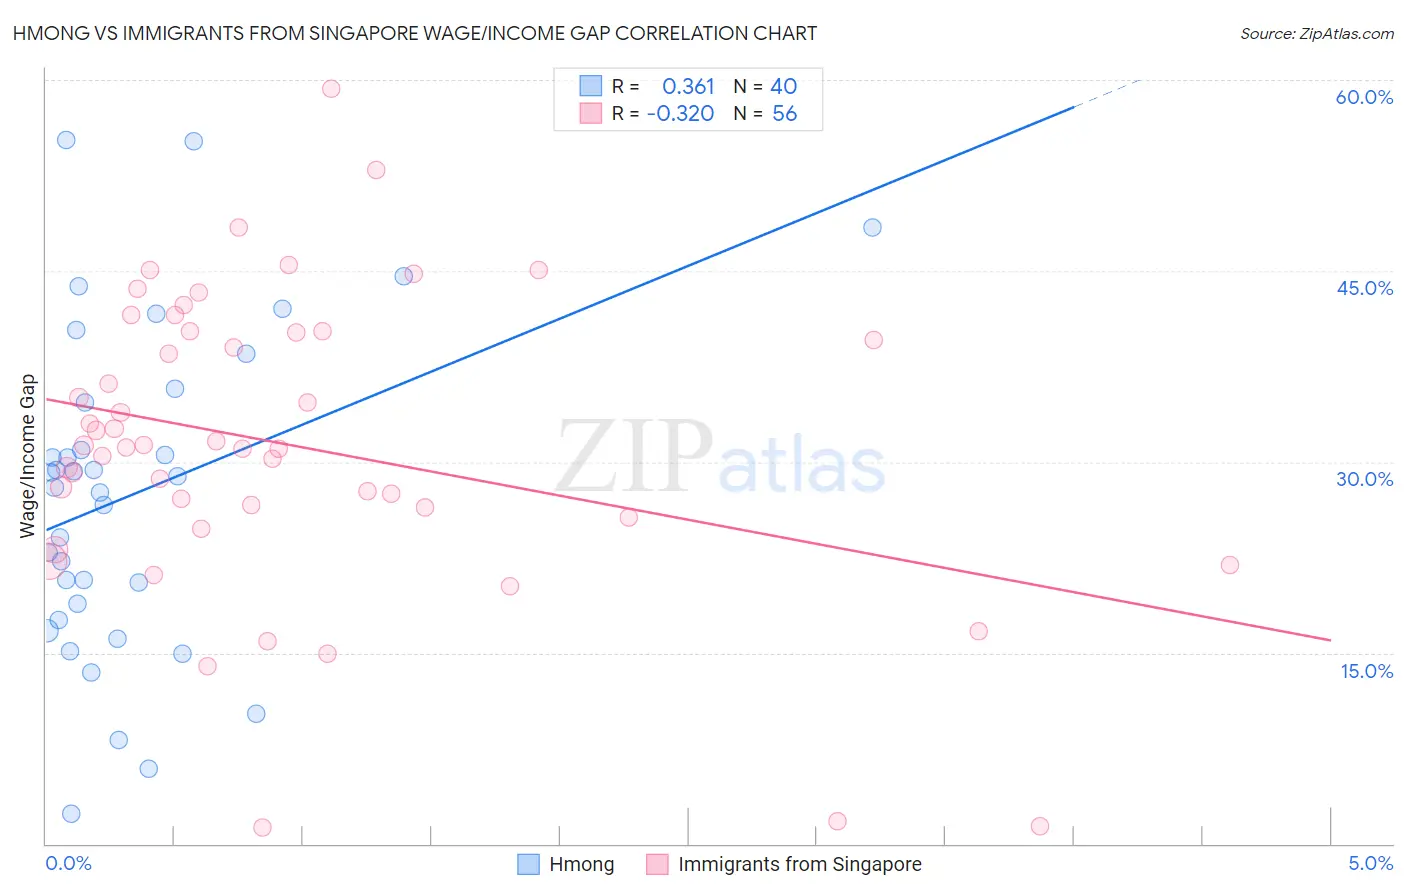
Hmong vs Immigrants from Singapore Wage/Income Gap Correlation Chart
The statistical analysis conducted on geographies consisting of 24,681,537 people shows a mild positive correlation between the proportion of Hmong and wage/income gap percentage in the United States with a correlation coefficient (R) of 0.361 and weighted average of 27.7%. Similarly, the statistical analysis conducted on geographies consisting of 137,510,142 people shows a mild negative correlation between the proportion of Immigrants from Singapore and wage/income gap percentage in the United States with a correlation coefficient (R) of -0.320 and weighted average of 28.9%, a difference of 4.4%.
Wage/Income Gap Correlation Summary
| Measurement | Hmong | Immigrants from Singapore |
| Minimum | 2.4% | 1.3% |
| Maximum | 55.2% | 59.3% |
| Range | 52.9% | 58.0% |
| Mean | 27.5% | 31.3% |
| Median | 28.4% | 31.2% |
| Interquartile 25% (IQ1) | 18.2% | 26.0% |
| Interquartile 75% (IQ3) | 35.2% | 40.2% |
| Interquartile Range (IQR) | 17.0% | 14.2% |
| Standard Deviation (Sample) | 12.7% | 11.9% |
| Standard Deviation (Population) | 12.6% | 11.8% |
Similar Demographics by Wage/Income Gap
Demographics Similar to Hmong by Wage/Income Gap
In terms of wage/income gap, the demographic groups most similar to Hmong are Serbian (27.7%, a difference of 0.0%), Immigrants from Switzerland (27.7%, a difference of 0.010%), Turkish (27.7%, a difference of 0.020%), New Zealander (27.7%, a difference of 0.10%), and Potawatomi (27.7%, a difference of 0.11%).
| Demographics | Rating | Rank | Wage/Income Gap |
| Icelanders | 1.8 /100 | #259 | Tragic 27.5% |
| Tongans | 1.7 /100 | #260 | Tragic 27.5% |
| Immigrants | Germany | 1.5 /100 | #261 | Tragic 27.5% |
| Immigrants | Lebanon | 1.5 /100 | #262 | Tragic 27.5% |
| Syrians | 1.4 /100 | #263 | Tragic 27.6% |
| Immigrants | Switzerland | 1.0 /100 | #264 | Tragic 27.7% |
| Serbians | 1.0 /100 | #265 | Tragic 27.7% |
| Hmong | 1.0 /100 | #266 | Tragic 27.7% |
| Turks | 1.0 /100 | #267 | Tragic 27.7% |
| New Zealanders | 1.0 /100 | #268 | Tragic 27.7% |
| Potawatomi | 0.9 /100 | #269 | Tragic 27.7% |
| Immigrants | Western Europe | 0.9 /100 | #270 | Tragic 27.8% |
| Ute | 0.8 /100 | #271 | Tragic 27.8% |
| Immigrants | Korea | 0.8 /100 | #272 | Tragic 27.8% |
| Bulgarians | 0.7 /100 | #273 | Tragic 27.8% |
Demographics Similar to Immigrants from Singapore by Wage/Income Gap
In terms of wage/income gap, the demographic groups most similar to Immigrants from Singapore are Welsh (28.9%, a difference of 0.020%), British (28.9%, a difference of 0.080%), Norwegian (29.0%, a difference of 0.11%), Slovak (28.9%, a difference of 0.15%), and Croatian (29.0%, a difference of 0.23%).
| Demographics | Rating | Rank | Wage/Income Gap |
| Maltese | 0.1 /100 | #315 | Tragic 28.7% |
| Lithuanians | 0.1 /100 | #316 | Tragic 28.7% |
| Belgians | 0.1 /100 | #317 | Tragic 28.8% |
| Basques | 0.1 /100 | #318 | Tragic 28.8% |
| Slovaks | 0.1 /100 | #319 | Tragic 28.9% |
| British | 0.1 /100 | #320 | Tragic 28.9% |
| Welsh | 0.1 /100 | #321 | Tragic 28.9% |
| Immigrants | Singapore | 0.1 /100 | #322 | Tragic 28.9% |
| Norwegians | 0.1 /100 | #323 | Tragic 29.0% |
| Croatians | 0.0 /100 | #324 | Tragic 29.0% |
| Hungarians | 0.0 /100 | #325 | Tragic 29.0% |
| Immigrants | Belgium | 0.0 /100 | #326 | Tragic 29.0% |
| Immigrants | Iran | 0.0 /100 | #327 | Tragic 29.1% |
| Scandinavians | 0.0 /100 | #328 | Tragic 29.1% |
| Scottish | 0.0 /100 | #329 | Tragic 29.1% |