Hmong vs Immigrants from China Wage/Income Gap
COMPARE
Hmong
Immigrants from China
Wage/Income Gap
Wage/Income Gap Comparison
Hmong
Immigrants from China
27.7%
WAGE/INCOME GAP
1.0/ 100
METRIC RATING
266th/ 347
METRIC RANK
26.7%
WAGE/INCOME GAP
10.3/ 100
METRIC RATING
214th/ 347
METRIC RANK
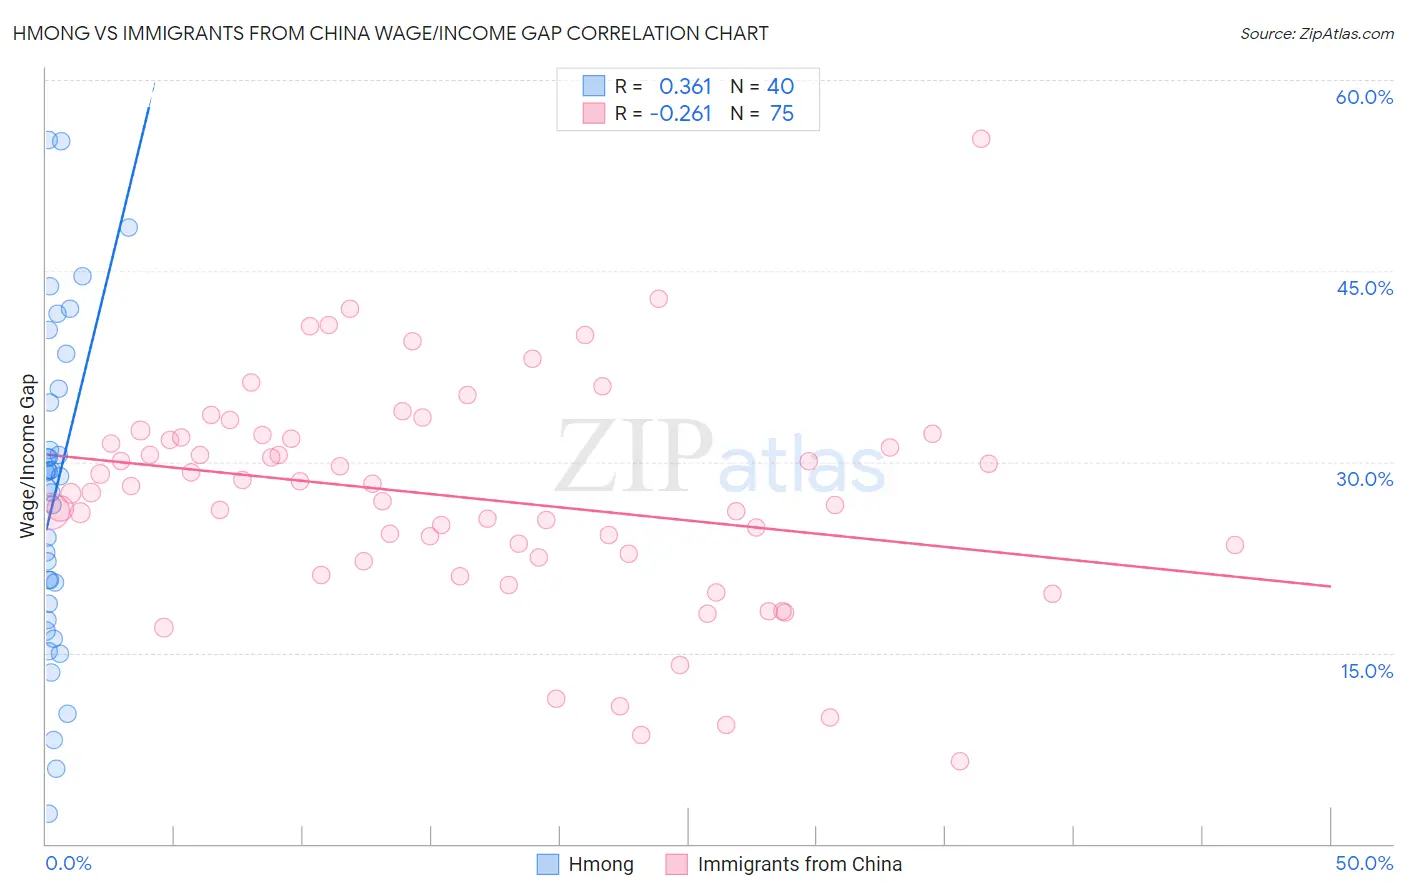
Hmong vs Immigrants from China Wage/Income Gap Correlation Chart
The statistical analysis conducted on geographies consisting of 24,681,537 people shows a mild positive correlation between the proportion of Hmong and wage/income gap percentage in the United States with a correlation coefficient (R) of 0.361 and weighted average of 27.7%. Similarly, the statistical analysis conducted on geographies consisting of 456,702,733 people shows a weak negative correlation between the proportion of Immigrants from China and wage/income gap percentage in the United States with a correlation coefficient (R) of -0.261 and weighted average of 26.7%, a difference of 3.8%.
Wage/Income Gap Correlation Summary
| Measurement | Hmong | Immigrants from China |
| Minimum | 2.4% | 6.5% |
| Maximum | 55.2% | 55.3% |
| Range | 52.9% | 48.9% |
| Mean | 27.5% | 27.2% |
| Median | 28.4% | 27.6% |
| Interquartile 25% (IQ1) | 18.2% | 22.4% |
| Interquartile 75% (IQ3) | 35.2% | 31.9% |
| Interquartile Range (IQR) | 17.0% | 9.5% |
| Standard Deviation (Sample) | 12.7% | 8.7% |
| Standard Deviation (Population) | 12.6% | 8.6% |
Similar Demographics by Wage/Income Gap
Demographics Similar to Hmong by Wage/Income Gap
In terms of wage/income gap, the demographic groups most similar to Hmong are Serbian (27.7%, a difference of 0.0%), Immigrants from Switzerland (27.7%, a difference of 0.010%), Turkish (27.7%, a difference of 0.020%), New Zealander (27.7%, a difference of 0.10%), and Potawatomi (27.7%, a difference of 0.11%).
| Demographics | Rating | Rank | Wage/Income Gap |
| Icelanders | 1.8 /100 | #259 | Tragic 27.5% |
| Tongans | 1.7 /100 | #260 | Tragic 27.5% |
| Immigrants | Germany | 1.5 /100 | #261 | Tragic 27.5% |
| Immigrants | Lebanon | 1.5 /100 | #262 | Tragic 27.5% |
| Syrians | 1.4 /100 | #263 | Tragic 27.6% |
| Immigrants | Switzerland | 1.0 /100 | #264 | Tragic 27.7% |
| Serbians | 1.0 /100 | #265 | Tragic 27.7% |
| Hmong | 1.0 /100 | #266 | Tragic 27.7% |
| Turks | 1.0 /100 | #267 | Tragic 27.7% |
| New Zealanders | 1.0 /100 | #268 | Tragic 27.7% |
| Potawatomi | 0.9 /100 | #269 | Tragic 27.7% |
| Immigrants | Western Europe | 0.9 /100 | #270 | Tragic 27.8% |
| Ute | 0.8 /100 | #271 | Tragic 27.8% |
| Immigrants | Korea | 0.8 /100 | #272 | Tragic 27.8% |
| Bulgarians | 0.7 /100 | #273 | Tragic 27.8% |
Demographics Similar to Immigrants from China by Wage/Income Gap
In terms of wage/income gap, the demographic groups most similar to Immigrants from China are Immigrants from Iraq (26.7%, a difference of 0.010%), Yugoslavian (26.7%, a difference of 0.090%), Immigrants from Portugal (26.7%, a difference of 0.13%), Iraqi (26.6%, a difference of 0.16%), and Mongolian (26.6%, a difference of 0.19%).
| Demographics | Rating | Rank | Wage/Income Gap |
| Immigrants | Italy | 15.8 /100 | #207 | Poor 26.5% |
| Egyptians | 12.7 /100 | #208 | Poor 26.6% |
| Immigrants | Kuwait | 12.6 /100 | #209 | Poor 26.6% |
| Arabs | 12.3 /100 | #210 | Poor 26.6% |
| Mongolians | 11.4 /100 | #211 | Poor 26.6% |
| Iraqis | 11.2 /100 | #212 | Poor 26.6% |
| Immigrants | Iraq | 10.3 /100 | #213 | Poor 26.7% |
| Immigrants | China | 10.3 /100 | #214 | Poor 26.7% |
| Yugoslavians | 9.7 /100 | #215 | Tragic 26.7% |
| Immigrants | Portugal | 9.5 /100 | #216 | Tragic 26.7% |
| Brazilians | 9.2 /100 | #217 | Tragic 26.7% |
| Immigrants | Saudi Arabia | 9.1 /100 | #218 | Tragic 26.7% |
| Immigrants | Poland | 8.9 /100 | #219 | Tragic 26.7% |
| Immigrants | Latvia | 8.9 /100 | #220 | Tragic 26.7% |
| Immigrants | Spain | 8.5 /100 | #221 | Tragic 26.8% |