Hmong College, 1 year or more
COMPARE
Hmong
Select to Compare
College, 1 year or more
Hmong College, 1 year or more
57.2%
COLLEGE, 1 YEAR OR MORE
5.4/ 100
METRIC RATING
224th/ 347
METRIC RANK
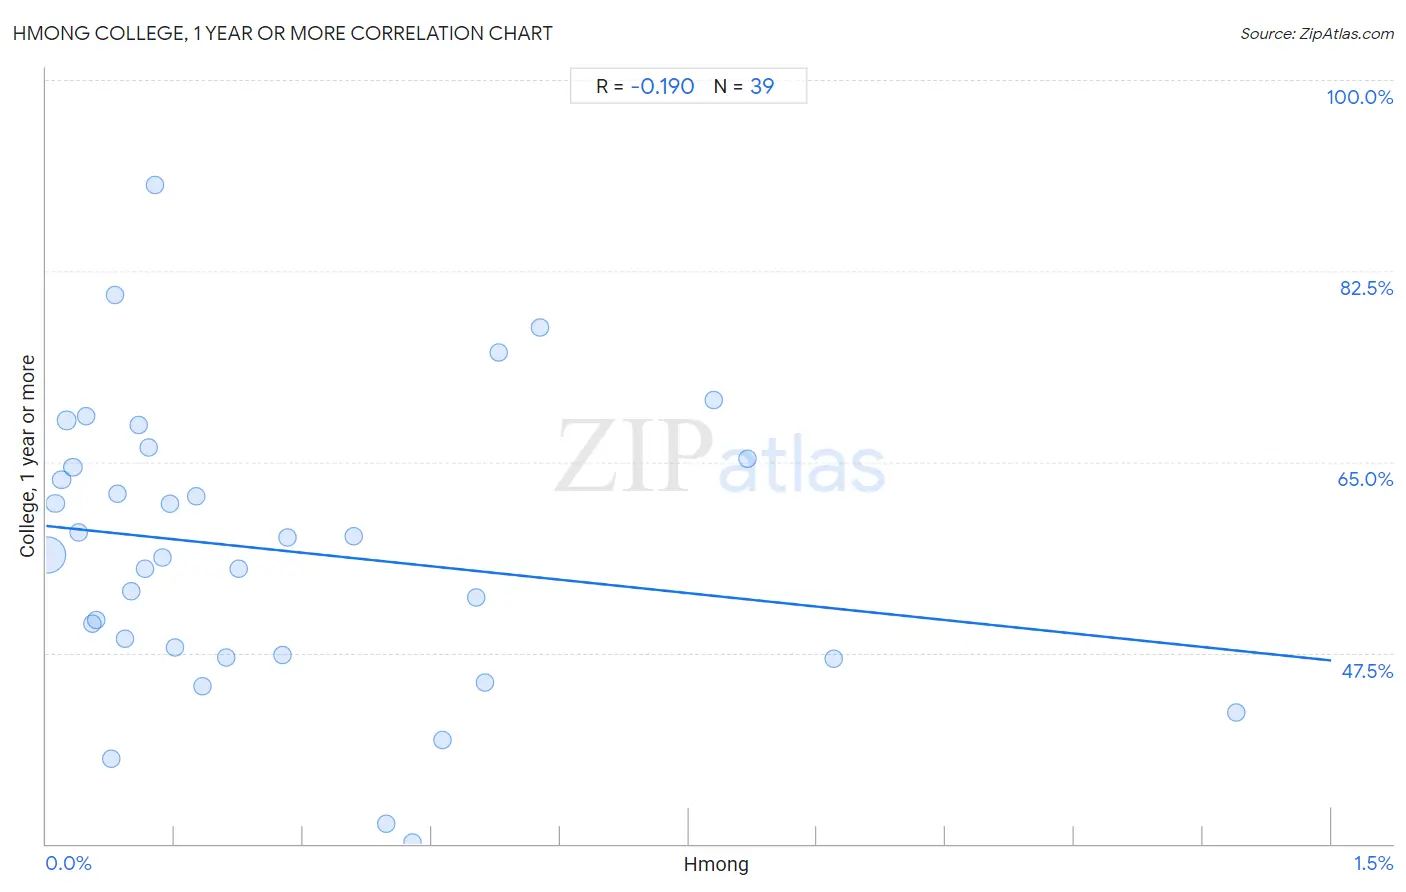
Hmong College, 1 year or more Correlation Chart
The statistical analysis conducted on geographies consisting of 24,680,511 people shows a poor negative correlation between the proportion of Hmong and percentage of population with at least college, 1 year or more education in the United States with a correlation coefficient (R) of -0.190 and weighted average of 57.2%. On average, for every 1% (one percent) increase in Hmong within a typical geography, there is a decrease of 8.2% in percentage of population with at least college, 1 year or more education.
It is essential to understand that the correlation between the percentage of Hmong and percentage of population with at least college, 1 year or more education does not imply a direct cause-and-effect relationship. It remains uncertain whether the presence of Hmong influences an upward or downward trend in the level of percentage of population with at least college, 1 year or more education within an area, or if Hmong simply ended up residing in those areas with higher or lower levels of percentage of population with at least college, 1 year or more education due to other factors.
Demographics Similar to Hmong by College, 1 year or more
In terms of college, 1 year or more, the demographic groups most similar to Hmong are Portuguese (57.2%, a difference of 0.0%), Subsaharan African (57.3%, a difference of 0.17%), Vietnamese (57.0%, a difference of 0.21%), Immigrants from Western Africa (57.0%, a difference of 0.23%), and Immigrants (57.0%, a difference of 0.30%).
| Demographics | Rating | Rank | College, 1 year or more |
| Immigrants from Panama | 9.1 /100 | #217 | Tragic 57.6% |
| Native Hawaiians | 9.0 /100 | #218 | Tragic 57.6% |
| Whites/Caucasians | 8.7 /100 | #219 | Tragic 57.6% |
| Immigrants from Costa Rica | 8.0 /100 | #220 | Tragic 57.5% |
| Immigrants from Ghana | 7.7 /100 | #221 | Tragic 57.4% |
| Sub-Saharan Africans | 6.1 /100 | #222 | Tragic 57.3% |
| Portuguese | 5.4 /100 | #223 | Tragic 57.2% |
| Hmong | 5.4 /100 | #224 | Tragic 57.2% |
| Vietnamese | 4.7 /100 | #225 | Tragic 57.0% |
| Immigrants from Western Africa | 4.6 /100 | #226 | Tragic 57.0% |
| Immigrants | 4.4 /100 | #227 | Tragic 57.0% |
| Immigrants from Fiji | 4.0 /100 | #228 | Tragic 56.9% |
| Cree | 3.6 /100 | #229 | Tragic 56.8% |
| Liberians | 3.1 /100 | #230 | Tragic 56.7% |
| Immigrants from Burma/Myanmar | 2.7 /100 | #231 | Tragic 56.6% |
Hmong College, 1 year or more Correlation Summary
| Measurement | Hmong Data | College, 1 year or more Data |
| Minimum | 0.0014% | 30.1% |
| Maximum | 1.4% | 90.4% |
| Range | 1.4% | 60.4% |
| Mean | 0.27% | 56.9% |
| Median | 0.14% | 56.5% |
| Interquartile 25% (IQ1) | 0.076% | 47.3% |
| Interquartile 75% (IQ3) | 0.43% | 65.3% |
| Interquartile Range (IQR) | 0.35% | 18.0% |
| Standard Deviation (Sample) | 0.30% | 13.1% |
| Standard Deviation (Population) | 0.30% | 12.9% |
Correlation Details
| Hmong Percentile | Sample Size | College, 1 year or more |
[ 0.0% - 0.5% ] 0.0014% | 20,776,297 | 56.5% |
[ 0.0% - 0.5% ] 0.011% | 606,587 | 61.2% |
[ 0.0% - 0.5% ] 0.018% | 619,819 | 63.3% |
[ 0.0% - 0.5% ] 0.024% | 529,135 | 68.8% |
[ 0.0% - 0.5% ] 0.031% | 540,131 | 64.5% |
[ 0.0% - 0.5% ] 0.038% | 194,445 | 58.6% |
[ 0.0% - 0.5% ] 0.047% | 199,126 | 69.2% |
[ 0.0% - 0.5% ] 0.053% | 232,793 | 50.2% |
[ 0.0% - 0.5% ] 0.058% | 35,976 | 50.5% |
[ 0.0% - 0.5% ] 0.076% | 17,117 | 37.7% |
[ 0.0% - 0.5% ] 0.080% | 73,735 | 80.3% |
[ 0.0% - 0.5% ] 0.084% | 41,849 | 62.0% |
[ 0.0% - 0.5% ] 0.092% | 60,986 | 48.8% |
[ 0.0% - 0.5% ] 0.099% | 51,765 | 53.2% |
[ 0.0% - 0.5% ] 0.11% | 103,080 | 68.4% |
[ 0.0% - 0.5% ] 0.11% | 49,747 | 55.2% |
[ 0.0% - 0.5% ] 0.12% | 72,435 | 66.3% |
[ 0.0% - 0.5% ] 0.13% | 15,779 | 90.4% |
[ 0.0% - 0.5% ] 0.14% | 38,964 | 56.2% |
[ 0.0% - 0.5% ] 0.14% | 25,625 | 61.1% |
[ 0.0% - 0.5% ] 0.15% | 39,182 | 48.0% |
[ 0.0% - 0.5% ] 0.17% | 25,176 | 61.9% |
[ 0.0% - 0.5% ] 0.18% | 51,926 | 44.4% |
[ 0.0% - 0.5% ] 0.21% | 12,892 | 47.1% |
[ 0.0% - 0.5% ] 0.22% | 50,298 | 55.2% |
[ 0.0% - 0.5% ] 0.28% | 2,534 | 47.3% |
[ 0.0% - 0.5% ] 0.28% | 15,628 | 58.1% |
[ 0.0% - 0.5% ] 0.36% | 44,073 | 58.2% |
[ 0.0% - 0.5% ] 0.40% | 503 | 31.8% |
[ 0.0% - 0.5% ] 0.43% | 8,418 | 30.1% |
[ 0.0% - 0.5% ] 0.46% | 4,965 | 39.5% |
[ 0.5% - 1.0% ] 0.50% | 796 | 52.6% |
[ 0.5% - 1.0% ] 0.51% | 64,952 | 44.8% |
[ 0.5% - 1.0% ] 0.53% | 7,567 | 75.1% |
[ 0.5% - 1.0% ] 0.58% | 9,203 | 77.3% |
[ 0.5% - 1.0% ] 0.78% | 11,544 | 70.7% |
[ 0.5% - 1.0% ] 0.82% | 10,997 | 65.3% |
[ 0.5% - 1.0% ] 0.92% | 34,178 | 47.0% |
[ 1.0% - 1.5% ] 1.39% | 288 | 42.1% |